Fermi/LAT Study of the Cygnus Loop Supernova Remnant: Discovery of a Point-like Source and of Spectral Differences in its gamma-ray emission
Abstract
The Cygnus Loop is a nearby supernova remnant (SNR) observed across the electromagnetic spectrum. With the analysis of 6 years of Fermi/LAT data we find that, what previous studies had considered a single source, consists of an extended source plus a point-like source south-east of the SNR. The extended gamma-ray emission is well correlated with the thermal X-ray emission of the SNR, and the energy spectrum displays a pronounced maximum at GeV. However, in a region where the radio emission is strongly and distinctly polarized, the gamma-ray spectrum shows no sign of a break. Therefore, the spatially resolved gamma-ray emission permits the study of different interaction conditions of the SNR and the surrounding medium.
I INTRODUCTION
The Cygnus Loop is the remnant of a core-collapse supernova explosion that occurred about 14000 year ago (Levenson et al., 1998) at a distance of pc (Blair et al., 2005). The Cygnus Loop is among the closest supernova remnants (SNRs) to Earth, which implies that it could act as a local accelerator. Due to its proximity, the Cygnus Loop is seen on the sky with an angular size of about 3 degrees. In general, the blast wave of the SNR is not breaking out of a dense cloud, but running into a wall of atomic gas related to the cavity in which the supernova occurred. The wall slows down the shock, which becomes bright in optical emission lines. The reflected shock propagates through the hot interior, which enhances the X-ray emission in correlation with the optical emission (Graham et al., 1995; Levenson et al., 1996). However, some portions of the shock proceed unimpeded through low-density inter-cloud medium.
X-ray emission from reflection-shocked gas is particularly bright in the east. In contrast, the south of the SNR (the so-called breakout) is very dim in X-rays. This is often regarded as caused by the expansion of the blast wave into a low-density medium. However, Uyanıker et al. (2002) found that the polarization of the 2695 MHz emission was much higher there with respect to the north of the shell. A possible interpretation of this feature is that a second SNR is present in that region, and interacts with the Cygnus Loop.
No compact object is firmly associated with the collapsed progenitor of the Cygnus Loop. A few candidates lie within the breakout, where the ASCA survey revealed a point-like source, but it is not firmly established as a neutron star (Miyata et al., 2001). There is yet another compact object with a candidate pulsar wind nebula nearby, revealed by Suzaku and XMM-Newton observations (Katsuda et al., 2012). No pulsations have been detected from any of these objects. In addition, a very high transverse proper motion of km s-1 is needed if it is assumed that one of these candidate neutron stars departed from the geometric center of the Cygnus Loop some 14000 years ago. Such a supersonic movement would produce a cometary shape in the X-ray emission that has not been observed so far. However, this could be explained if the neutron star was related to the second SNR suggested by Uyanıker et al. (2002).
The detection of GeV gamma-ray emission from the Cygnus Loop was published in Katagiri et al. (2011), who analyzed two years of Fermi/LAT data comprised between August 2008 and August 2010. In this analysis, the shape of the Cygnus Loop was modeled as a ring, somewhat more extended than the shell seen at other wavelengths. The spectrum is curved (modeled as a log-parabola), and the fit to a one-zone hadronic model returns plausible values for the parameters.
In this work we analyze six years of Fermi/LAT data using the latest software. The factor 3 increase in statistics with respect to the previous study provides unprecedented sensitivity to study both spatial and spectral features of the gamma-ray emission from the Cygnus Loop.
II DATA ANALYSIS
We analyzed Fermi/LAT Pass 7 Reprocessed data corresponding to the period between August 2008 (start of science operations) and September 2014. We defined the ROI as a circle of radius centered at the position (RA, DEC) = (, ), J2000, which is displaced towards negative Galactic latitudes with respect to the catalog position of the Cygnus Loop. This is done in order to be less affected by the diffuse emission from the Galactic plane. Data were processed with the version v9r32p5 of the ScienceTools. We selected class 3 events in the energy range between 58.5 MeV and 300 GeV, with the recommended quality cuts (including the requirement for the spacecraft to be in normal operation mode, LAT_CONFIG=1, data to be flagged as good quality, DATA_QUAL=1, and a cut on the rocking angle of the spacecraft, ABS(ROCK_ANGLE)). In addition, we applied a zenith angle cut of in order to prevent event contamination from the Earth limb. Data were binned in sky coordinates with the gtbin tool, using square bins of side. This tool produces a counts map, with the number of events recorded by the detector.
We performed a binned likelihood analysis with a model containing the standard Galactic and extra-galactic diffuse emission models provided in the ScienceTools, plus the sources in the 2FGL catalog lying up to away of the ROI center. We call the model with the point-like sources plus the Galactic and extra-galactic backgrounds the null hypothesis, which has a maximum likelihood . Then, we generate alternative models by adding spatial templates and by changing the functions describing spectral shape. By varying the parameters of each models, we compute the corresponding maximum likelihood . We choose the best representation of the Cygnus Loop as the model which obtains the highest value of the likelihood ratio LR=.
For any of the tested models, we can use the tool gtmodel to produce an expected counts map given the exposure associated to the data set. For visualization purposes, we produce what we call the S/N map by subtracting the expected counts map from the actual counts maps, and then dividing by the square root of the expected counts map.
Complementary to the Fermi/LAT data analysis, we have re-analyzed the 11 cm radio emission observed by the 100 m Effelsberg telescope. Uyanıker et al. (2002) proposed the Cygnus Loop be divided in two regions for the two-SNR interpretation. Based on our re-analysis, which considers the presence of extended Stokes I radio emission in addition to the distinct and intensely polarized radio emission, we have re-defined the regions to be more equal in size and both having a circular shape. We consider that the southwest (SW) feature is the circular region of radius centered at (RA, DEC) = (, ) as shown in Figure 1.
III RESULTS
III.1 Morphology
The S/N maps at different energy ranges, produced with the null hypothesis are shown in Figure 1. While an extended source is clearly seen at energies below 10 GeV, in the last panel only residual, localized emission is present south of the SNR.
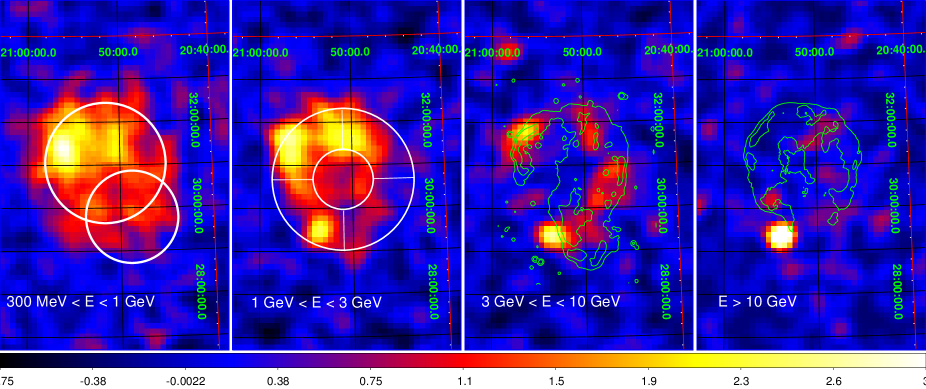
As a first step we reproduced the analysis from Katagiri et al. (2011). For this purpose we modeled the Cygnus Loop as a ring of 1.6/0.7 degree outer/inner diameter, centered at (RA, DEC) = (, ). The ring is divided in four quadrants, and the spectral parameters of all of them are varied simultaneously. We note that the hard spot remaining above 10 GeV is included in the southeast (SE) quadrant of the ring used in Katagiri et al. (2011). By substituting the SE quadrant by a point-like source, we find that LR improves by 124. The position of this point-like source optimized by the tool gtfindsrc is (RA, DEC) = (, ) with an uncertainty of . We call this source J2053.9+2924. Its position is coincident with the X-ray and radio source 2E 2051.7+2911, which is likely an AGN (Brinkmann et al., 1997). Therefore, we consider that J2053.9+2924 is a source in the background of the Cygnus Loop, and should not intervene in the modeling of the diffuse emission222The point-like source found in this analysis is called 3FGL J2053.9+2922 in the recently published Third Fermi/LAT Source Catalog (The Fermi-LAT Collaboration, 2015). We note that the source overlaps with the template for the Cygnus Loop, which in 3FGL is still modeled as the ring defined in Katagiri et al. (2011)..
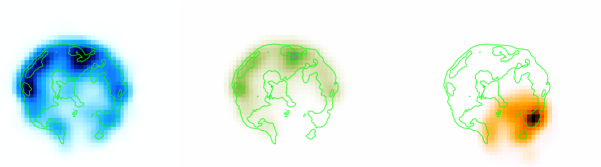
Having included J2053.9+2924 in the list of point-like sources, we maximize the likelihood of a template generated from the X-ray counts map observed by ROSAT (Aschenbach and Leahy, 1999), re-binned to match the pixel size of maps of the present analysis. The likelihood ratios for the spatial models mentioned above are shown in Table 1. It is clear that the thermal X-ray emission correlates very well with the observed gamma-ray emission, and requires less degrees of freedom than the ring to describe it.
| Model | LR | d.o.f |
|---|---|---|
| 0) Null hypothesis | 0 | 0 |
| 1) Ring | 2069 | 12 |
| Divided in four quadrants | ||
| 2) 3/4 Ring | 2193 | 12 |
| SE quadrant substituted by J2053.9+2924 | ||
| 3) ROSAT template | 2204 | 6 |
| 4) ROSAT template | 2238 | 8 |
| Divided in NE and SW |
The X-ray emission is very faint in the region of highly polarized radio emission, but we divide the spatial template in order to study this particular region. The templates for the main (NE) emission is cropped to avoid having pixels accounted for twice in the overlapping region (Figure 2). We verify that both regions contribute significantly to the overall emission. Next, we proceed to test different the spectral models.
III.2 Spectrum
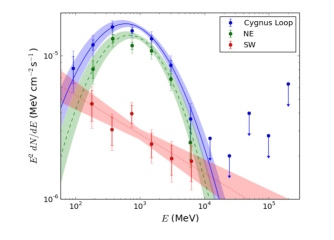
The energy spectrum of the source is shown in Figure 3. The global emission, as well as the emission of the NE region are well described by a log-parabolic shape. To infer the spectral shape of the SW region, we test a power-law shape, a log-parabolic shape, and a power law with exponential cutoff. Because of the proximity of J2053+2923 to this region, we also test all three possible models for the point-like source. Then, we evaluate the likelihood ratio of each combination with respect to the initial assumption of both components having power-law shaped spectrum. We observe that models where J2053+2923 has an additional degree of freedom in the spectrum have a likelihood ratio with respect to the power-law/power-law hypothesis of , whereas models where the additional degree of freedom is added to the SW region only improve the likelihood ratio by . Therefore, we conclude that there is evidence that the spectrum of J2053+2923 is curved, whereas the spectrum of the SW region is compatible with being a simple power law. The best fit spectral parameters of the global emission and the studied regions are shown in Table 2.
| Region | Flux | ||
|---|---|---|---|
| ph cm-2s-1 | |||
| Cygnus Loop | |||
| NE | |||
| SW |
III.3 The point-like source J2053+2923
The point-like source South of the Cygnus Loop is detected with high significance (TS=214). As mentioned in Section III.2, the spectrum is described either by a power law with exponential cutoff or by a log-parabolic shape, but the power law with exponential cutoff hypothesis is slightly preferred. The cutoff energy is GeV, while the spectral index below the cutoff is . The source is not significantly detected at low energies. Using the same spectral binning as for the Cygnus Loop, the flux is measurable (TS) between 1 GeV and 72 GeV, making this source a candidate very-high-energy emitter. We also performed an unbinned likelihood analysis in time intervals of 60 days. The source is detected with TS in 13 out of 37 such intervals. This hint of variability supports the association with the background AGN, 2E 2051.7+2911.
IV CONCLUSIONS
Due to its proximity and angular size, the Cygnus Loop permits spatially resolved studies of different parts of the SNR, that interact with different components of surrounding medium. Particularly, it is known that the NE of the shell interacts with relatively dense medium and is thus bright in X-rays and optical emission lines compared to other parts of the shell. These inhomogeneities are likely to happen in other remnants from core-collapse supernovae, while remaining unnoticed due to lack of resolution of the instruments. Understanding the physical mechanisms that power the gamma-ray emission of the Cygnus Loop, and the differences between different regions of the shell, may help understand the variety of spectral shapes that SNRs display at gamma-ray energies.
The fact that most of the gamma-ray emission from the Cygnus Loop follows closely the thermal X-ray emission from shocked matter supports the idea that most of its gamma-ray emission is emitted by interactions of accelerated hadrons with the dense medium. In this case, a low-energy break is expected in the spectrum due to the production threshold of neutral pions (Ackermann et al., 2013).This is the case for the energy spectrum measured in this analysis, which has a maximum around 0.6 GeV. However, the SW portion of shell (which is brighter in radio and fainter in X-rays), has a different gamma-ray spectrum without indication of a spectral break. The explanation for the different gamma-ray properties, and the related radiative processes of the two regions, including the two-SNR scenario, is under investigation.
Acknowledgements.
This work was supported by the interdisciplinary project Labex UnivEarthS from Sorbonne Paris cité (ANR-10-LABX-0023 and ANR- 11-IDEX-0005-02). We also acknowledge support by NSERC through the Canada Research Chairs and Discovery Grants programs.References
- Levenson et al. (1998) N. A. Levenson, J. R. Graham, L. D. Keller, and M. J. Richter, ApJS 118, 541 (1998), eprint arXiv:astro-ph/9805008.
- Blair et al. (2005) W. P. Blair, R. Sankrit, and J. C. Raymond, AJ 129, 2268 (2005).
- Graham et al. (1995) J. R. Graham, N. A. Levenson, J. J. Hester, J. C. Raymond, and R. Petre, Astrophys. J. 444, 787 (1995).
- Levenson et al. (1996) N. A. Levenson, J. R. Graham, J. J. Hester, and R. Petre, Astrophys. J. 468, 323 (1996).
- Uyanıker et al. (2002) B. Uyanıker, W. Reich, A. Yar, R. Kothes, and E. Fürst, A&A 389, L61 (2002), eprint arXiv:astro-ph/0205443.
- Miyata et al. (2001) E. Miyata, K. Ohta, K. Torii, T. Takeshima, H. Tsunemi, T. Hasegawa, and Y. Hashimoto, Astrophys. J. 550, 1023 (2001), eprint arXiv:astro-ph/0011535.
- Katsuda et al. (2012) S. Katsuda, H. Tsunemi, K. Mori, H. Uchida, R. Petre, S. Yamada, and T. Tamagawa, ApJ 754, L7 (2012), eprint 1206.4367.
- Katagiri et al. (2011) H. Katagiri, L. Tibaldo, J. Ballet, F. Giordano, I. A. Grenier, T. A. Porter, M. Roth, O. Tibolla, Y. Uchiyama, and R. Yamazaki, Astrophys. J. 741, 44 (2011), eprint 1108.1833.
- Aschenbach and Leahy (1999) B. Aschenbach and D. A. Leahy, A&A 341, 602 (1999).
- Brinkmann et al. (1997) W. Brinkmann, J. Siebert, E. D. Feigelson, R. I. Kollgaard, S. A. Laurent-Muehleisen, W. Reich, E. Fuerst, P. Reich, W. Voges, J. Truemper, et al., A&A 323, 739 (1997).
- The Fermi-LAT Collaboration (2015) The Fermi-LAT Collaboration, ArXiv e-prints (2015), eprint 1501.02003.
- Ackermann et al. (2013) M. Ackermann, M. Ajello, A. Allafort, L. Baldini, J. Ballet, G. Barbiellini, M. G. Baring, D. Bastieri, K. Bechtol, R. Bellazzini, et al., Science 339, 807 (2013), eprint 1302.3307.