Stiffening of Red Blood Cells Induced by Disordered Cytoskeleton Structures: A Joint Theory-experiment Study
Abstract
The functions and elasticities of the cell are largely related to the structures of the cytoskeletons underlying the lipid bi-layer. Among various cell types, the Red Blood Cell (RBC) possesses a relatively simple cytoskeletal structure. Underneath the membrane, the RBC cytoskeleton takes the form of a two dimensional triangular network, consisting of nodes of actins (and other proteins) and edges of spectrins. Recent experiments focusing on the malaria infected RBCs (iRBCs) showed that there is a correlation between the elongation of spectrins in the cytoskeletal network and the stiffening of the iRBCs. Here we rationalize the correlation between these two observations by combining the worm-like chain (WLC) model for single spectrins and the Effective Medium Theory (EMT) for the network elasticity. We specifically focus on how the disorders in the cytoskeletal network affect its macroscopic elasticity. Analytical and numerical solutions from our model reveal that the stiffness of the membrane increases with increasing end-to-end distances of spectrins, but has a non-monotonic dependence on the variance of the end-to-end distance distributions. These predictions are verified quantitively by our AFM and micropipette aspiration measurements of iRBCs. The model may, from a molecular level, provide guidelines for future identification of new treatment methods for RBC related diseases, such as malaria infection.
I INTRODUCTION
The mechanical properties of a system are largely dictated by its structure. The property-structure relationship has been studied extensively in different fields in physics and engineering(e.g., Discher et al. (1994); Suresh (2006); Broedersz and MacKintosh (2014), etc.). In recent years, networks in biological systems have drawn much attention due to their close relationships to the functions of organisms. Example systems of biopolymer networks are cytoskeletons in various cells, which can be quasi-1-dimensional (e.g., axons of neuron cellsXu et al. (2012); Lai and Cao (2014)), 2-dimensional (e.g., red blood cells (RBCs)), or 3-dimensional. A biopolymer network can behave very differently from a network made of synthesized polymers. Firstly, biopolymer networks can be active with the participation of ATPsKim and Cao . Secondly, the components of a biopolymer network usually follow the worm-like chain (WLC) behavior, whose elasticity has an entropic origin and thus a nonlinear dependence on the end-to-end distance of corresponding bio-filaments.
On the cellular level, the biological functions and behaviors of cells are related to their mechanical propertiesSuresh (2006); Huang et al. (2014). The mechanical properties of cytoskeletons and membranes have been studied intensively in different scenarios, via experiments (e.g., Discher et al. (1994); Lenormand et al. (2001); Hale et al. (2011)), simulations (e.g., Saxton (1990); Boal (1994); Hansen et al. (1997); Boey et al. (1998)), and theoretical modelings (e.g., Gov (2007); Broedersz and MacKintosh (2014)). In addition, the membrane of RBCs is also investigated carefully from both biological and physical perspectives, including the functions of transmembrane proteins, and the interactions between protein complexes and the spectrins in the cytoskeletal network (e.g., Byers and Branton (1985); Gov (2007)), etc. As an example to illustrate the relationship between the mechanical properties of the membranes and the behavior of the cells, earlier studies showed that the adhesiveness and hence the mobility of RBCs are strongly affected by the stiffness of the membrane (including the lipid bilayer and the cytoskeleton)Efremov and Cao (2011); Xu et al. (2013). Relating to this paper, recent experiments reveal that the stiffening of RBC after being infected by malaria parasites Chien et al. (1978); Nash et al. (1989); Paulitschke and Nash (1993); Glenister et al. (2002) correlates with the structural transformation in the cytoskeleton of the infected RBCs (iRBCs)Shi et al. (2013). A similar correlation was also observed in iRBCs after chloroquine treatment. In both cases, it is found that, when RBCs were infected by malaria or iRBCs were treated with chloroquine, the shear modulus of the membrane increased with time. Meanwhile, the average length of the spectrins that formed the cytoskeletal network was increased. It is also noticed that the cytoskeleton mesh became more irregular with large holes that were absent in the cytoskeleton of normal RBCs, creating a broad distribution of hole sizes and spectrin lengths. It is known that the adhesiveness of RBCs is one of the reasons that leads to the fatality of malaria infectionHughes et al. (2010). Since the stiffness of RBCs largely affects the adhesiveness of the cells, having a fundamental understanding of the relationship between the network structure and the macroscopic elastic properties will provide us with guidances in potentially discovering new drug targets or treatment methods.
In this study, we focus on rationalizing the correlation between the two experimental observations mentioned above and investigate how the structural changes at the molecular level affect the mechanical properties at the cellular level. We present both numerical solutions and analytical approximations based on a model combining the worm-like chain (WLC) description for single filaments and the Effective Medium Theory (EMT). We use the cytoskeletal network of the RBC, approximated by a 2-dimensional triangular network, to demonstrate any agreement between the model and the experiments. This study not only provides a further understanding of the relationship between structures and functions, but also provides a critical experimental test of the theoretical predictions. In addition, because our model is constructed with a general framework, it is expected that it can also be applied to other scenarios, such as 3-dimensional networks of the cytoskeletons in other types of cells, designing of new bio-materials, etc.
II METHODS
II.1 Experiments
II.1.1 Cell culture and enrichment
The common laboratory P. falciparum 3D7 parasites were used for the study. Parasite iRBCs were cultured in vitro following a conventional protocolTrager and Jensen (1976). Culture stage synchrony was maintained using sorbitol treatment Ribaut et al. (2008) and the early trophozoite stage iRBCs were used for the following experiments.
II.1.2 AFM experiment
Sample preparation:
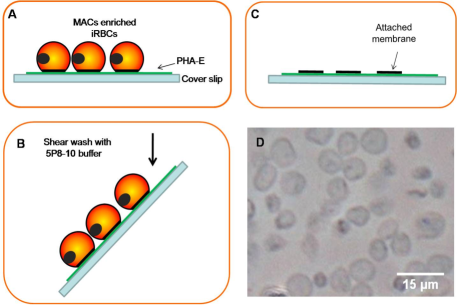
The AFM imaging samples were prepared following similar protocol used previouslyShi et al. (2013). Briefly, synchronized and MACs enriched Ribaut et al. (2008) early trophozoite stage malaria iRBCs after different hours of 1 chloroquine treatment (0hr, 4hr, 8hr, 16hr and 24hr) were loaded on PHA-E coated cover slips and then incubated for 4 hours to allow sufficient contact time for iRBCs to adhere to the substrate and avoid whole cell detachment in the shear-wash step. 80 ml of 5P8-10 buffer was used to shear-wash the iRBCs adhered to PHA-E coated cover slips at an angle of around 20∘ by syringe, leaving only the tightly bounded membranes. The tight binding between membrane and substrate also maximally ensured the structure of the cytoskeleton remained in situ. The cytoplasmic-surface-exposed samples were checked under phase contrast microscope (Olympus X71) and then vacuum dried before imaging using AFM (Fig. S1).
AFM imaging:
AFM imaging was carried on JPK Nanowizard® AFM with tapping mode (air) using SSS-NCHR AFM tip (NANOSENSORSTM) with tip radius of 2 nm, and Dimension FastScanTM Atomic Force Microscope (Bruker) using Fast Scan AFM tip with tip radius of 5 nm. Images were captured at the resolution of 512 x 512 pixels for 10 x 10 or 1 x 1 at scan rate of 0.5 to 1 depending on the scan scale and image quality. Around 10 iRBCs were scanned for each chloroquine treatment condition and a well connected spectrin area was selected to represent the cell for spectrin lengths data collection. 10 to 30 spectrin lengths were collected from each cell and averaged to represent the spectrin length of that cell.
Measurement of the spectrin length:
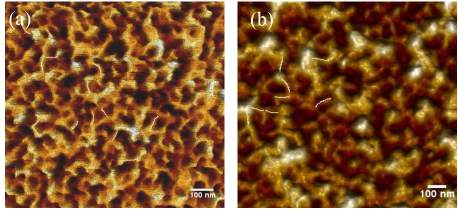
The spectrin length was measured as described previouslyShi et al. (2013). As shown in Fig. S2(a) and (b), white lines that were traced along the spectrins between two junctions were measured as the lengths of the spectrins.
II.1.3 Micropipette experiment
Different durations of chloroquine treated malaria iRBCs were prepared at a ratio of 1: 2000 (cell pellet: 1 BSA solution in PBS). 400-600 of the diluted sample was pipetted into a home-made micropipette aspiration microscope cell holder which was mounted on the Olympus X71 microscope stage using masking tape. Borosilicate glass tubings (Sutter) were pulled using a Sutter 2000 micropipette puller, then forged and cut into micropipette tip with an inner diameter of 1 – 2 using Narishige Microforge. A syringe pump was used to apply a negative suction pressure to aspirate the iRBC into the micropipette. A simple relationship between elongation of cell membrane aspirated into the micropipette and the applied negative pressure is given by Chien et al. (1978):
| (1) |
with , and is the applied negative pressure, is the micropipette inner diameter, is the membrane shear elastic modulus and is the aspirated length of the cell membrane into the micropipette. Series of images were captured using a CCD camera every second. By measuring the aspirated length and the applied negative pressure, the membrane shear modulus was obtained.
II.2 Irregular network of worm-like chains (WLC)
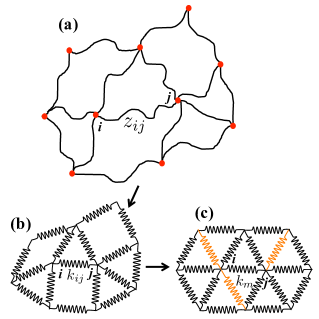
Normal RBC possesses a triangular cytoskeletal network consisting of nodes of protein complexes and edges of spectrins. In our theoretical study of the RBC cytoskeleton, we regard the network formed by equilateral triangles as the regular network. We treat this regular network as our reference state and study how disorders added to the network affect its elasticity.
Recent experiments Shi et al. (2013) found that in malaria infected RBCs (iRBCs) or iRBCs after drug (chloroquine) treatment, two types of disorders are introduced to the RBC cytoskeletal network (Fig. 1). Firstly, the average end-to-end distance of the spectrins increases, which is directly measured in our experiment (Fig. 2 (b)). Secondly, the variance of the end-to-end distance distribution is also much larger than that in the regular triangular network (Fig. 2 (b) and Shi et al. (2013)), probably due to the absence of some spectrin links after infection or drug-treatment. To perform a quantitative investigation of how these two changes affect the stiffness of the RBC network, we introduce the disorders in terms of a Gaussian distribution of the spectrins’ end-to-end lengths in the network, for which the probability density function can be written as:
| (2) |
Here, is the natural length of the spectrins following the WLC description elaborated later, is the average end-to-end length of the spectrins, is the variance of the end-to-end length distribution, and is a normalization constant.
Each node in the network formed by protein complexes defines a point connecting the cytoskeleton and the membrane. In the regular network, each node is linked by spectrins, i.e., an out-degree of . But in reality, some spectrins may lose the connections with the nodes, which introduces a topological disorder to the network. Here we use a parameter to represent the probability with which an edge of spectrin is present in the regular network (then represents the probability with which an edge of spectrin is missing from the regular network). For example, corresponds to the complete network, and corresponds to an average out-degree of . In our model, we generally treat as an independent variable. But it is possible that can be a function of stresses in the network as suggested by previous studies focusing on the binding/unbinding kinetics between ligands and receptors (e.g., Bell (1978)). This case is further discussed in the Discussion section.
For individual spectrins, it is well-known that the elasticity has an entropic origin. Here, we apply the worm-like chain (WLC) model that is used to study semi-flexible polymers (e.g., Marko and Siggia (1995); Yang et al. (2003); Xu et al. (2014)) to single spectrins, which basically gives us a nonlinear force-extension curveMarko and Siggia (1995). Comparing to the end-to-end distance of the spectrins in the network (), the persistence length () of the spectrin is very short. Hence we need not consider the effect of the spectrins’ bending rigidity on the network. For a brief review, in the WLC model, the persistence length describes the length scale, below which the bending energy dominates the thermal excitations. From the WLC model, the single spectrin follows the force-extension relation as shown belowMarko and Siggia (1995):
| (3) |
where is the Boltzmann factor with the Boltzmann constant and is the temperature. is the end-to-end distance of the spectrin and is the natural length of the spectrin that is treated as in-extensible. With and , the root mean square end-to-end distance of a spectrin free of stress is about , comparable to observed values. In general, the spectrins in the RBC cytoskeleton has an average end-to-end distance ranging from about to . With small perturbations to the spectrin from its equilibrium position, we can expand the force-extension relation (eq. (3)) to first order and obtain an effective spring constant for the spectrin, which is a function of the end-to-end distance of the spectrin at equilibrium. Simply, this extension-related spring constant is obtained by taking the derivative of the force with respect to the extension, which gives us
| (4) |
Importantly, we should note here that, even the effective spring constant depends on the end-to-end distance nonlinearly, its effect in our model is simply to setup an initial equilibrium distribution of the spring constants across the entire network according to the distribution of the end-to-end distance of the spectrins. Under this assumption, we focus on the linear response of the disordered network (small perturbations), in which case each spectrin is treated as a Hookean spring with a distinct spring constant and then we apply an Effective Medium Theory (EMT) to evaluate the elasticity of the disordered network.
II.3 Effective medium theory
To understand how the disorders in the RBC cytoskeleton affect its stiffness, we adopt an Effective Medium Theory (EMT) approach here. In previous studies, EMT is used to understand the elastic properties of different types of disordered networks. Examples include but are not limited to central-force spring networks Feng et al. (1985); Thorpe and Garboczi (1990), 2D networks under tension Tang and Thorpe (1988); Boal et al. (1993); Boal (1998), networks at large deformations Sheinman et al. (2012), networks formed by filaments with finite bending rigidities Das et al. (2007); Mao et al. (2013), networks with nonlinear cross-linkers Broedersz et al. (2009), etc. Basically, the EMT maps the disordered network to an equivalent regular network and extract elastic constants from the regular network. To construct the equivalent regular network, the springs in the network with distinct spring constants are replaced by springs with the same spring constant self-consistently. The self-consistency requires that the average extra displacement caused by this replacement procedure must be over the entire network () Feng et al. (1985). It leads to the following equation for the effective spring constant in the regular networkFeng et al. (1985):
| (5) |
where describes the distribution of the spring constants in the network. is related to the topology of and pre-stresses in the network Tang and Thorpe (1988) and can be understood as follows: When two adjacent nodes in the regular network is displaced with respect to each other, the response of the network can be described by an effective spring constant , where takes into account the contribution of the whole network. Eq (5) can be solved analytically for specific probability density functions and numerically for other forms of .
III RESULTS
III.1 Experimental measurements
In the cytoskeleton of normal RBCs, the average end-to-end distance of the spectrins, i.e., the average distance between nodes, is about . Here we summarize our experimental measurements using Atomic Force Microscopy (AFM) and micropipette aspiration techniques. The measurements show correlation between the stiffening of the iRBC after chloroquine treatment as well as elongation of spectrins which motivate our theoretical model.
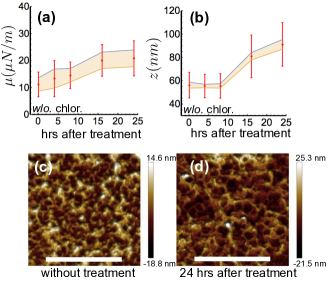
The shear modulus of the iRBC is measured by micropipette aspirationEvans (1973); Hochmuth (2000). Fig. 2(a) shows that the shear modulus of iRBC increases by about a factor of after hours of chloroquine treatment. The cytoskeleton structure is measured using AFM with a similar method as that in Shi et al. (2013). From the AFM images, we measured the end-to-end distances of spectrins in the cytoskeleton network (Fig. 2 (b) and Fig. S3). The result shows an overall increase of the end-to-end distances after chloroquine treatment. The typical AFM images are shown in Fig. 2(c) and (d). The larger dark spots in Fig. 2 (d) indicate larger holes in the cytoskeletal network, consistent with our measurement of the end-to-end distances of spectrins.
III.2 Numerical calculation
For a general probability density function , Eq. 5 can be solved numerically. Here we consider the variation of the lengths of spectrins in the network, as well as the probability of missing spectrins between nodes. Because the effective spring constant of the spectrin depends on the end-to-end distance, the length distribution introduced by Eq. 2 induces the probability distribution of elastic constants for spectrins. Combined with the probability of missing a spectrin connection (), the probability density function of the spring constants in the cytoskeletal network can be written as
| (6) |
where is the distribution of the end-to-end distance and normalized for , i.e., , and is the Dirac Delta function. In the first term on the right-hand-side, gives the distribution of the spring constant . Using the probability density function (eq. 6) the EMT equation (Eq. 5) is re-written as
| (7) |
As discussed earlier, the value of depends on the geometry of and the pre-stresses in the network. Here we take the value for stress-free triangular network Feng et al. (1985) and solve numerically. Tang Tang and Thorpe (1988) shows the relation between and pre-strain in the network. We found that changing the value of (from to ) changes the value of but does not change the qualitative dependence of on , , and as shown in Fig. 3. Once we obtain the effective spring constant for the equivalent regular network, the in-plane shear modulus , to the lowest order, is linearly proportional to . Hence, to study how depends on the disorders, it is equivalent to find out the dependence of on the connection formation probability , the average end-to-end distance , and the variance of .
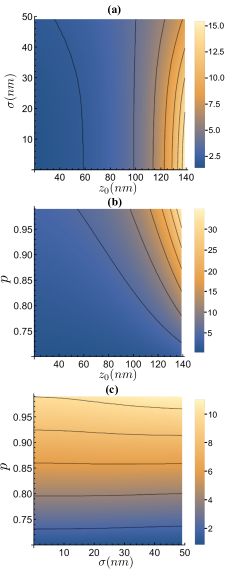
Our numerical results are summarized in Fig. 3. With fixed value of (Fig. 3(a)), the effective spring constant increases with for relatively small values of , but decreases with for relatively large values of (). On the other hand, always increases with increasing given the value of . This supports the prediction that the experimentally observed cell stiffening is related to the observed lengthening of spectrins in the cytoskeleton network. With fixed value of (Fig. 3(b)), as one may expect, increases with increasing given the value of , and also increases with increasing given the value of . With fixed value of (Fig. 3(c)), increases with increasing given the value of . But similar as shown in Fig. 3(a), increases with increasing for relatively high values of () while it decreases with increasing for relatively low values of . Therefore, our numerical results suggest that, given the value of (e.g., Fig. 3(a)), for relatively “strong” network (large values of ), increasing the variance of tends to weaken the network, while for relatively “weak” network (small value of ), increasing the variance tends to stiffen the network. However, given a relatively medium value of (e.g., in Fig. 3(c)), increasing stiffens relatively “strong” network, but weakens relatively “weak” network. This nontrivial dependence of on may be utilized in cellular functions or material designs.
III.3 Analytical solutions
Here we adopt analytical solutions from previous studies (e.g., Feng et al. (1985); Mao et al. (2013)) but replace the harmonic springs with worm-like chains. To make the model traceable, we only consider the deviation from the regular triangular network caused by missing spectrin connections and neglect the length heterogeneity. Aiming at the dependence of shear modulus on the average spectrin length, here we will establish a correlation between the experimentally observed spectrin lengthening and cell stiffening phenomena. In this case, the distribution function takes the following form Feng et al. (1985); Sheinman et al. (2012)
Different from purely linear springs, stretching spectrins not only introduces internal pre-stresses to the network, but also increases the effective spring constants of individual spectrins. If we use the average extension to replace the inhomogeneous end-to-end distance , Eq. 5 can be solved exactly Feng et al. (1985). Again, the length-dependent spring constant only sets up the initial value of . After that, we treat all the spectrins as Hookean springs and as independent of , and only consider the linear response of the network for small perturbations. With this consideration, Eq. 5 is solved to give us:
| (8) |
Here we consider as a constant independent of initial stresses. The case of a stress-dependent will be discussed in the Discussion section. Thus, we map the disordered network to a regular triangular network consisting of springs with a single spring constant . It is clear that, in our model, cell stiffening comes directly from the nonlinearity of the WLC model, as shown by the -dependent term on the right hand side of Eq. 8. The macroscopic in-plane shear modulus of the 2D network is linearly proportional to the effective spring constant, i.e., .
On the other hand, it is known that pre-stresses can stiffen the network (e.g., Tang and Thorpe (1988); Boal (1998); Sheinman et al. (2012)), a similar effect as discussed in subsection Numerical calculation. In a cellular environment, the pre-stresses can be caused by various processes, e.g., the expression and export of transmembrane proteins onto the iRBC membrane that bind to spectrins, the formation of “knobs” at dispersed sites on the RBC membrane that can link to near-by spectrins, the expansion of the cell’s volume due to the invaded and multiplying malarial parasites and so on. In our model, without knowing more details about these intracellular processes, we use a single stress-dependent pre-factor to account for the influence of the pre-stresses on the elastic properties of the cytoskeletal network. With that in mind, the shear modulus of the 2D network is given by
| (9) |
where is the pre-stress in the network, defined to be negative for networks under tension.
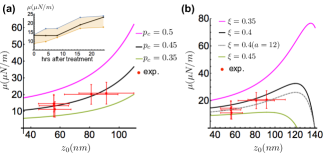
Fig. 4(a) shows our analytical results for different values of . We focus on the dependence of the shear modulus on the average end-to-end distance and we use that is approximated from our AFM measurements. Qualitatively, it is clear that the shear modulus of the network increases with increasing average end-to-end length of the spectrins in the network. By adjusting the value of and , our results agree with experiments (red dots with error bars in Fig. 4(a)) well. The comparison with experiments is elaborated below.
III.4 Comparison with experiments
Eq. 9 is used to compare with experiments. By using micropipette aspiration techniques, we found that the malaria iRBCs become stiffer after chloroquine treatment (Fig. 2 (a)). In the meantime, through AFM measurements, we found that the average end-to-end distance of spectrins in the cytoskeleton increases after the drug treatment (Fig. 2 (b)). This coincidence is also noticed in iRBCs at different stages of malaria infection Chien et al. (1978); Nash et al. (1989); Paulitschke and Nash (1993); Glenister et al. (2002); Shi et al. (2013). In our experiments, both the shear modulus and the spectrin lengths were measured (Fig. 4(a)), and the data showed a positive correlation between these two quantities. In the meantime, the average connectivity is also obtained, which is around across several samples. So we use this number to determine the value of in our model. For other parameters, we use , and , which agree with the values reported in the experiments or literatures (Stokke et al. (1985); Svoboda et al. (1992); Li et al. (2005)). and are used as fitting parameters. Using the values and , our results (Eq. 9) agree well with the experimental observations (Fig. 4(a) and the inset). For the black curve in the inset, the mean values of the lengths of spectrins at different times are used in Eq. 9 to obtain the values of respectively. Due to the relatively large error bars in the experiments, the values of and can vary in a certain range. Better estimations of the parameter values are worthy of further investigations and more precise experimental measurements in our future work. However, the agreement supports the prediction that the shear modulus of the network is largely affected by the average length of edges (e.g., spectrins) in the cytoskeletal network.
IV DISCUSSION
Several questions deserve further discussions here. Firstly, the binding/unbinding kinetics between spectrins and the nodes (protein complexes) can be force-dependent. Here we simply assume an exponential dependence of the edge missing probability on the force, i.e., , where depends on the end-to-end distances of the spectrins as in Eq. 3. By plugging in in Eq. 9, we obtain:
| (10) |
where is a parameter describing the length scale between the binding potential minimum and maximum. In Eq. 10, is approximated as the average end-to-end distance . Two competing effects are immediately noticed from Eq. 10. The term coming from the WLC model predicts cell stiffening due to lengthening of spectrins, while the other term weakens the network. For relatively short spectrin lengths, the cell stiffens due to the stiffenings of spectrins as their lengths are increased. However, at large spectrin lengths that may be beyond the measurements of current experiments, the weakening term dictates the elastic properties of the network and the bond forming probability may even drop below the rigidity percolation threshold . Thus a turning point should be observed if the length of the spectrins keep increasing, dividing the two different dependences of shear modulus on . Fig. 4(b) confirms this prediction, and shows the dependence of the shear modulus on the average end-to-end distance of the spectrins for different values of . In Fig. 4(b), we use that is in the range of values for similar problemsEfremov and Cao (2011) and . Other parameters take the same values as those for Fig. 4(a). The curves in Fig. 4(b) are slightly shifted from those in Fig. 4(a) due to the differences between Eq. 9 and Eq. 10. The agreement with experiments (red dots with error bars) can be retained by only slightly changing the value of ( for the gray dashed curve in Fig. 4(b)) with other parameters stay the same. Having that said, here we are more interested in the qualitative non-monotonic dependence of on , while the exact shape of the curve needs to be further determined by parameters from future experimental investigations.
Secondly, it is noticed that pre-stress can significantly alter the geometry or topology of the network through stretching of spectrins. The effects of pre-stresses in cells and cytoskeletons have been studied extensively previously regarding the stability of the triangular cytoskeletal network and the origin of the stresses are worthy of further studies. One scenario is the stress generated in the cytoskeleton of malaria infected RBCs. It is known that after the malaria infection, “knobs” are expressed across the membrane, which are complexes of malarial parasite exported proteins. These knobs are found capable of binding to spectrins and can possibly introduce stresses in the cytoskeletal networkShi et al. (2013). A different scenario is the iRBCs after chloroquine treatment. In this case, the oxidative stress resulted from the drug treatment may be responsible for the change of mechanical properties of the cytoskeleton Hale et al. (2011). We suspect that this oxidative stress may be related to the formation of new protein complexes that binds to spectrins, and subsequently generate stresses in the network. In this case, the effect of chloroquine treatment is partially impaired by the continuous stiffening of the cells, because stiffer cells are sometimes easier to block the blood circulation. Further experimental investigations of the origin of the stresses are our main focus in the future and will improve our understanding of the mechanism of fatal diseases and drug treatments.
From a broader perspective, although here we looked at the 2-dimensional network, especially the RBC cytoskeleton as an example, our model in general bridges the properties of biopolymers at the molecular level and the elastic properties at the cellular level. Similar models may be extended to other dimensions and shapes. Our results also show a possible mechanism for cells to adjust their stiffness from the molecular level and may stimulate new ideas in material designs.
V CONCLUSION
To conclude, we investigated the relationship between the network structure and its stiffness. We focused on how the disorders introduced to a regular 2D triangular network affect its macroscopic in-plane shear modulus. By applying the worm-like chain model to single spectrins that form the edges of the network, we found that the shear modulus of the network increases with the average length of the spectrins. Our result agrees with previous studies in that removing some edges with probability weakens the network, which shows a competing effect with the stiffening caused by lengthening of spectrins (worm-like chains). On the other hand, as discussed in the results section, depending on the values of the average length or , the shear modulus may increase or decrease with increasing variance () of the length distribution (Fig. 3(a)(c)). Furthermore, if the stress-dependent binding/unbinding kinetics is taken into account, the shear modulus has a first-increase-then-decrease behavior as the average length of the spectrins increases. More importantly, our results agree well with recent experimental observations for malaria infected red blood cells (iRBCs), which shows a correlation between the lengthening of spectrins (edges of the cytoskeleton network) and stiffening of the cells (increase of shear modulus). Further investigations of what causes the lengthening of spectrins or the internal stresses in the cytoskeleton will be valuable in identifying new treatment methods or targeted therapy for RBC-related diseases, such as malaria infection.
AUTHOR CONTRIBUTIONS
LL, XX, CTL, and JC designed the research. LL and XX performed the research. LL, CTL, and JC wrote the paper.
ACKNOWLEDGMENTS
We acknowledge the financial assistance of Singapore-MIT Alliance for Research and Technology (SMART) and National Science Foundation (NSF) (CHE–1112825).
References
- Discher et al. (1994) D. Discher, N. Mohandas, and E. Evans, Science 266, 1032 (1994).
- Suresh (2006) S. Suresh, Journal of Materials Research 21, 1871 (2006).
- Broedersz and MacKintosh (2014) C. P. Broedersz and F. C. MacKintosh, Rev. Mod. Phys. 86, 995 (2014).
- Xu et al. (2012) K. Xu, G. Zhong, and X. Zhuang, Science 339, 452 (2012).
- Lai and Cao (2014) L. Lai and J. Cao, The Journal of Chemical Physics 141, 015101 (2014).
- (6) J. H. Kim and J. Cao, in preparation .
- Huang et al. (2014) S. Huang, A. Amaladoss, M. Liu, H. Chen, R. Zhang, P. R. Preiser, M. Dao, and J. Han, Infection and Immunity 82, 2532 (2014).
- Lenormand et al. (2001) G. Lenormand, S. Hénon, A. Richert, J. Siméon, and F. Gallet, Biophys J. 81(1), 43 (2001).
- Hale et al. (2011) J. P. Hale, C. P. Winlove, and P. G. Petrov, Biophys J. 101, 1921 (2011).
- Saxton (1990) M. J. Saxton, Biophys J. 57, 1167 (1990).
- Boal (1994) D. H. Boal, Biophys J. 67, 521 (1994).
- Hansen et al. (1997) J. C. Hansen, R. Skalak, S. Chien, and A. Hoger, Biophys J. 72(5), 2369 (1997).
- Boey et al. (1998) S. K. Boey, D. H. Boal, and D. E. Discher, Biophys J. 75, 1573 (1998).
- Gov (2007) N. S. Gov, New Journal of Physics 9, 429 (2007).
- Byers and Branton (1985) T. J. Byers and D. Branton, Proceedings of the National Academy of Sciences 82, 6153 (1985).
- Efremov and Cao (2011) A. Efremov and J. Cao, Biophys J. 101, 1032 (2011).
- Xu et al. (2013) X. Xu, A. K. Efremov, A. Li, L. Lai, M. Dao, C. T. Lim, and J. Cao, PLoS ONE 8, e64763 (2013).
- Chien et al. (1978) S. Chien, K.-L. P. Sung, R. Skalak, and U. Shunichi, Biophys. J. 24, 463 (1978).
- Nash et al. (1989) G. Nash, E. O’Brien, E. Gordon-Smith, and J. Dormandy, Blood 74(2), 855 (1989).
- Paulitschke and Nash (1993) M. Paulitschke and G. B. Nash, J Lab Clin Med. 122, 581 (1993).
- Glenister et al. (2002) F. K. Glenister, R. L. Coppel, A. F. Cowman, N. Mohandas, and B. M. Cooke, Blood 99, 1060 (2002).
- Shi et al. (2013) H. Shi, Z. Liu, A. Li, J. Yin, A. G. L. Chong, K. S. W. Tan, Y. Zhang, and C. T. Lim, PLoS ONE 8, e61170 (2013).
- Hughes et al. (2010) K. R. Hughes, G. A. Biagini, and A. G. Craig, Molecular & Biochemical Parasitology 169, 71 (2010).
- Trager and Jensen (1976) W. Trager and J. Jensen, Science 193, 673 (1976).
- Ribaut et al. (2008) C. Ribaut, A. Berry, S. Chevalley, K. Reybier, I. Morlais, D. Parzy, F. Nepveu, F. Benoit-Vical, and A. Valentin, Malaria Journal 7, 45 (2008).
- Bell (1978) G. Bell, Science 200, 618 (1978).
- Marko and Siggia (1995) J. F. Marko and E. D. Siggia, Macromolecules 28, 8759 (1995).
- Yang et al. (2003) S. Yang, J. B. Witkoskie, and J. Cao, Chemical Physics Letters 377, 399 (2003).
- Xu et al. (2014) X. Xu, B. J. R. Thio, and J. Cao, The Journal of Physical Chemistry Letters 5, 2868 (2014).
- Feng et al. (1985) S. Feng, M. Thorpe, and E. Garboczi, Phys. Rev. B 31, 276 (1985).
- Thorpe and Garboczi (1990) M. Thorpe and E. Garboczi, Phys. Rev. B 42, 8405 (1990).
- Tang and Thorpe (1988) W. Tang and M. Thorpe, Phys. Rev. B 37, 5539 (1988).
- Boal et al. (1993) D. Boal, U. Seifert, and J. Shillcock, Phys. Rev. E 48, 4274 (1993).
- Boal (1998) D. H. Boal, Biol. Bull. 194, 331 (1998).
- Sheinman et al. (2012) M. Sheinman, C. Broedersz, and F. MacKintosh, Phys. Rev. E 85, 021801 (2012).
- Das et al. (2007) M. Das, F. MacKintosh, and A. Levine, Phys. Rev. Lett. 99, 038101 (2007).
- Mao et al. (2013) X. Mao, O. Stenull, and T. Lubensky, Phys. Rev. E 87, 042601 (2013).
- Broedersz et al. (2009) C. Broedersz, C. Storm, and F. MacKintosh, Phys. Rev. E 79, 061914 (2009).
- Evans (1973) E. Evans, Biophysical Journal 13, 941 (1973).
- Hochmuth (2000) R. M. Hochmuth, Journal of Biomechanics 33, 15 (2000).
- Stokke et al. (1985) B. T. Stokke, A. Mikkelsen, and A. Elgsaeter, Biochimica et Biophysica Acta 816, 102 (1985).
- Svoboda et al. (1992) K. Svoboda, C. F. Schmidt, D. Branton, and S. M. Block, Biophys. J. 63, 784 (1992).
- Li et al. (2005) J. Li, M. Dao, C. T. Lim, and S. Suresh, Biophys. J. 88, 3707 (2005).
SUPPORTING FIGURES