Star-Jet Interactions and Gamma-Ray Outbursts from 3c454.3
Abstract
We propose a model to explain the ultra-bright GeV gamma-ray flares observed from the blazar 3C454.3. The model is based on the concept of a relativistic jet interacting with compact gas condensations produced when a star (red giant) crosses the jet close to the central black hole. The study includes an analytical treatment of the evolution of the envelop lost by the star within the jet, and calculations of the related high-energy radiation kbbad13 . The model readily explains the day-long, variable on timescales of hours, GeV gamma-ray flare from 3C454.3, observed during November 2010 on top of a weeks-long plateau. In the proposed scenario, the plateau state is caused by a strong wind generated by the heating of the star atmosphere by nonthermal particles accelerated at the jet-star interaction region. The flare itself could be produced by a few clouds of matter lost by the red giant after the initial impact of the jet. In the framework of the proposed scenario, the observations constrain the key model parameters of the source, including the mass of the central black hole: , the total jet power: , and the Doppler factor of the gamma-ray emitting clouds, . Whereas we do not specify the particle acceleration mechanisms, the potential gamma-ray production processes are discussed and compared in the context of the proposed model. We argue that synchrotron radiation of protons has certain advantages compared to other radiation channels of directly accelerated electrons.
I INTRODUCTION
3C454.3 is a powerful flat-spectrum radio quasar located at a redshift . This source is very bright in the GeV energy range; during strong flares, its apparent (isotropic) luminosity can reach erg s-1 (e.g. agile10, ; fermi10, ; agile11, ; fermi11_3C, ). The mass of the central black hole (BH) in 3C454.3 is estimated in the range gcj01 ; bgf11 . This implies an Eddington luminosity , which is several orders of magnitude below . Although the large gap within and is naturally explained by relativistic Doppler boosting, the estimates of the jet power during these flares appear, in any realistic scenario, close to or even larger than the Eddington luminosity bgf11 .
The GeV emission from 3C454.3 is highly erratic, with variability timescales as short as 3 hr, as reported, in particular, for the December 2009 flare fermi10 . The most spectacular flare regarding both variability and gamma-ray luminosity was observed in November 2010 by AGILEand Fermi/LATagile11 ; fermi11_3C telescopes. During this high state, with the most active phase lasting for 5 days, the apparent luminosity in GeV achieved . Around the flare maximum, the rising time was hr, and the decay time, hr. The detection of photons with energies up to GeV, the short variability, and the contemporaneous X-ray flux constrain the Doppler boosting of the emitter to to avoid severe internal absorption in the X-ray radiation field fermi11_3C .
A remarkable feature of the gamma-ray emission from 3C454.3 is the so-called plateau phase revealed during the bright flare in 2010. It is characterized by a long-term brightening of the source, a few weeks before the appearance of the main flare. Such plateau states have been observed by Fermi/LATfor three flares (e.g. fermi10, ; fermi11_3C, ), with the plateau emission being about an order of magnitude fainter than that of the main flare.
Remarkably, the rapid gamma-ray variability of 3C454.3 is accompanied by an activity at lower energies. The simultaneous multiwavelength observations of the source during flares have revealed a strong correlation with optical and X-rays. It has been interpreted as evidence that the gamma-ray source is located upstream from the core of the 43 GHz radio source, which is at a distance few pc from the central BH (see, e.g., jml10, ; jor12, ; wmj12, ).
Over the recent years, several works have attempted to explain the flaring gamma-ray activity of 3C454.3 within the framework of the standard synchrotron self-Compton (SSC) or external inverse-Compton (EIC) models kg07 ; gft07 ; smm08 ; bgf11 . In the SSC scenario, it is possible to reproduce the spectral energy distribution (SED) from optical wavelengths to gamma-rays. In these models most of the jet power is (unavoidably) carried by protons, and only a small fraction is contained in relativistic electrons and the magnetic field. The required proton-to-Poynting flux ratio of is quite large. Such a configuration would be hard to reconcile, at least in the gamma-ray emitting region close to the central BH, with an undisturbed jet which is launched by the Blandford-Znajek BZ77 type (BZ) process, in which the luminosity of the jet is dominated by Poynting flux and the jet consists of -pairs. In this regard we should mention that recent relativistic magnetohydrodynamical (MHD) simulations of jet acceleration yield much less efficiency of conversion of the magnetic energy into bulk motion kinetic energy; these calculations kbvk07 ; kvkb09 predict a quite modest ratio .
The jet-RG interaction (JRGI) scenario has been invoked to explain the day-scale flares in the nearby non-blazar type AGN M87 bab10 ; bpb12 , It has been applied also to the TeV blazar PKS 2155304 babkk10 to demonstrate that the jet-driven acceleration of debris from the RG atmosphere can explain ultra-fast variability of very high-energy gamma-ray emission on timescales as short as s. A distinct feature of the JRGI scenario is the high magnetization () of the relativistic flows located at sub-parsec distances, where the gamma-ray production supposedly takes place. Although the strong magnetic field, G, dramatically reduces the efficiency of the inverse Compton scattering of electrons, it opens an alternative channel of gamma-ray production through synchrotron radiation of protons ah00 ; mp01 . The latter can be effectively realized only in the case of acceleration of protons to the highest possible energies, up to eV. Thus the second (somewhat “hidden”) requirement of this model is a very effective acceleration of protons with a rate close to the theoretical limit dictated by the classical electrodynamics a02 .
It is interesting to note that also inverse Compton models can be accommodated, at least in principle, in the JRGI scenario. Moreover, unlike most of the leptonic models of powerful blazars, in which the requirement of a very low magnetic field, implying a deviation from the equipartition condition by orders of magnitude, generally is not addressed and explained, the JRGI scenario can offer a natural way for leptonic models to be effective assuming that the gamma-ray emission is produced through the inverse Compton scattering in shocked clouds originally weakly magnetized (see bba12, ).
In this work, we show that the JRGI scenario gives a viable mechanism for the explanation of the flares seen in 3C454.3. We also argue that within this model the plateau state can form due to the interaction of the jet with a stellar wind excited by nonthermal (accelerated) particles that penetrate into the red giant atmosphere.
II Star-Jet interaction Scenario
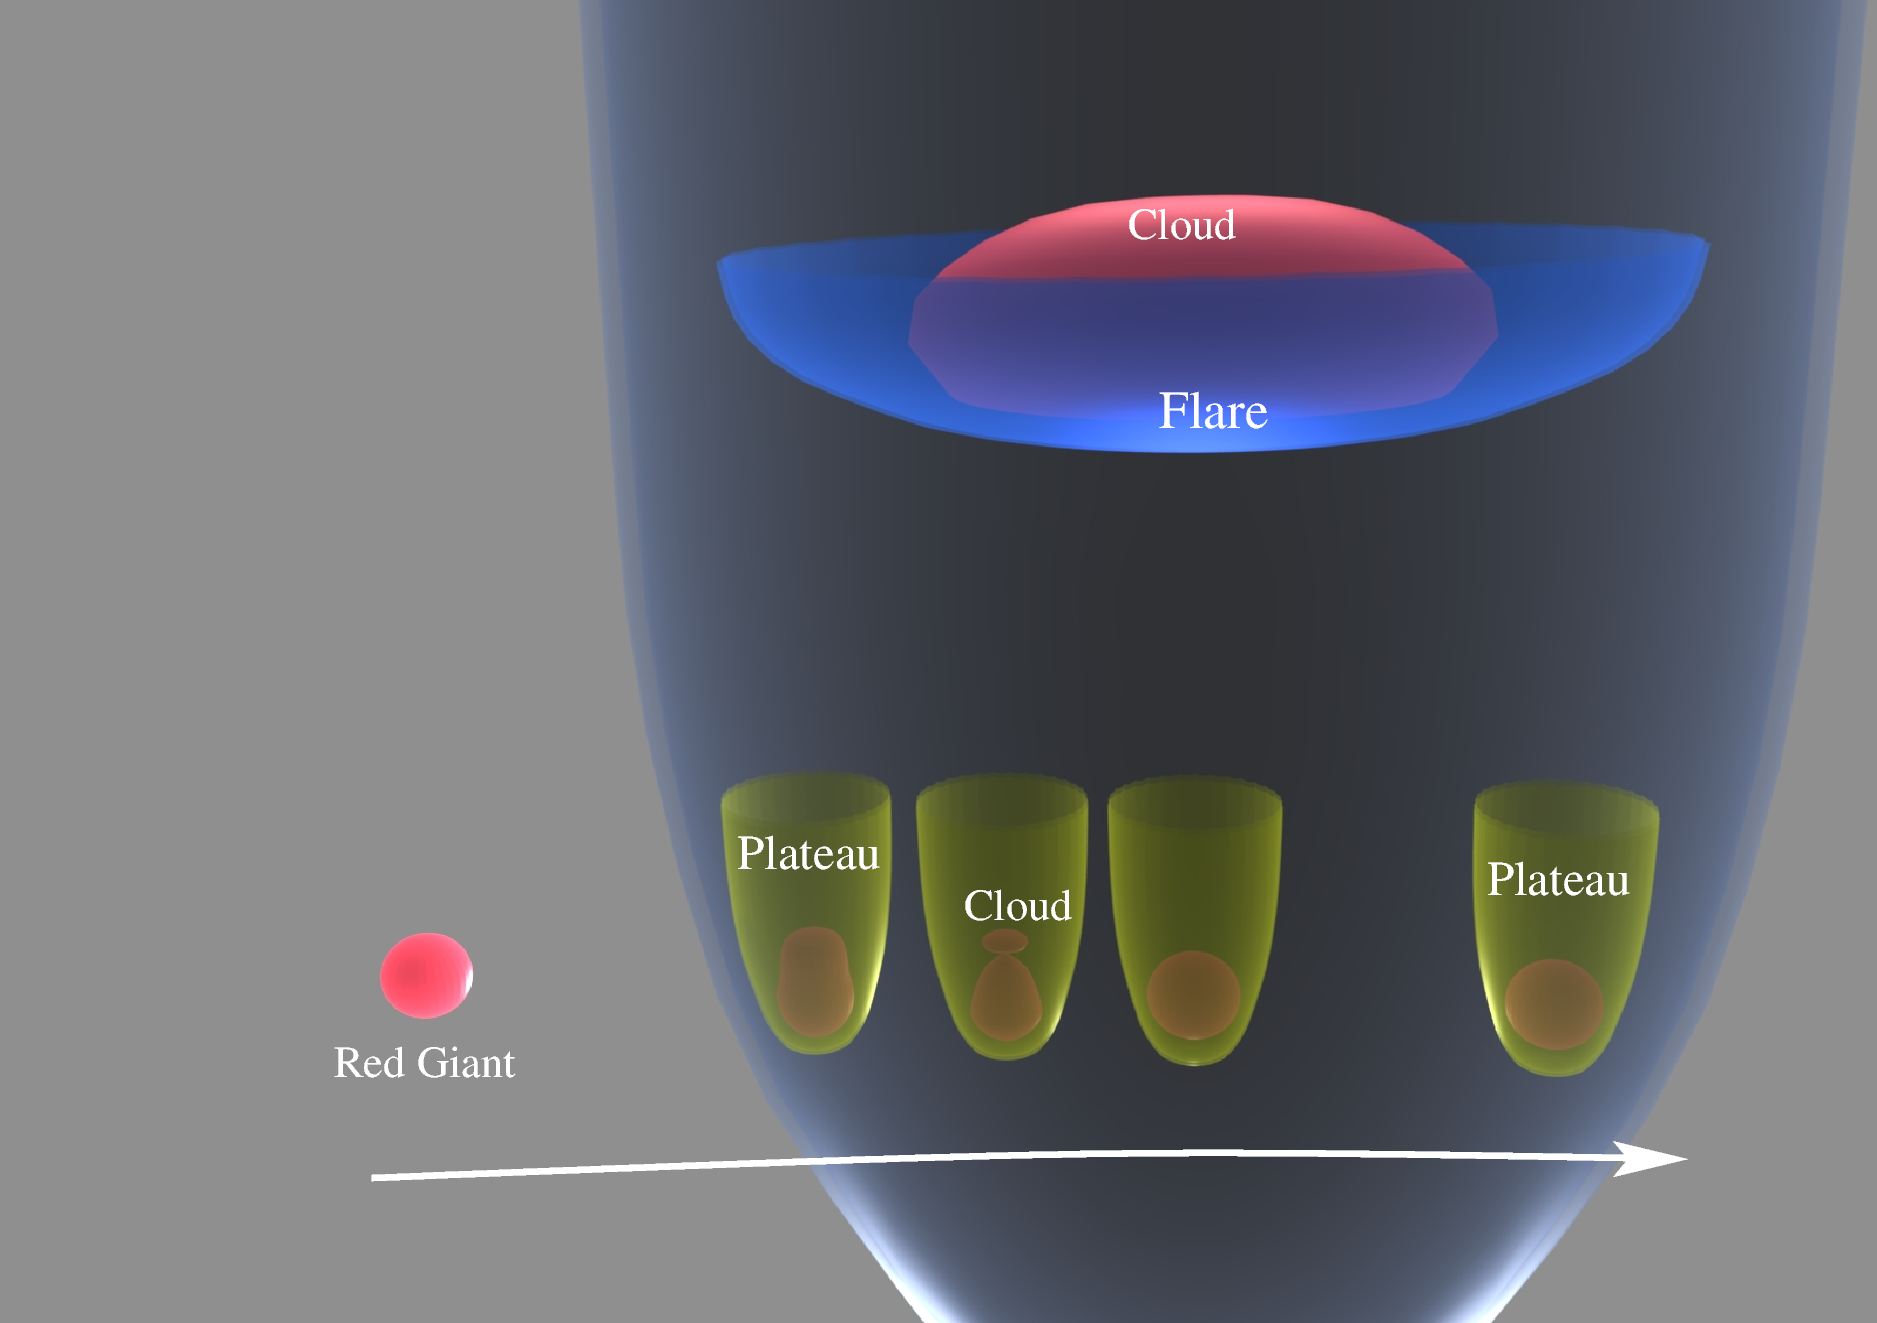
In the fast cooling regime, the proper intensity of the nonthermal emission, i.e. the intensity in the blob co-moving reference frame, is proportional to the energy released at the jet-blob interface. This energy release can be characterized by a simple dynamical model, which describes the acceleration of the blob by the jet ram pressure. In this model there are just a few relevant parameters that describe the basic properties of the jet and the blob: the jet ram pressure () and bulk Lorentz factor (), and the blob mass () and radius (; or, equivalently, its cross-section: ) (for details, see babkk10, ). The time dependence of the intensity of the jet/blob interaction corrected for the Doppler boosting can be treated as a first-order approximation for the radiation lightcurve.
The mass of the cloud formed at the initial stage can be estimated by comparing the jet ram pressure,
| (1) |
with the gravitational force. Here, is the jet cross-section at the star crossing height. This gives the following estimate:
| (2) |
where and are the RG mass and radius, respectively.
Since the initial size of the expelled cloud should be comparable to the size of the star, it is possible to estimate the cloud expansion time as , where is the sound speed of the shocked material: . The cloud expansion time is
| (3) |
where is the plasma adiabatic coefficient, and according to the RHD simulation by bpb12 , a value of can be adopted for .
The blob acceleration occurs on a timescale of babkk10
| (4) |
The –parameter that will be often used in the paper has a simple meaning. It is a dimensionless inverse mass of the blob:
| (5) |
The above timescale corresponds to the blob acceleration in the laboratory reference frame. However, since the blob gets accelerated towards the observer, the emission delay, as seen by the observer, should be approximately corrected by a factor of . Thus, the observed peak of the emission should be delayed by a time interval of
| (6) |
The emission produced by lighter clouds allows an estimation of the time required for the star to cross the jet. Once the star enters into the jet, the process of jet-star interaction should proceed steadily, with the production of these lighter clouds being roughly constant on average. Thus, the whole duration of the light cloud-associated emission, if observed, can be taken as a direct measurement of the jet crossing time , where is the star velocity. Adopting the paradigm of magnetically-accelerated jets, it is possible to derive a very simple expression for this timescale:
| (7) |
In this way, the duration of the jet-star interaction is determined by the interaction distance from the central BH.
Assuming a fixed efficiency in the blob reference frame for the transfer of jet power to nonthermal gamma rays (where ), and correcting for Doppler boosting, one can estimate the luminosity of a blob:
| (8) |
where the correction function depends on time; or, equivalently, on the blob location in the jet. We note that the structure of the jet, i.e., the dependence of the jet Lorentz factor on , determines the actual dependence of on .
The maximum value of monotonically depends on the parameter, approaching a value of if and being for . This relatively weak dependence allows us to derive the maximum blob luminosity. Also it is possible to obtain an estimate of the total energy emitted by a blob or an ensemble of sub-blobs as a result of the fragmentation of the original cloud (),
| (9) |
which accounts for the total energy transferred by the jet to a blob during the acceleration process, , and for the anisotropy of the emission due to relativistic effects represented by the factor .
III The November 2010 Flare
III.1 General structure of the active phase
The total apparent energy of the GeV gamma-ray radiation detected during the flare observed from 3C454.3 in November 2010 was about . The exceptionally high flux during this period allows the derivation of a very detailed lightcurve, as seen from Figure 1 in fermi11_3C . The nonthermal activity lasted for days. The onset of the activity period was characterized by a plateau stage. During the first days, a rather steady flux was detected, with an apparent luminosity erg s-1. The plateau stage was followed by an exceptionally bright flare, the total duration which was days, with a rise time of h. The maximum flux reached was , which corresponds to a luminosity of . The final stage of the flare phase was characterized by variable emission with a flux approximately a factor of weaker than the main flare, but still a factor of above the plateau level.
The observed luminosity of the plateau phase allow us to determine a lower limit on the star mass-loss rate, which can be derived by differentiating equation (9):
| (10) |
where .
To evaluate the feasibility of the JRGI scenario for the 3C454.3 main flare, it is necessary to check whether the flux, the total energy release, and the flare delay with respect to the onset of the plateau, are well described by equations 6, 8, and 9 for a reasonable choice of jet/star properties.
A total energy budget of the flare of is feasible, according to equation (9), if
| (11) |
where g is the mass of the blown up RG envelop (i.e. the initially formed cloud). This requirement appears to be very close to the one provided by equation 2:
| (12) |
where and , respectively.
The second term in equation 6 is expected to be short compared to the duration of the plateau phase, even for , and thus the duration of the initial plateau phase constrains the expansion time (see equation (3)):
| (13) |
fermi11_3C found that the emission of the main flare consisted of 5 components (see Figure 2 in that work): a nearly steady contribution, like a smooth continuation of the plateau emission, and 4 sub-flares of similar duration and energetics. In the framework of the JRGI scenario, such a description is very natural. The steady component would be attributed to light clouds, continuously ejected by the star, and the four sub-flares would correspond to much heavier blobs formed out of the blown-up stellar envelop during the initial stage. On the other hand, the decomposition of the main flare in four sub-flares implies a strict limitation on the variability timescale. The flare rise/decay timescales should be longer than the blob light crossing time corrected for the Doppler boosting. Since the shortest variability scale was s, the maximum possible size of the emitting blobs can be estimated as:
| (14) |
If the jet is magnetically driven, this size constraint can be expressed through the mass of the central BH:
| (15) |
which is restrictive only in the case of . For , the blobs can cover the entire jet without violating the causality constraint.
In summary, if the flare detected with Fermi/LATwas produced by an RG entering into the jet, the jet properties should satisfy to the restrictions imposed by the flux level, total energy release, and the duration of the plateau stage, respectively. Interestingly, this set of equations allows the derivation of a unique solution, which can constrain all the key parameters through the value of the parameter:
| (16) |
| (17) |
| (18) |
and
| (19) |
The lower limit on the jet luminosity is
| (20) |
which exceeds the Eddington limit for the mass of the central BH . To assess the feasibility of such a strongly super-Eddington jet remains out of the scope of this paper, although we note that lp12 have presented observational evidence indicating that such jets may not be uncommon.
The coherent picture emanating from the jet properties derived above suggests that the JRGI scenario can be responsible for the flare detected from 3C454.3 for a solution of the problem with a reasonable set of model parameters. This solution is designed to satisfy the requirements for (i) the total energy; (ii) the peak luminosity; and (iii) the duration of the plateau phase. Therefore, some additional observational tests are required to prove the feasibility of the suggested scenario.
Finally, the flare raise time, which is related to the blob acceleration timescale (see equation 4), can be calculated for the obtained solution. Interestingly, in the limit of small -values, this timescale appears to be independent on , the only remaining free parameter, and matches closely the detected raise time of :
| (21) |
This agreement can be treated as a cross-check that shows the feasibility of the proposed scenario.
IV Modeling the Lightcurve and the Spectrum
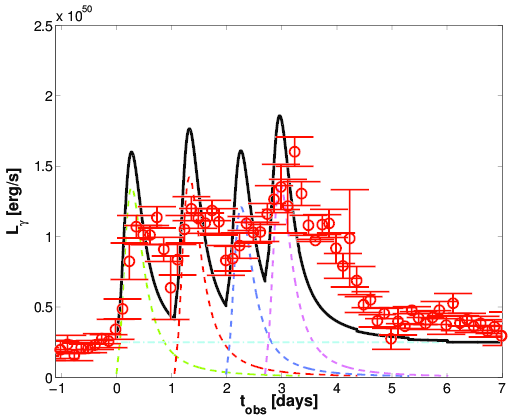
To check whether JRGI plus synchrotron radiation can explain the observations in the case of magnetically dominated jets (i.e., ), we have computed the lightcurve of the November 2010 flare and the SED for one of its subflares. The radiation output was assumed to be dominated by proton synchrotron, being external or synchrotron self-Compton neglected due to the strong magnetic field.
To derive the lightcurve, equation 8 has been used. In Figure 2, a computed lightcurve that approximately mimics the November 2010 flare is presented. The lightcurve has been obtained assuming four subflares of total (apparent) energy of erg each, plus a plateau component with luminosity of erg s-1. For each subflare, we have adopted . The normalization of the lightcurve has been determined adopting the following values: the Lorentz factor , the ram pressure erg cm-3, blob radius cm and . These parameters imply a minimum jet luminosity of erg s-1. The remaining parameters for the emitter are cm and g. The corresponding mass of the matter lost by the RG to explain the four subflares is g, not far from the upper-limit given in equation 2.
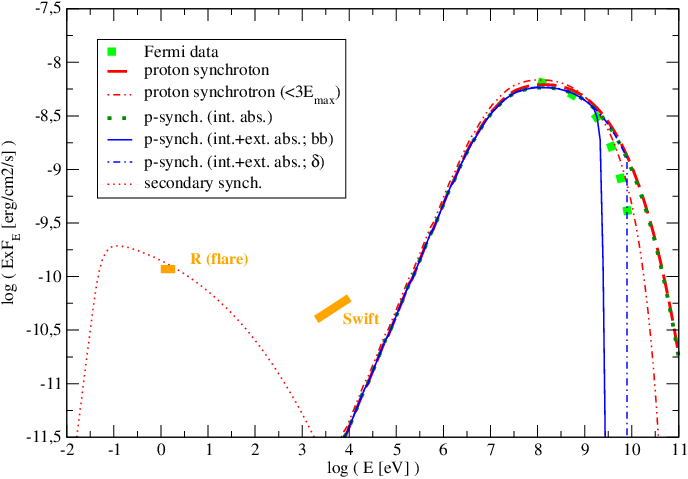
To calculate the SED, we have adopted a spectrum for the injected protons , and an homogeneous (one-zone) emitter moving towards the observer with Lorentz factor . The minimum proton Lorentz factor has been taken equal to the shock Lorentz factor in the blob frame, i.e. . The cutoff energy, , has been obtained fixing , i.e., a relatively modest acceleration efficiency. For the maximum proton energy, i.e. how far beyond the cutoff the proton energy is considered, we adopted two values: and . Regarding the latter case, we note that assuming a sharp high-energy cut is very natural. The injection spectrum was selected to be hard, , to optimize the required energetics.
In Figure 3, the SED of a subflare is shown. The impact of the internal absorption on the gamma-ray spectrum is negligible, although the emission of the secondary pairs appears in the energy band constrained by optical measurements jor12 . For the chosen model parameters, the synchrotron secondary component goes right through the optical observational constraints, and for slightly higher -values, the secondary emission will be well below the optical points. Also, we note that the obtained spectrum does not violate the X-ray upper-limits obtained by Swift.
To illustrate the impact of external absorption, we have introduced a photon field peaking at 40 eV with a luminosity erg s-1, produced in a ring with radius cm at around the jet base. Two photon fields have been adopted, a black body and one represented by a -function, to simulate the impact of a dominant spectroscopic line. As seen in Figure 3, the impact of such an external field can be important. The treatment of the secondary emission of the produced pairs is beyond the scope of this work.
In addition to optical photons, radio emission was also detected at the flare epoch and thought to be linked to the gamma-ray activity jor12 . This radiation is strongly sensitive to the details of the flow dynamics, and at this stage we will not try to interpret radio observations. However, we note that the energetics involved in gamma-ray production is very large, and JRGI comprehends complex magnetohydrodynamical and radiative processes, so it could easily accommodate the presence of a population of radio-emitting electrons at .
Swift X-rays could be also linked to the JRGI activity. X-rays may come from secondary pairs produced via pair creation, or from a primary population of electrons(/positrons). However, as with radio data, given the complexity of the problem we have not tried at this stage to explain the X-ray emission contemporaneous to the GeV flare.
V Discussion
The observations of 3C454.3 with Fermi revealed several quite puzzling features, in particular the peculiar lightcurve, with a nearly steady plateau phase that was interrupted by an exceptionally bright flare. The detected flux corresponds to an apparent luminosity of , which almost unavoidably implies a presence of a very powerful jet (see e.g. bgf11, ; kbbad13, ). In the case of powerful jets, the JRGI scenario should proceed in a quite specific way as compared to other cases already considered in the literature babkk10 . In particular, the mass of the material initially removed from the star might be very large, resulting in rather long cloud expansion and acceleration timescales, the main flare being significantly delayed with respect to the moment of the star entrance into the jet. The plateau emission would otherwise start just after the jet penetration, and come from the jet crushing of lighter clouds ejected from the stellar surface while the star travels through the jet. The duration of the plateau phase would be determined by the time required by the main cloud to expand and accelerate.
We have studied the lightcurve obtained with Fermi in the context of the JRGI scenario aiming to satisfy three main properties of the flare: total energy, maximum luminosity and duration of the plateau stage. It was shown that the key properties of the jet, i.e. the jet ram pressure (linked to its luminosity) and Lorentz factor, as well as the cloud/blob characteristics, i.e. mass and cross section, can be reconstructed as functions of the dimensionless parameter . It was also shown that in the limit of small -values, the parameter space is less demanding concerning the jet luminosity, and the key characteristics of the model saturate at values independent of , which allows conclusive cross-checks of the scenario. In particular, the flare raise time appeared to be an independent parameter, with its value of h closely matching the rising time of of h obtained observationally. Furthermore, it was shown (see kbbad13 ) that for the inferred jet properties the jet-induced stellar wind can provide a mass-loss rate large enough to generate a steady emission component with a luminosity comparable to that of the plateau.
Although the analysis of different radiation channels involves additional assumptions regarding the spectrum of the nonthermal particles and density of the target fields, it was possible to show that for magnetic fields not far below equipartition (as expected in a magnetically launched jet) all the conventional radiation channels can be discarded, and the emission detected with Fermi can be produced through proton synchrotron emission (unless , making electron synchrotron also feasible). We note that in this case the emission from pairs created within the blob may also explain the reported optical enhancement at the flare epoch.
Since the duration of the expansion phase determines the delay between the onset of the plateau phase and the flare itself, it is important to check whether the suggested scenario is consistent with other flares registered with Fermi from the source, e.g., in December 2009 and April 2010 agile10 ; fermi10 . This issue can be addressed through a simple scaling that relates the duration of the plateau phase to the total energy released during the active phase: . Therefore, for the previous events, with energy releases 1-2 orders of magnitude smaller than that of the November 2010 flare, a rough estimation of the plateau duration gives plateau durations between and days, consistent with observations.
Acknowledgements.
The authors are thankful to S. Kelner for useful discussions and Benoit Lott for kindly provided observational data. BMV acknowledge partial support by JSPS (Japan Society for the Promotion of Science): No.2503786, 25610056, 26287056, 26800159. BMV also MEXT (Ministry of Education, Culture, Sports, Science and Technology): No.26105521 and RFBR grant 12-02-01336-a. V.B.-R. acknowledges support by the Spanish Ministerio de Ciencia e Innovación (MICINN) under grants AYA2010-21782-C03-01 and FPA2010-22056-C06-02. V.B.-R. acknowledges financial support from MINECO through a Ramón y Cajal fellowship. This research has been supported by the Marie Curie Career Integration Grant 321520.References
- (1) A. A. Abdo and et al. Fermi Gamma-ray Space Telescope Observations of the Gamma-ray Outburst from 3C454.3 in November 2010. ApJ, 733:L26, June 2011.
- (2) M. Ackermann and et al. Fermi Gamma-ray Space Telescope Observations of Gamma-ray Outbursts from 3C 454.3 in 2009 December and 2010 April. Astrophys. J. , 721:1383–1396, Oct. 2010.
- (3) F. A. Aharonian. TeV gamma rays from BL Lac objects due to synchrotron radiation of extremely high energy protons. New Astronomy, 5:377–395, Nov. 2000.
- (4) F. A. Aharonian. Proton-synchrotron radiation of large-scale jets in active galactic nuclei. MNRAS, 332:215–230, May 2002.
- (5) M. V. Barkov, F. A. Aharonian, S. V. Bogovalov, S. R. Kelner, and D. Khangulyan. Rapid TeV Variability in Blazars as a Result of Jet-Star Interaction. Astrophys. J. , 749:119, Apr. 2012.
- (6) M. V. Barkov, F. A. Aharonian, and V. Bosch-Ramon. Gamma-ray Flares from Red Giant/Jet Interactions in Active Galactic Nuclei. Astrophys. J. , 724:1517–1523, Dec. 2010.
- (7) M. V. Barkov, V. Bosch-Ramon, and F. A. Aharonian. Interpretation of the Flares of M87 at TeV Energies in the Cloud-Jet Interaction Scenario. Astrophys. J. , 755:170, Aug. 2012.
- (8) R. D. Blandford and R. L. Znajek. Electromagnetic extraction of energy from Kerr black holes. MNRAS, 179:433–456, May 1977.
- (9) G. Bonnoli, G. Ghisellini, L. Foschini, F. Tavecchio, and G. Ghirlanda. The -ray brightest days of the blazar 3C 454.3. MNRAS, 410:368–380, Jan. 2011.
- (10) V. Bosch-Ramon, M. Perucho, and M. V. Barkov. Clouds and red giants interacting with the base of AGN jets. A&A, 539:A69, Mar. 2012.
- (11) G. Ghisellini, L. Foschini, F. Tavecchio, and E. Pian. On the 2007 July flare of the blazar 3C 454.3. MNRAS, 382:L82–L86, Nov. 2007.
- (12) M. Gu, X. Cao, and D. R. Jiang. On the masses of black holes in radio-loud quasars. MNRAS, 327:1111–1115, Nov. 2001.
- (13) S. G. Jorstad and et al. Flaring Behavior of the Quasar 3C 454.3 Across the Electromagnetic Spectrum. Astrophys. J. , 715:362–384, May 2010.
- (14) S. G. Jorstad, A. P. Marscher, M. Joshi, N. R. MacDonald, T. L. Scott, K. E. Williamson, P. S. Smith, V. M. Larionov, I. Agudo, and M. Gurwell. Parsec-Scale Jet Behavior of the Quasar 3C 454.3 during the High Gamma-Ray States in 2009 and 2010. ArXiv:1205.0520, May 2012.
- (15) K. Katarzyński and G. Ghisellini. Dissipation of jet bulk kinetic energy in powerful blazars. A&A, 463:529–537, Feb. 2007.
- (16) D. V. Khangulyan, M. V. Barkov, V. Bosch-Ramon, F. A. Aharonian, and A. V. Dorodnitsyn. Star-Jet Interactions and Gamma-Ray Outbursts from 3C454.3. Astrophys. J. , 774:113, Sept. 2013.
- (17) S. S. Komissarov, M. V. Barkov, N. Vlahakis, and A. Königl. Magnetic acceleration of relativistic active galactic nucleus jets. MNRAS, 380:51–70, Sept. 2007.
- (18) S. S. Komissarov, N. Vlahakis, A. Königl, and M. V. Barkov. Magnetic acceleration of ultrarelativistic jets in gamma-ray burst sources. MNRAS, 394:1182–1212, Apr. 2009.
- (19) M. López-Corredoira and M. Perucho. Kinetic power of quasars and statistical excess of MOJAVE superluminal motions. A&A, 544:A56, Aug. 2012.
- (20) A. Mücke and R. J. Protheroe. A proton synchrotron blazar model for flaring in Markarian 501. Astroparticle Physics, 15:121–136, Mar. 2001.
- (21) M. Sikora, R. Moderski, and G. M. Madejski. 3C 454.3 Reveals the Structure and Physics of Its “Blazar Zone”. Astrophys. J. , 675:71–78, Mar. 2008.
- (22) E. Striani and et al. The Extraordinary Gamma-ray Flare of the Blazar 3C 454.3. Astrophys. J. , 718:455–459, July 2010.
- (23) S. Vercellone and et al. The Brightest Gamma-Ray Flaring Blazar in the Sky: AGILE and Multi-wavelength Observations of 3C 454.3 During 2010 November. ApJ, 736:L38, Aug. 2011.
- (24) A. E. Wehrle, A. P. Marscher, S. G. Jorstad, M. A. Gurwell, M. Joshi, N. R. MacDonald, K. E. Williamson, I. Agudo, and D. Grupe. Multiwavelength Variations of 3C 454.3 during the 2010 November to 2011 January Outburst. Astrophys. J. , 758:72, Oct. 2012.