THE IDENTIFICATION OF -DROPOUTS IN PAN-STARRS1: THREE QUASARS AT 11affiliation: Based in part on observations collected at the European Southern Observatory, Chile, programs 179.A-2010, 092.A-0150, 093.A-0863 and 093.A-0574, and at the Centro Astronómico Hispano Alemán (CAHA) at Calar Alto, operated jointly by the Max-Planck Institut für Astronomie and the Instituto de Astrofísica de Andalucía (CSIC). This paper also includes data gathered with the 6.5 meter Magellan Telescopes located at Las Campanas Observatory, Chile, at the MMT Observatory, a joint facility of the University of Arizona and the Smithsonian Institution, and with the LBT.
Abstract
Luminous distant quasars are unique probes of the high redshift intergalactic medium (IGM) and of the growth of massive galaxies and black holes in the early universe. Absorption due to neutral Hydrogen in the IGM makes quasars beyond a redshift of very faint in the optical -band, thus locating quasars at higher redshifts require large surveys that are sensitive above 1 micron. We report the discovery of three new quasars, corresponding to an age of the universe of Myr, selected as -band dropouts in the Pan-STARRS1 survey. This increases the number of known quasars from 4 to 7. The quasars have redshifts of , 6.52, and 6.66, and include the brightest -dropout quasar reported to date, PSO J036.5078+03.0498 with . We obtained near-infrared spectroscopy for the quasars and from the Mg II line we estimate that the central black holes have masses between and , and are accreting close to the Eddington limit (). We investigate the ionized regions around the quasars and find near zone radii of proper Mpc, confirming the trend of decreasing near zone sizes with increasing redshift found for quasars at . By combining of the PS1 quasars with those of quasars in the literature, we derive a luminosity corrected redshift evolution of Mpc. However, the large spread in in the new quasars implies a wide range in quasar ages and/or a large variation in the neutral Hydrogen fraction along different lines of sight.
Subject headings:
cosmology: observations — galaxies: active — quasars: general — quasars: individual (PSO J036.5078+03.0498, PSO J167.6415-13.4960, PSO J338.2298+29.5089)1. INTRODUCTION
Quasars are the most luminous non-transient objects known. Their high luminosity makes quasars ideal to probe the universe at early cosmic times. Since distant () luminous quasars are rare, with an estimated source density of 1 per Gpc3 (e.g., Fan et al., 2004; Willott et al., 2010b), surveys covering a large area of the sky are required to uncover the distant quasar population. Over the last 15 years more than 70 quasars with redshifts between have been discovered in various surveys (e.g., Fan et al., 2006; Jiang et al., 2008; Mortlock et al., 2009; Willott et al., 2010a; Morganson et al., 2012; Bañados et al., 2014). Most of these quasars have been found by looking for sources with a large break between the optical and -bands (e.g., Fan et al., 2006), the so-called -band dropouts or -dropouts. To find quasars beyond wide-field surveys with coverage beyond 1 m are needed.
Currently, four quasars above have been discovered in near-infrared surveys. Mortlock et al. (2011) presented a quasar at discovered in the UK infrared Telescope Infrared Deep Sky Survey (UKIDSS; Lawrence et al., 2007), while Venemans et al. (2013) reported three quasars at from the Visible and Infrared Survey Telescope Kilo-Degree Infrared Galaxy (VIKING) survey. Detailed studies of these four quasars have given insight into the properties of the universe less than a Gyr after the Big Bang. For example, the optical spectrum of the quasar places constraints on the fraction of neutral Hydrogen (Mortlock et al., 2011; Bolton et al., 2011), while Simcoe et al. (2012) uses near-infrared spectroscopy to put limits on the metal enrichment (“metallicity”) of the intergalactic medium up to . Furthermore, these quasars set a lower limit to the number density of supermassive black holes at : Mpc-3 (Venemans et al., 2013; De Rosa et al., 2014).
The limitation of both UKIDSS and VIKING is that they cover only small fractions of the extragalactic sky: UKIDSS has imaged 4000 deg2, while VIKING will cover an area of 1500 deg2. Overcoming this limitation, the Panoramic Survey Telescope & Rapid Response System 1 (Pan-STARRS1, PS1; Kaiser et al., 2002, 2010) has imaged the whole sky above a declination of –30∘ for about four years in five filters (, , , , and ; Stubbs et al., 2010; Tonry et al., 2012). The inclusion of the filter (central wavelength Å, FWHM Å; Tonry et al., 2012) enables the search for luminous quasars at over more than 20,000 deg2 of extragalactic sky by selecting sources with a red – colors (-dropouts, see Fig. 1). In this paper we present the first results from our ongoing search for quasars in the PS1 data.
All magnitudes are given in the AB system and we adopt a cosmology with km s-1 Mpc-1, and (Komatsu et al., 2011).
2. CANDIDATE SELECTION
2.1. The Pan-STARRS1 3 Survey
To search for -dropouts, we made use of the first internal release of stacked PS1 imaging data (PV1). We selected our initial quasar candidates as objects with a signal-to-noise ratio (S/N), and a non-detection in the and bands (i.e. S/N ). We further required a break between the and bands (see also Fig. 1 in Bañados et al., 2014):
To avoid extended sources we demanded that the difference between the -band PSF and aperture magnitudes () to be consistent within 0.3 mag. This value was determined by comparing with spectroscopically confirmed stars and galaxies from the SDSS-III database111http://www.sdss3.org/. Setting selected the vast majority of stars (%), while rejecting a large fraction (94%) of galaxies. Lastly, we removed sources that were marked as likely spurious in the catalogs (see Bañados et al., 2014) or that had less than 85% of the expected flux in the or images on valid pixels. For bright sources ( ) we applied the same criteria but we relaxed our limits in the , , and -bands, requiring S/N .
The total number of -dropouts selected from the PS1 catalogs after removing objects in the plane of the Milky Way and M31 ( and R.A.; Decl.) was (of which 13,093 had ).
2.2. Public infrared surveys
To extend and verify the photometry of the quasar candidates selected from the PS1 catalogs we first matched the sources with several public infrared surveys.
UKIDSS: The PS1 candidates were matched with the near-infrared data of the UKIDSS survey (Lawrence et al., 2007). The UKIDSS Large Area Survey (LAS) provides , , and imaging over 4000 deg2. We matched the PS1 -dropout list with the catalogs from the UKIDSS data release222 http://surveys.roe.ac.uk/wsa/dr10plus_release.html 10, using a search radius of 20. We identified objects as foreground interlopers if they had a or (which is typical for cool dwarfs; see e.g., Best et al., 2013) and removed them from our candidate lists.
VHS: For objects in the area R.A. and Decl. , aperture photometry was performed on the , , and images of the VISTA Hemisphere Survey (VHS; McMahon et al., 2013). We applied the same color criteria as for our UKIDSS matched list.
WISE: The Wide-field Infrared Survey Explorer (WISE; Wright et al., 2010) surveyed the entire mid-infrared sky in four bands centered at 3.4, 4.6, 12 and 22 m. The NEOWISE observations (Mainzer et al., 2011) surveyed 70% of the sky at 3.4 and 4.6 m (hereafter W1 and W2). Both surveys were combined to produce the AllWISE catalogs333 http://wise2.ipac.caltech.edu/docs/release/allwise/. To rule out spurious candidates, we required PS1 -dropouts without a match in the VHS or UKIDSS surveys to have a counterpart in the AllWISE catalogs within 30 to be considered real sources.
Objects with a S/N in W1 and W2 were assigned a higher priority if their colors fulfilled the additional criteria: AND , which is loosely based on the PS1-WISE colors of brown dwarfs (e.g., Best et al., 2013). Objects with a S/N in W1 or W2 were assigned with an intermediate priority and the remaining candidates were given a low priority.
For the approximately 13,000 objects with a match in at least one of the above surveys, we performed forced photometry on the PS1 images to confirm the colors and non-detections (see Bañados et al., 2014). After visually inspecting the remaining 1000 candidates we selected the best 500 objects that were our main targets for follow-up observations.
3. FOLLOW-UP OBSERVATIONS
| ObjectaaFor the full name and coordinates, see Table 2. | Date | Telescope/Instrument | range / filters | Exposure Time | Slit Width |
|---|---|---|---|---|---|
| 2014 January 24–February 5 | MPG 2.2m/GROND | , , , , , , | 460 s–960 s | – | |
| 2014 March 2–6 | NTT/EFOSC2 | , | 600 s | – | |
| 2014 March 2 & 5 | NTT/SofI | 300 s | – | ||
| 2014 March 16–19 | CAHA 3.5m/Omega2000 | , , | 300 s–600 s | – | |
| 2014 July 23–28 | NTT/EFOSC2 | , | 600 s | – | |
| 2014 July 25 | NTT/SofI | 600 s | – | ||
| 2014 August 7 & 11–13 | CAHA 3.5m/Omega2000 | , | 600 s | – | |
| P167–13 | 2014 April 26 | VLT/FORS2 | 0.74–1.07 m | 2630 s | 13 |
| 2014 May 30–June 2 | Magellan/FIRE | 0.82–2.49 m | 12004 s | 06 | |
| P036+03 | 2014 July 25 | NTT/EFOSC2 | 0.60–1.03 m | 7200 s | 12 |
| 2014 September 4–6 | Magellan/FIRE | 0.82–2.49 m | 8433 s | 06 | |
| 2014 October 20 | Keck I/LRIS | 0.55–1.03 m | 1800 sbbObservations in cloudy conditions. | 10 | |
| P338+29 | 2014 October 19 | MMT/Red Channel | 0.67–1.03 m | 1800 s | 10 |
| 2014 October 30 | Magellan/FIRE | 0.82–2.49 m | 7200 sbbObservations in cloudy conditions. | 06 | |
| 2014 November 27 | LBT/MODS | 0.51–1.06 m | 2700 s | 12 | |
| 2014 December 6 | LBT/LUCI | 2.05–2.37 m | 3360 s | 15 |
To confirm the colors of the possible quasars and to remove lower redshift interlopers, we imaged 194 -dropout candidates during five observing runs. We obtained optical and infrared images between 2014 January 24 and 2014 August 13 with the MPG 2.2m/GROND (Greiner et al., 2008), NTT/EFOSC2 (Buzzoni et al., 1984), NTT/SofI (Moorwood et al., 1998) and the Calar Alto 3.5m/Omega2000 (Bailer-Jones et al., 2000), see Table 1 for the details of the observations.
Candidates were considered foreground interlopers if they had (see Sect. 2.2). Sources with a or undetected in were rejected on the basis that they could be moving, varying or a spurious object in the PS1 catalog. We reobserved objects with with the NTT in the filters and . Only three sources remained undetected in or were red with . These objects were targets for spectroscopy.
We obtained optical and near-infrared spectroscopy of all the three candidates that had good quasar colors after the follow-up imaging. We carried out spectroscopic observations between 2014 April 26 and 2014 December 6 using the following instruments: VLT/FORS2 (Appenzeller et al., 1998); Megallan/FIRE (Simcoe et al., 2008, 2010); NTT/EFOSC2; Keck/LRIS (Oke et al., 1995); MMT/Red Channel Spectrograph; and LBT/MODS (Pogge et al., 2010) and LBT/LUCI (Seifert et al., 2003). Details of the observations are listed in Table 1.
4. THREE QUASARS AT
| PSO J167.6415–13.4960 | PSO J036.5078+03.0498 | PSO J338.2298+29.5089 | |
|---|---|---|---|
| Abbreviated name | P167–13 | P036+03 | P338+29 |
| R.A. (J2000) | 11h10m33.98 | 02h26m01.88 | 22h32m55.15 |
| Decl. (J2000) | –13∘29′456 | +03∘02′594 | +29∘30′322 |
| 24.68aaNon-detections listed as upper limits. | 24.37aaNon-detections listed as upper limits. | ||
| 22.54aaNon-detections listed as upper limits. | 22.25aaNon-detections listed as upper limits. | ||
| bb Listed in the AllWISE Reject table. | |||
| FWHMMgII (km s-1) | |||
| () | |||
| (proper Mpc) | |||
| (proper Mpc) |
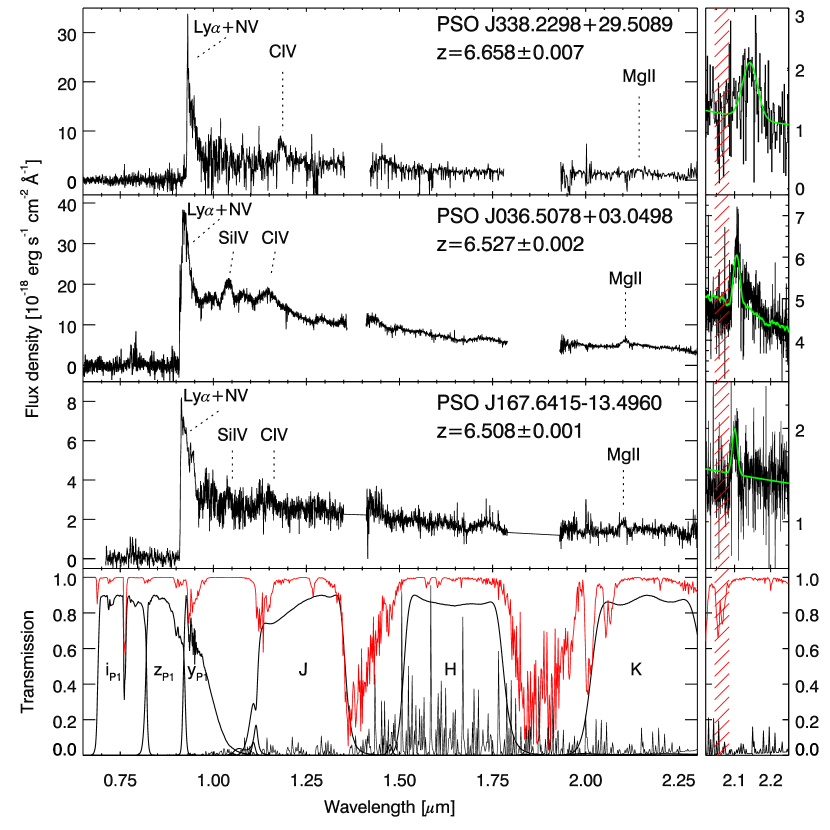
All three -dropouts for which we obtained optical spectroscopy showed a strong continuum break in their optical spectrum (Fig. 1) and were identified as quasars at redshifts . We fitted the continuum with three components: a power-law with slope (), a Balmer continuum and an Fe II template (see e.g., De Rosa et al., 2014). In all cases the Balmer continuum was found to be negligible at the wavelengths we considered ( Å). A single-Gaussian fit of the emission lines (most prominently C IV and Mg II) provided a sufficiently good model of the line profiles given the S/N of our spectra. Only in the spectrum of the brightest quasar, PSO J036.5078+03.0498, we were able to constrain on the Fe II emission (Section 4.2). The near-infrared spectra of the other two quasars did not have sufficient S/N. This did not significantly affect the fit of the Mg II lines in these quasars.
The redshifts were determined by the peak of the Mg II line. Other bright emission lines, such as Si IV 1397 and C IV 1549, are blueshifted by 300–2000 km s-1 with respect to Mg II. Such shifts are similar to those measured in spectra of other distant luminous quasars (e.g., Richards et al., 2002; De Rosa et al., 2014).
We estimated black hole masses using the local scaling relation based on the Mg II line (Eq. 1 in Vestergaard & Osmer, 2009), which has a systematic uncertainty of a factor 3. The black hole mass uncertainties quoted in Sections 4.1–4.3 and in Table 2 represent only statistical errors.
We computed bolometric luminosities by applying the bolometric correction obtainted by Shen et al. (2008) to the monochromatic luminosity density measured at 3000 Å. The Eddington luminosity is defined as erg s-1.
A summary of the photometric properties and the parameters derived from the spectra is provided in Table 2. Below we describe the new quasars in more detail.
4.1. PSO J167.6415–13.4960
The quasar PSO J167.6415–13.4960 (hereafter P167–13) was discovered based on forced photometry on VHS images at the positions of PS1 candidates. Our FORS2 discovery spectrum revealed a source with a strong continuum decrement around 9100 Å, and we identified the object as a quasar with a redshift of . From the near-infrared spectrum we derive a redshift . This quasar is the faintest of our new discoveries with . The power-law slope of is red compared to the slope of of the SDSS quasar composite spectrum of Vanden Berk et al. (2001). The estimated black hole mass is , and the Eddington ratio is consistent with maximal accretion ().
4.2. PSO J036.5078+03.0498
PSO J036.5078+03.0498 (hereafter P036+03) was selected as part of our extended, bright -dropout search and was matched to a source in the UKIDSS and WISE catalogs. The high S/N FIRE spectrum revealed blue quasar continuum emission () at a redshift . The absolute magnitude of makes this quasar one of the most luminous objects known at . The bolometric luminosity is estimated to be erg s-1. The central black hole has an estimated mass of . The accretion rate is close to Eddington with . The quality of the infrared spectrum is not sufficient to constrain the Fe II emission to better than . We measure Fe II/Mg II , fully consistent with previously discovered quasars at similar redshifts (e.g., De Rosa et al., 2014).
4.3. PSO J338.2298+29.5089
PSO J338.2298+29.5089 (hereafter P338+29) was one of the -dropout candidates with a match in the WISE catalog. The discovery spectrum shows a source with a strong, narrow emission line at 9314 Å and continuum redward of the line, which we identify as Ly at a redshift of . From the FIRE spectrum we measure , , and a blue continuum slope . Although the Mg II line suffers from sky residuals on its blue side, we estimate a black hole mass of and an accretion rate of .
5. QUASAR IONIZATION REGION
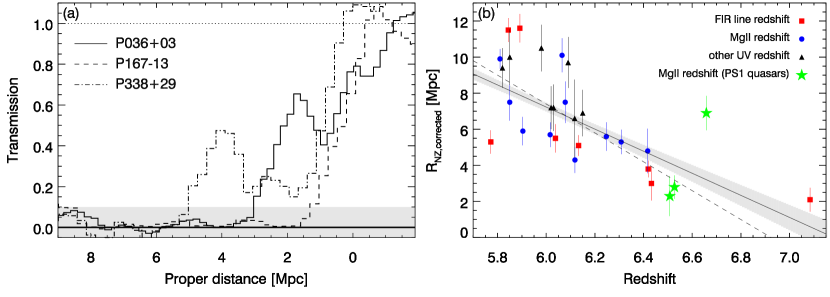
Quasar near zones are the regions surrounding distant quasars where the UV radiation of the central source has ionized the H I. The size of the near zone () is a function of, among others, the quasar age, the flux of ionizing photons and the fraction of neutral H () in the IGM. A study of near zones of quasars was performed by Carilli et al. (2010), measuring around 27 quasars. To compare the near zone sizes as function of redshifts, Carilli et al. (2010) scaled the measured to an absolute magnitude of : . They found that the ionized region around quasars decreases with increasing redshift and follows the relation . This signals an increase in close to quasars at higher redshifts, although it is not straightforward to translate a change in to a change in (e.g., Bolton & Haehnelt, 2007).
We measured the near zones following the method described in Fan et al. (2006) and also employed by Carilli et al. (2010). The results are shown in Fig. 2a. We derive near zone radii of 1.5, 3.1, and 5.2 Mpc (proper) for P167–13, P036+03, and P338+29, respectively. The uncertainty in the computed near zone (including the uncertainty in the quasar’s systemic redshift derived from Mg II) is about 0.7 Mpc (Carilli et al., 2010). The sizes scaled to are , 2.8, and 6.9 Mpc, respectively.
In Fig. 2b we compare the near zones of the PS1 quasars with those of quasars from the literature. The PS1 quasars roughly follow the trend of smaller near zones at higher redshifts. A weighted linear fit results in a relation Mpc. Interpreting the decrease in as an increase in , (e.g., Fan et al. 2006, but see Bolton & Haehnelt 2007), the decrease in by a factor 6.5 between and implies an increase in the neutral fraction of a factor 180. Combined with a measured at (e.g., Fan et al., 2006), this suggests at , confirming the rapid evolution of at (e.g., Fan et al., 2006; Bolton et al., 2011). The large spread (a factor 3) in (corrected) near zone sizes between individual quasars indicates a wide range in quasar ages and/or a large variation in along different lines of sight.
6. SUMMARY
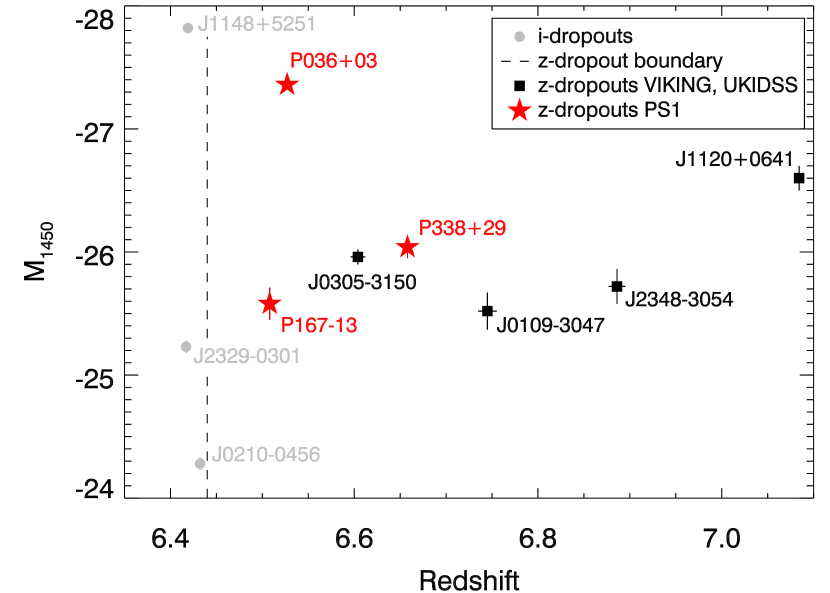
We identified three new quasars at redshifts in PS1, nearly doubling the number of known quasars from 4 to 7. The newly discovered quasars have a wide range of properties (Table 2). The rest-frame UV luminosities are between and . The brightest of the PS1 quasars is the most luminous quasar discovered at so far (Fig. 3), with a luminosity at 1450 Å close to that of the bright SDSS quasar J1148+5251 at (Fan et al., 2003). The faintest PS1 quasar is only marginally brighter than the faintest quasar found in the VIKING survey (J0109–3047; Venemans et al., 2013). Since the areal coverage of PS1 is more than 10 larger than that of VIKING, this is very promising for our continuing PS1 -dropout search.
The PS1 quasars are powered by black holes with estimated masses between , based on the Mg II line widths and the quasar luminosities. The black holes are accreting in the range 0.13–1.2 times the Eddington limit. Black hole masses, accretion rates and (when estimated) Mg II/Fe II ratio are similar to those derived for other quasars (e.g., Willott et al., 2010a; De Rosa et al., 2014).
We derived the ionized region around the quasars and found (luminosity corrected) near zones between 2.3 and 6.9 Mpc, in line with the sizes measured around quasars. By comparing the near zone radii of quasars between , we derive that the average size of the quasar ionization region decreases by a factor 6.5 between and . This implies a neutral Hydrogen fraction in the IGM of a few percent at , although the scatter in at all redshifts (a factor 3 between the new quasars) suggest large variations in along different lines of sight.
References
- Appenzeller et al. (1998) Appenzeller, I., Fricke, K., Fürtig, W., et al. 1998, Msngr, 94, 1
- Bañados et al. (2014) Bañados, E., Venemans, B. P., Morganson, E., et al. 2014, AJ, 148, 14
- Bailer-Jones et al. (2000) Bailer-Jones, C. A., Bizenberger, P., & Storz, C. 2000, Proc. SPIE, 4008, 1305
- Best et al. (2013) Best, W. M. J., Liu, M. C., Magnier, E. A., et al. 2013, ApJ, 777, 84
- Bolton & Haehnelt (2007) Bolton, J. S. & Haehnelt, M. G. 2007, MNRAS, 381, L35
- Bolton et al. (2011) Bolton, J. S., Haehnelt, M. G., Warren, S. J., et al. 2011, MNRAS, 416, L70
- Buzzoni et al. (1984) Buzzoni, B., Delabre, B., Dekker, H., et al. 1984, Msngr, 38, 9
- Carilli et al. (2010) Carilli, C. L., Wang, R., Fan, X., et al. 2010, ApJ, 714, 834
- De Rosa et al. (2014) De Rosa, G., Venemans, B. P., Decarli, R., et al. 2014, ApJ, 790, 145
- Fan et al. (2004) Fan, X., Hennawi, J. F., Richards, G. T., et al. 2004, AJ, 128, 515
- Fan et al. (2006) Fan, X., Strauss, M. A., Becker, R. H., et al. 2006, AJ, 132, 117
- Fan et al. (2003) Fan, X., Strauss, M. A., Schneider, D. P., et al. 2003, AJ, 125, 1649
- Greiner et al. (2008) Greiner, J., Bornemann, W., Clemens, C., et al. 2008, PASP, 120, 405
- Jiang et al. (2008) Jiang, L., Fan, X., Annis, J., et al. 2008, AJ, 135, 1057
- Kaiser et al. (2002) Kaiser, N., Aussel, H., Burke, B. E., et al. 2002, Proc. SPIE, 4836, 154
- Kaiser et al. (2010) Kaiser, N., Burgett, W., Chambers, K., et al. 2010, Proc. SPIE, 7733, 12
- Komatsu et al. (2011) Komatsu, E., Smith, K. M., Dunkley, J., et al. 2011, ApJS, 192, 18
- Lawrence et al. (2007) Lawrence, A., Warren, S. J., Almaini, O., et al. 2007, MNRAS, 379, 1599
- Mainzer et al. (2011) Mainzer, A., Bauer, J., Grav, T., et al. 2011, ApJ, 731, 53
- McMahon et al. (2013) McMahon, R. G., Banerji, M., Gonzalez, E., et al. 2013, Msngr, 154, 35
- Moorwood et al. (1998) Moorwood, A., Cuby, J.-G., & Lidman, C. 1998, Msngr, 91, 9
- Morganson et al. (2012) Morganson, E., De Rosa, G., Decarli, R., et al. 2012, AJ, 143, 142
- Mortlock et al. (2009) Mortlock, D. J., Patel, M., Warren, S. J., et al. 2009, A&A, 505, 97
- Mortlock et al. (2011) Mortlock, D. J., Warren, S. J., Venemans, B. P., et al. 2011, Natur, 474, 616
- Oke et al. (1995) Oke, J. B., Cohen, J. G., Carr, et al. 1995, PASP, 107, 375
- Pogge et al. (2010) Pogge, R. W., Atwood, B., Brewer, D. F., et al. 2010, Proc. SPIE, 7735, 9
- Richards et al. (2002) Richards, G. T., Vanden Berk, D. E., Reichard, T. A., et al. 2002, AJ, 124, 1
- Seifert et al. (2003) Seifert, W., Appenzeller, I., Baumeister, H., et al. 2003, Proc. SPIE, 4841, 962
- Shen et al. (2008) Shen, Y., Greene, J. E., Strauss, M. A., Richards, G. T., & Schneider, D. P. 2008, ApJ, 680, 169
- Simcoe et al. (2008) Simcoe, R. A., Burgasser, A. J., Bernstein, R. A., et al. 2008, Proc. SPIE, 7014, 70140U
- Simcoe et al. (2010) Simcoe, R. A., Burgasser, A. J., Bochanski, J. J., et al. 2010, Proc. SPIE, 7735, 772514
- Simcoe et al. (2012) Simcoe, R. A., Sullivan, P. W., Cooksey, K. L., et al. 2012, Natur, 492, 79
- Stubbs et al. (2010) Stubbs, C. W., Doherty, P., Cramer, C., et al. 2010, ApJS, 191, 376
- Tonry et al. (2012) Tonry, J. L., Stubbs, C. W., Lykke, K. R., et al. 2012, ApJ, 750, 99
- Vanden Berk et al. (2001) Vanden Berk, D. E., Richards, G. T., Bauer, A., et al. 2001, AJ, 122, 549
- Venemans et al. (2013) Venemans, B. P., Findlay, J. R., Sutherland, W. J., et al. 2013, ApJ, 779, 24
- Venemans et al. (2012) Venemans, B. P., McMahon, R. G., Walter, F., et al. 2012, ApJL, 751, L25
- Vestergaard & Osmer (2009) Vestergaard, M. & Osmer, P. S. 2009, ApJ, 699, 800
- Wang et al. (2013) Wang, R., Wagg, J., Carilli, C. L., et al. 2013, ApJ, 773, 44
- Willott et al. (2010a) Willott, C. J., Albert, L., Arzoumanian, D., et al. 2010a, AJ, 140, 546
- Willott et al. (2007) Willott, C. J., Delorme, P., Omont, A., et al. 2007, AJ, 134, 2435
- Willott et al. (2010b) Willott, C. J., Delorme, P., Reylé, C., et al. 2010b, AJ, 139, 906
- Willott et al. (2013) Willott, C. J., Omont, A., & Bergeron, J. 2013, ApJ, 770, 13
- Wright et al. (2010) Wright, E. L., Eisenhardt, P. R. M., Mainzer, A. K., et al. 2010, AJ, 140, 1868