A Hard X-Ray Study of Ultraluminous X-ray Source NGC 5204 X-1 with NuSTAR and XMM-Newton
Abstract
We present the results from coordinated X-ray observations of the ultraluminous X-ray source NGC 5204 X-1 performed by NuSTAR and XMM-Newton in early 2013. These observations provide the first detection of NGC 5204 X-1 above , extending the broadband coverage to . The observations were carried out in two epochs separated by approximately 10 days, and showed little spectral variation, with an observed luminosity of erg s-1. The broadband spectrum robustly confirms the presence of a clear spectral downturn above seen in some previous observations. This cutoff is inconsistent with the standard low/hard state seen in Galactic black hole binaries, as would be expected from an intermediate mass black hole accreting at significantly sub-Eddington rates given the observed luminosity. The continuum is apparently dominated by two optically thick thermal-like components, potentially accompanied by a faint high energy tail. The broadband spectrum is likely associated with an accretion disk that differs from a standard Shakura & Sunyaev thin disk.
Subject headings:
Black hole physics – X-rays: binaries – X-rays: individual (NGC 5204 X-1)1. Introduction
Ultraluminous X-ray Sources (ULXs) are off-nuclear point sources in nearby galaxies with observed X-ray luminosities erg s-1, exceeding the Eddington limit for a stellar-mass black hole (assuming isotropy). These high luminosities could be explained by a population of intermediate-mass black holes (IMBHs) accreting at sub-Eddington rates (e.g. Miller et al., 2004). Alternately, these luminosities could be explained by accretion onto stellar-remnant black accretors (potentially reaching masses as large as 100 ; Zampieri & Roberts 2009; Belczynski et al. 2010) if the emission is highly beamed (e.g. King, 2009), or if these sources are able to radiate in excess of their Eddington limit (e.g. Poutanen et al., 2007). For recent reviews, see Roberts (2007) or Feng & Soria (2011).
ULX spectra in the soft X-ray band () have been well-studied using telescopes such as XMM-Newton, Suzaku, and Chandra. Their spectral shapes appear to deviate substantially from those of known Galactic black hole binaries. A spectral turnover at appears in most ULXs with sufficient signal-to-noise (Stobbart et al., 2006; Gladstone et al., 2011), along with a soft excess usually modelled by a low temperature blackbody disk component (Miller et al., 2004). This disk component, if produced by a standard thin disk, could imply the presence of an IMBH accretor. However, the temperature-luminosity relationship of these sources does not appear to match the blackbody emission from standard accretion disks (e.g. Kajava & Poutanen, 2009), although the expected scaling may be partially recovered using a fixed absorption column between observations (Miller et al., 2013a) or using non-standard disk models (Vierdayanti et al., 2006). The low disk temperature can also be explained by a cool, optically thick corona blocking the inner disk from observation (Gladstone et al., 2009). This corona would account for the continuum emission as well as the spectral turnover. Alternate possibilities are that the soft component originates from a strong outflow (e.g. Poutanen et al., 2007) or blurred line emission from highly ionized, fast-moving gas (Gonçalves & Soria, 2006).
Until now, it has been difficult to distinguish between the spectral models due to the limited 0.3–10.0 keV bandpass over which ULXs have been studied. The differences become clearer with data above (e.g. Walton et al., 2011), a region of the spectrum that requires a focusing telescope with a broader bandpass. The Nuclear Spectroscopic Telescope Array (NuSTAR; Harrison et al. 2013), launched in June 2012, is the first orbiting telescope with hard X-ray focusing capabilities over a large bandpass. With a similar effective area to XMM-Newton at 6 keV, NuSTAR provides an ideal complement to the current soft X-ray observatories for sensitive, broadband studies of ULXs. Indeed, over the past two years, NuSTAR, XMM-Newton, Chandra, Swift and Suzaku have undertaken joint observations of several nearby ULXs (Bachetti et al., 2013, 2014; Rana et al., 2015; Walton et al., 2013b, 2014, 2015a, 2015b).
This paper reports the results from observations of the ULX in NGC 5204, a nearby ( Mpc) Magellanic-type galaxy (Roberts & Warwick, 2000). NGC 5204 X-1 has a typical X-ray luminosity (Roberts et al., 2004), and is well-studied below 10 keV (Roberts et al., 2005, 2006; Vierdayanti et al., 2006). It has been previously reported as an IMBH candidate with long-term spectral variability (Feng & Kaaret, 2009)
2. Observations
In April 2013 NuSTAR and XMM-Newton performed two coordinated observations of NGC 5204, approximately 10 days apart. The NuSTAR exposures were 96 ks and 89 ks, respectively, and the XMM-Newton exposures were 13 ks and 10 ks (EPIC-pn), and 16 and 14 ks (EPIC-MOS1/2). Details of the observations are summarized in Table 1.
| OBSID | Detector | Exposure (s) | Counts |
|---|---|---|---|
| Epoch 1 — 2013 April 19 | |||
| 0693851401 | EPIC-pn | 13375 | 9176 |
| EPIC-MOS1 | 16396 | 3010 | |
| EPIC - MOS2 | 16458 | 2846 | |
| 30002037002 | FPMA | 95964 | 1871 |
| FPMB | 95799 | 1907 | |
| Epoch 2 — 2013 April 29 | |||
| 0693850701 | EPIC-pn | 10415 | 6740 |
| EPIC-MOS1 | 14036 | 2129 | |
| EPIC-MOS2 | 14260 | 2244 | |
| 30002037004 | FPMA | 88976 | 1794 |
| FPMB | 88854 | 1840 | |
2.1. NuSTAR
We reduced the NuSTAR data for each of the two focal plane modules (FPMA and FPMB) using standard methods with version 1.1.1 of the NuSTAR Data Analysis Software (NuSTARDAS) and CALDB version 20130509. We ran the nupipeline tool to produce filtered event files, using all default options to remove passages through the South Atlantic Anomaly and periods of Earth occultation, and to clean the unfiltered event files with the standard depth correction, which substantially reduces the internal high energy background. We then extracted spectral products with nuproducts, using a 38′′ radius extraction region around the source, estimating the background from a radius region free of other point sources on the same detector as the target. The NuSTAR data provide a reliable detection of NGC 5204 X-1 up to 20 keV.
2.2. XMM-Newton
The XMM-Newton data reduction was carried out with the XMM-Newton Science Analysis System (SAS v12.0.1). To produce calibrated event files we used the tools epproc and emproc for the pn and MOS detectors, respectively. We then filtered out periods of high background according to the prescription in the SAS manual.111http://xmm.esac.esa.int/ In evselect, we used the filters FLAG==0 && PATTERN4 for EPIC-pn and FLAG==0 && PATTERN12 for the EPIC-MOS cameras. Spectra were extracted with evselect from a 30′′ radius region around X-1, and the background was estimated from a blank region of radius 60′′ on the same detector, avoiding detector edges, bad pixels, and other visible sources. We also avoided the detector column passing through X-1, as recommended in the manual, to avoid the effects of charge spilling. Ancillary responses and redistribution matrices were generaged with arfgen and rmfgen, with the ELLBETA PSF correction enabled.
| Parameter | Unit | Epoch 1 | Epoch 2 |
|---|---|---|---|
| XMM-Newton | |||
| 452/383 | 402/371 | ||
| XMM+NuSTAR | |||
| 591/451 | 538/436 | ||
3. Spectral Analysis
3.1. General Procedure
The spectral analysis for this work was conducted using the Interactive Spectral Interpretation System (ISIS) (Houck & Denicola, 2000). ISIS was chosen over the more widely used XSPEC (Arnaud, 1996) for ease of programmability and its transparent use of parallelized fitting and error bar searches while also including all XSPEC models and tables.
We modeled the neutral absorption column using tbnew, a newer version of tbabs (Wilms et al., 2000), with the absorption cross-sections of Verner et al. (1996) and appropriate solar abundances. Cross-calibration between the various detectors was addressed using a multiplicative constant fixed to 1 for EPIC-pn and allowed to float otherwise; the calibrations of XMM-Newton and NuSTAR are known to generally show a good agreement (Madsen et al. 2015). We performed fitting using minimization and quote errors as confidence intervals unless stated otherwise. During our spectral analysis, all datasets were grouped to a minimum of 30 counts per bin to facilitate the use of statistics.
Fitting the XMM-Newton and broadband spectra independently with a simple power law indicates low variability between the epochs, summarized in Table 2. The residuals for these fits behave very similarly in both epochs. For the remainder of the analysis we have therefore combined the epochs using the HEASOFT tools addascaspec and addrmf to maximize source statistics.
3.2. Modelling
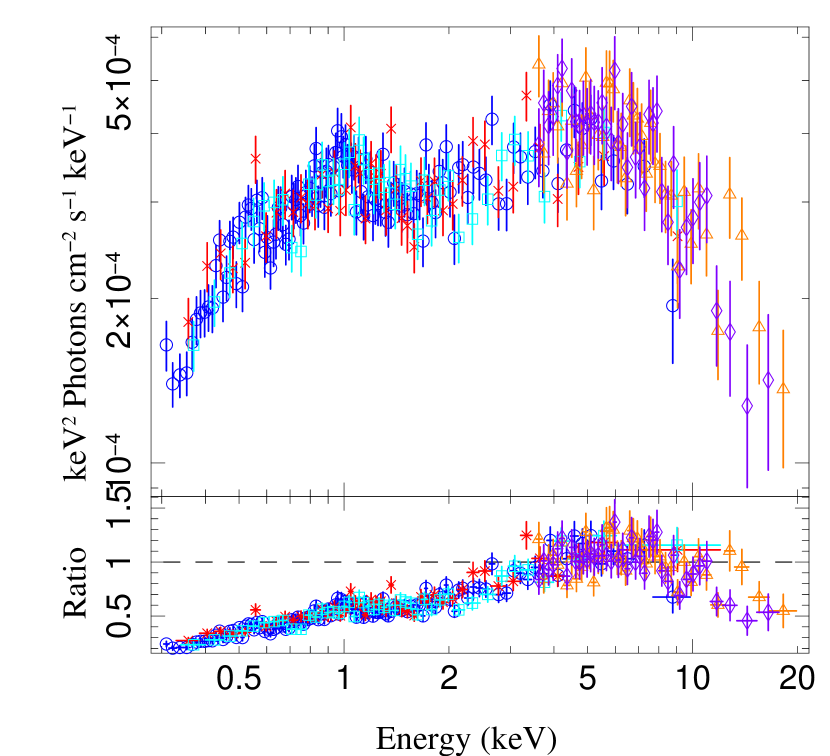
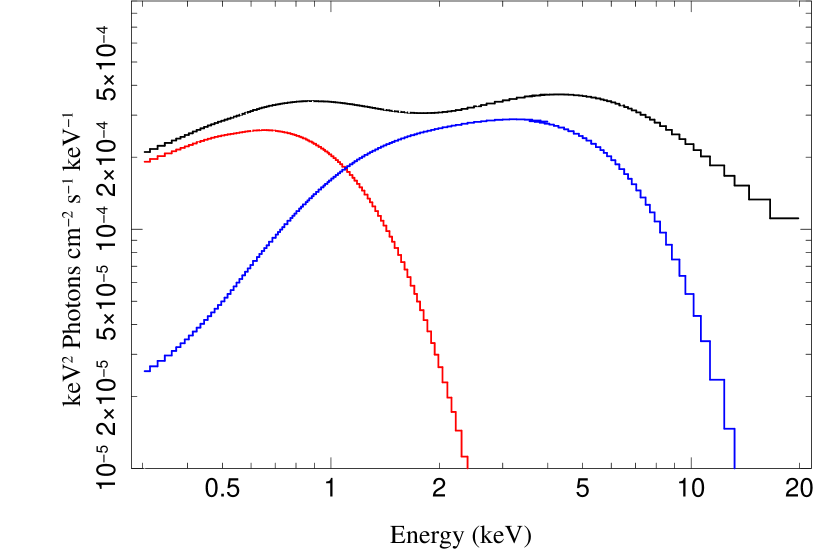
We first fit the combined spectrum restricted to the region of overlap between the XMM-Newton and NuSTAR using a simple power law continuum and Galactic neutral absorption column, fixed at (Kalberla et al., 2005). The result is a fit with , and significant spectral curvature is evident when the model is evaluated over the broader spectral range, as shown in the lower panel of Figure 1. The spectral curvature may suggest an overall neutral absorption in excess of the Galactic column, so for the remainder of this work, we introduce a second absorption component intrinsic to NGC 5204. The column of this second neutral absorption model is allowed to vary.
We fit the broadband continuum using several models frequently used to describe ULX spectra. Initially, we examine six simple models: 1) a simple power law; 2) a power law with exponential cutoff, XSPEC model cutoffpl; 3) a blackbody disk model with a radially variable temperature index, diskpbb (a “slim disk” model with advection) (Mineshige et al., 1994); 4) a simple power law with an additional Shakura & Sunyaev (1973) multicolor blackbody disk component, diskbb (Mitsuda et al., 1984); 5) a power law with an exponential cutoff and an additional multicolor blackbody disk; and 6) the same, replacing the exponential cutoff with a broken power law, XSPEC model bknpower. Most models we consider in this work are fit to both the broadband NuSTAR+XMM-Newton data and to the XMM-Newton data alone, for comparison, although we limit the majority of our description of the model fitting to the broadband spectrum.
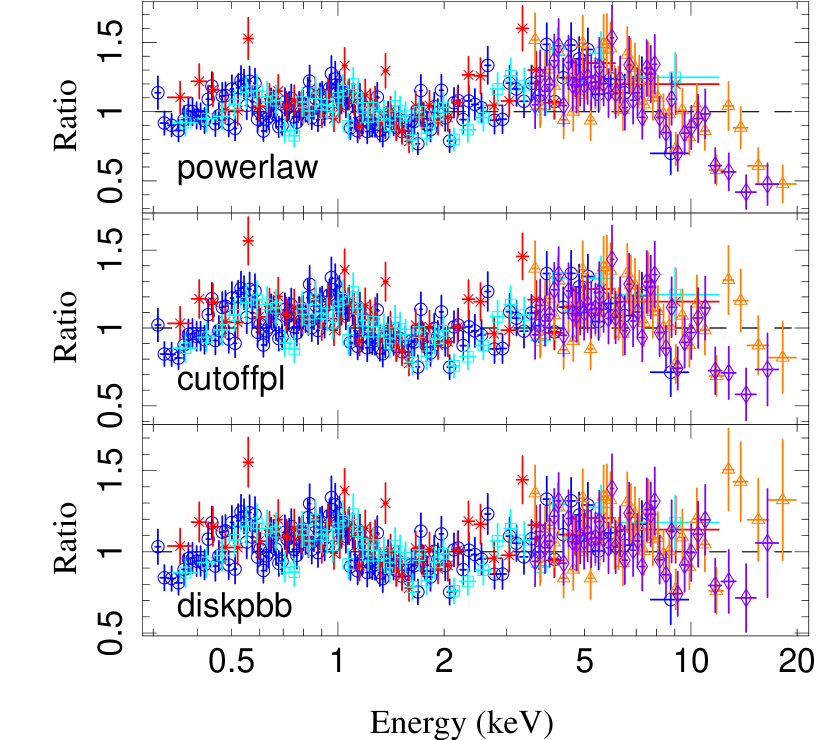
Best-fit parameters for each model are summarized in Table 3. The simple power law model gives, as seen before, a poor fit with an “m”-shaped structure to the data/model residuals below 10 keV and downward curvature in the energy range. The power law with an exponential cutoff gives an improved fit with for one fewer degree of freedom (d.o.f.), but the “m”-shape is still visible in the residuals. We also attempted to model the spectrum using just an absorbed multicolor blackbody disk, which gave a poor fit with (4582/741). At high accretion rates, the expected emission likely deviates substantially from a Shakura & Sunyaev (1973) thin disk, resulting in a shallower temperature profile (e.g. Abramowicz et al. 1988), so we tried the diskpbb model, yielding a radial temperature profile . While the diskpbb is a marked improvement over the simpler diskbb model, with (890/740), once again the “m”-shaped residuals remain, implying the need for two continuum components below 10 keV. The fits with these single component models (excluding the thin disk model, as the fit was very poor) are compared in Figure 2.
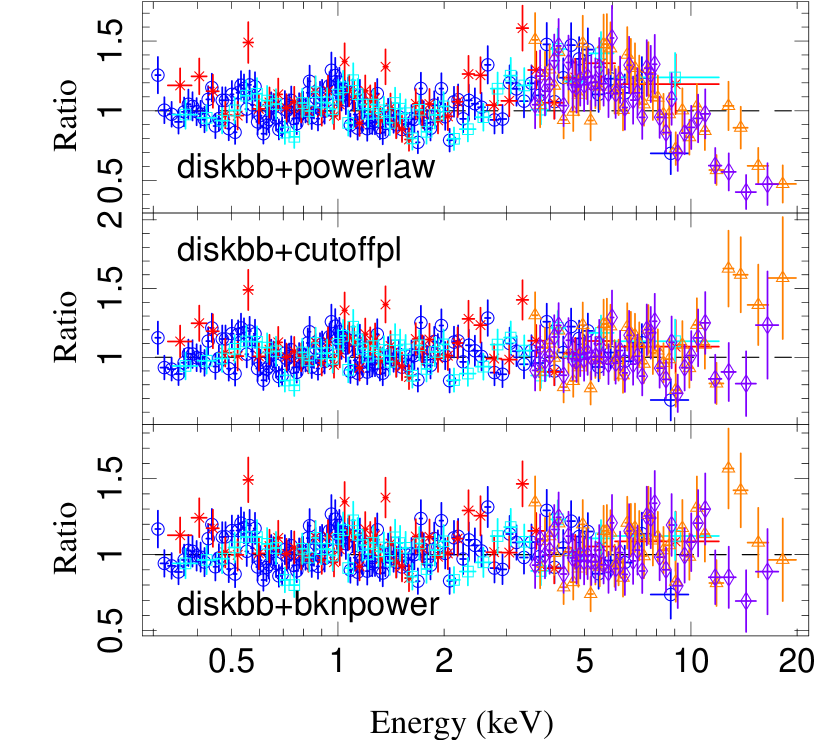
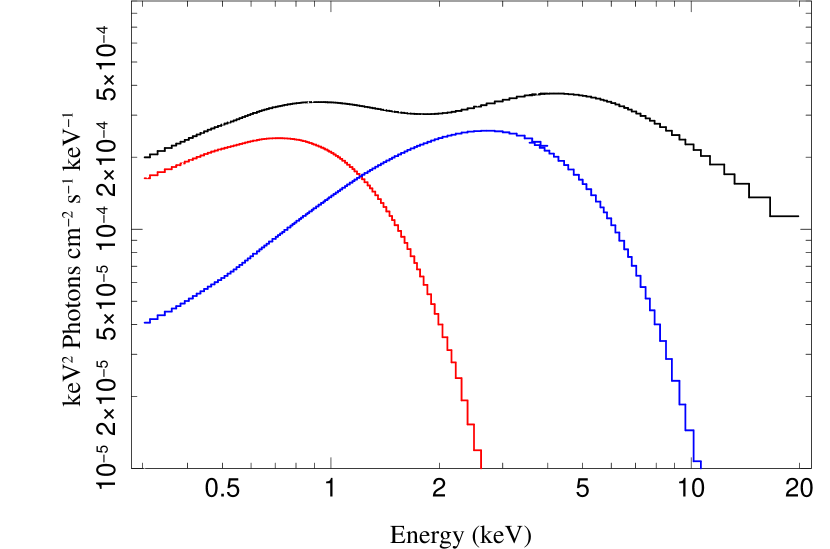
The blackbody disk component introduced in the latter three of our simple models considerably improves the low energy excess below . Adding the disk component to the powerlaw model provides an improvement of for 2 extra d.o.f., but the residuals for this model still show a downturn at high energies, so we also consider models including a disk component and a powerlaw with an exponential cutoff, and a broken power law. Both exponential cutoff and broken power laws provide a statistically good fit with (770/738 and 771/737, respectively). The model including a blackbody disk and a broken powerlaw is perhaps a slightly better fit, with the data distributed more evenly about the model at high energies, although we cannot conclusively reject the cutoff powerlaw. The fits obtained with these two-component models are compared in Figure 3.
| Parameter | Unit | XMM-Newton | XMM + NuSTAR |
|---|---|---|---|
| tbnewpowerlaw | |||
| /d.o.f. | 716/612 | 1030/741 | |
| tbnewcutoffpl | |||
| keV | |||
| /d.o.f. | 716/611 | 923/740 | |
| tbnewdiskpbb | |||
| keV | |||
| /d.o.f. | 705/611 | 890/740 | |
| tbnew(diskbb+powerlaw) | |||
| keV | |||
| /d.o.f. | 663/610 | 1018/739 | |
| tbnew(diskbb+cutoffpl) | |||
| keV | |||
| keV | |||
| /d.o.f. | 633/609 | 770/738 | |
| tbnew(diskbb+bknpower) | |||
| keV | |||
| keV | |||
| /d.o.f. | 633/608 | 771/737 | |
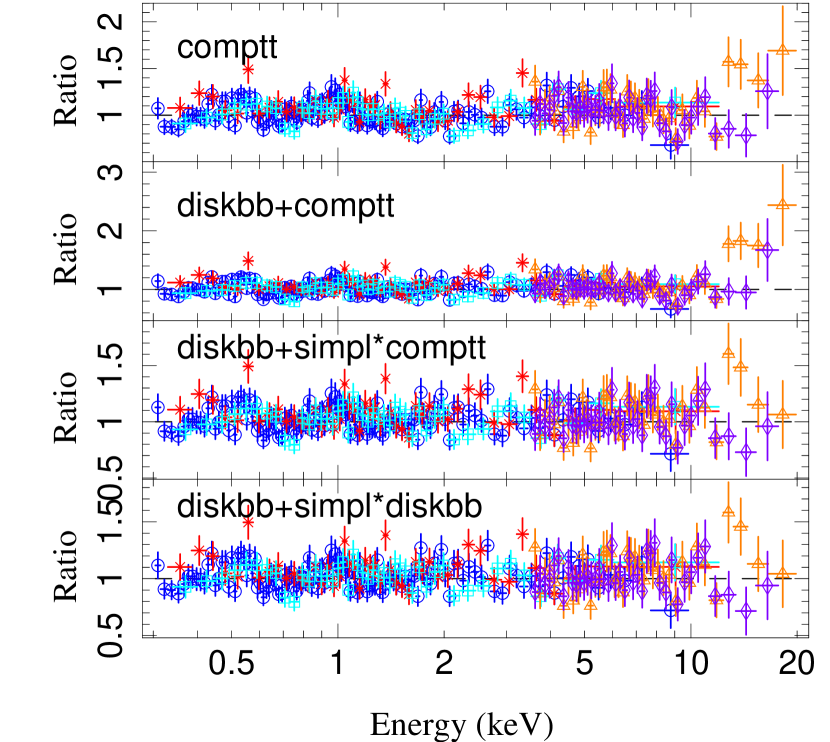
To explore more physical models, we investigate the possibility that the continuum is from cool, thin disk photons Compton up-scattered in a hot corona. We model this component using the comptt model (Titarchuk, 1994). comptt is an analytic Comptonization model that assumes the seed photon spectrum follows a Wien law with some temperature . Its use allows the temperature and the optical depth of the Comptonizing electrons to be fit as independent parameters. This model is frequently combined with a blackbody disk to represent a standard disk–corona accretion geometry, with the Compton seed photon temperature linked to the inner disk temperature. Although we also present fits with the comptt model alone for completeness, we note that formally this describes a very extreme scenario in which essentially the entire X-ray emitting accretion disk is enshrouded by the corona, which is likely unphysical.
The fit with the comptt model provides a reasonable statistical fit with (824/739), but the “m”-shaped residuals seen previously are again apparent below 10 keV. Including a blackbody disk component gives a formally acceptable fit of (787/738), an improvement of for one additional d.o.f., but evidence for an excess in the data over the model remains at high energies (see Figure 4 panel 2). This is also seen with similar models in other NuSTAR ULX observations (e.g. Walton et al. 2013b, 2014, 2015b). We address this excess with the addition of a powerlaw tail using the simpl convolution model (Steiner et al., 2009). This powerlaw tail gives a fit improvement of with two additional d.o.f. over the diskbb+comptt model, providing a statistically good fit with (765/736) and resolving the high-energy excess seen previously. In all of these models, the comptt component is cool and optically thick, resulting in a quasi-thermal blackbody-like spectrum. We note that the assumption of linking the Compton seed photon temperature to that of the observed disk emission may not be valid in the case of a central optically thick corona that obscures the inner disk (e.g. Gladstone et al. 2009). However, we are unable to constrain these quantities independently if they are allowed to vary separately, and the fit remains unchanged, so we keep them linked for convenience. Replacing comptt with a second diskbb component in this final model results in an equally good fit with (766/737). Both models are illustrated in the bottom panels of Figure 4. A full list of best-fit parameters for these models is presented in Table 4.
| Parameter | Unit | XMM-Newton | XMM + NuSTAR |
|---|---|---|---|
| tbnewcomptt | |||
| keV | |||
| keV bbUpper confidence bound at hard limit of for XMM-Newton data | |||
| /d.o.f. | 680/610 | 824/739 | |
| tbnew(diskbb+comptt)aaThe Comptonization input photon temperature has been set to the inner disk temperature. | |||
| keV | |||
| keV | |||
| /d.o.f. | 633/609 | 787/738 | |
| tbnew(diskbb+simpl*comptt)aaThe Comptonization input photon temperature has been set to the inner disk temperature. | |||
| keV | |||
| keV | |||
| ccLower confidence bound at hard limit of | |||
| ddUpper confidence bound at hard limit of | |||
| /d.o.f. | 765/736 | ||
| tbnew(diskbb+simpl*diskbb) | |||
| keV | |||
| keV | |||
| ddUpper confidence bound at hard limit of | |||
| /d.o.f. | 766/737 | ||
4. Discussion and Conclusions
We have presented an analysis of the two coordinated NuSTAR and XMM-Newton observations of the ULX NGC 5204 X-1 performed in 2013. The contribution of the NuSTAR data has allowed us to produce the first broadband spectrum of this source extending above 10 keV. While NGC 5204 X-1 is a source known previously to display aperiodic spectral variability on a time-scales of several days (e.g. Roberts et al. 2006), we found low variability between the two observing epochs, separated by 10 days, and therefore combined them to maximize count statistics for our spectral analysis.
Prior work on NGC 5204 X-1 using data from XMM-Newton suggested that it may be an IMBH of a few hundred solar masses, described by a cool blackbody disk ( keV) and a hard powerlaw tail (; Feng & Kaaret 2009). Statistical evidence for curvature in the 2–10 keV bandpass has been seen in some previous observations (e.g. Stobbart et al. 2006), which has generally been used to argue in favor of the high/super-Eddington interpretation, but not others (e.g. Gladstone et al. 2009). However, the limited bandpass of XMM-Newton meant even when this curvature was detected, it was not clear whether this represented a true spectral cutoff (e.g. Caballero-García & Fabian 2010; Walton et al. 2011). Indeed, the limitations of a narrow bandpass are highlighted by the results presented here, comparing the model fits to just the XMM-Newton data to those to the combined NuSTAR and XMM-Newton dataset. Far more models provide an acceptable fit to the XMM-Newton data alone than to the broadband spectrum.
The NuSTAR data presented here robustly demonstrate that the spectrum of NGC 5204 X-1 displays significant curvature above 3 keV, and is not powerlaw-like. This is similar to the results obtained in other NuSTAR ULX observations (e.g. Bachetti et al. 2013; Rana et al. 2015; Walton et al. 2013b, 2014, 2015a, 2015b). Flux calculations further demonstrate that the proportion contribution of the hard X-ray emission from NGC 5204 X-1 is relatively small, with only 10% of the 0.3–20.0 keV flux emitted above 10 keV (see Table 5). The 5–6 keV break argues against the presence of a IMBH accreting in the “low/hard state”, assuming such black holes would display similar accretion states to Galactic binaries, which would be expected appear powerlaw-like in the observed bandpass (Remillard & McClintock, 2006). Using the best fit diskbb+simpl*comptt model, we calculate the observed luminosity to be erg s-1, (see Table 5); the flux below keV during this epoch is similar to that observed previously (Roberts et al., 2004). We conclude that NGC 5204 X-1 is therefore likely a high-Eddington accretor with a more modest black hole mass.
| Flux () | Luminosity ()aaObserved luminosities (i.e. without any correction for neutral absorption applied) calculated for a distance of Mpc (Roberts & Warwick, 2000), using the diskbb+simpl*diskbb model | |
|---|---|---|
| keV | ||
| keV | ||
| keV |
The broadband spectrum in this case is best fit by a three-component model, with two quasi-thermal components and a weak powerlaw-like excess at high energies (Figure 5). We model the first component using a cool, Shakura & Sunyaev (1973) thin disk ( keV). The hotter components can be modelled as a cool, optically thick Comptonization model ( keV; ), dramatically different from the hot, optically thin coronae observed from sub-Eddington black holes (e.g, Gierliński et al. 1999; Miller et al. 2013b; Tomsick et al. 2014; Natalucci et al. 2014; Brenneman et al. 2014), or a second multicolor blackbody disk ( keV). Although poorly constrained, in both cases the best-fit photon index of the high-energy powerlaw tail is steep (), similar to the value of the photon index obsesrved in the steep power law state (; Remillard & McClintock 2006). In XSPEC syntax, the spectrum is best described by an absorbed diskbb+simpl*comptt or diskbb+simpl*diskbb model.
In the context of high/super-Eddington accretion, a number of physical scenarios have been proposed for the emission components observed from ULXs below 10 keV. One such model invokes an optically thick Comptonizing corona that produces the 3–10 keV continuum and obscures the inner portion of the accretion disk, allowing a cool disk temperature to be observed without requiring an IMBH (Gladstone et al., 2009). Our NuSTAR observations likely do not favor this physical interpretation, as this model in turn seems to require a further Comptonizing region to explain the spectrum above 10 keV, which appears to have some similarity with the optically-thin Comptonization traditionally observed from Galactic binaries at high luminosities, calling into question the initial interpretation of the 3–10 keV continuum as the corona. Furthermore, we note that Miller et al. (2014) argue that the parameters typically obtained with comptt fits to ULXs would imply very large size-scales for these coronae, and that it is difficult to envision a physical scenario that would result in such a large, uniformly heated region.
Alternately, Middleton et al. (2011) have argued that the cool “disk” component could actually arise in a wind from a super-Eddington accretion disk, and that the hotter quasi-thermal model represents the spectrum of the inner disk itself. While we still lack unambiguous evidence of such winds through absorption lines Walton et al. (2012, 2013a), this could be an effect of our viewing angle which may not intercept the winds if the they have a roughly equatorial geometry (e.g. Middleton et al. 2015). In addition, Dexter & Quataert (2012) have recently suggested that black hole binary accretion disks may exhibit significant inhomogeneities, resulting in the simultaneous presence of hot and cool regions within the same disk, and by extension an unusual disk spectrum. Such “patchy” disk scenarios could arise as a natural signature of photon-bubble instabilities (Gammie, 1998) proposed to transport flux in a super-Eddington disk (Miller et al., 2014). Although there are differences in the detailed physics, both these models associate the hotter thermal component with emission from the accretion disk, and the highest energy emission with optically thin Comptonization, and are consistent with our broadband observations. With current data, it is difficult to unambiguously associate model components with precise physical processes, particularly with regard to the soft thermal component; we cannot currently distinguish between a disk or a wind origin here. Performing broadband X-ray observations of NGC 5204 X-1 at different flux levels to probe spectral variability and examine how the different components evolve may be the key to distinguishing between these different models.
ACKNOWLEDGEMENTS
The authors would like to thank the referee for their useful feedback which helped improve the final manuscript. This research has made use of data obtained with the NuSTAR mission, a project led by the California Institute of Technology (Caltech), managed by the Jet Propulsion Laboratory (JPL) and funded by NASA, and with XMM-Newton, an ESA science mission with instruments and contributions directly funded by ESA Member States and NASA. We thank the NuSTAR Operations, Software and Calibration teams for support with the execution and analysis of these observations. This research has made use of the NuSTAR Data Analysis Software (NUSTARDAS), jointly developed by the ASI Science Data Center (ASDC, Italy) and Caltech (USA).
References
- Abramowicz et al. (1988) Abramowicz, M. A., Czerny, B., Lasota, J. P., & Szuszkiewicz, E. 1988, ApJ, 332, 646
- Arnaud (1996) Arnaud, K. A. 1996, in Astronomical Society of the Pacific Conference Series, Vol. 101, Astronomical Data Analysis Software and Systems V, ed. G. H. Jacoby & J. Barnes, 17
- Bachetti et al. (2013) Bachetti, M., Rana, V., Walton, D. J., et al. 2013, ApJ, 778, 163
- Bachetti et al. (2014) Bachetti, M., Harrison, F. A., Walton, D. J., et al. 2014, Nature, 514, 202
- Belczynski et al. (2010) Belczynski, K., Bulik, T., Fryer, C. L., et al. 2010, ApJ, 714, 1217
- Brenneman et al. (2014) Brenneman, L. W., Madejski, G., Fuerst, F., et al. 2014, ApJ, 781, 83
- Caballero-García & Fabian (2010) Caballero-García, M. D., & Fabian, A. C. 2010, MNRAS, 402, 2559
- Dexter & Quataert (2012) Dexter, J., & Quataert, E. 2012, MNRAS, 426, L71
- Feng & Kaaret (2009) Feng, H., & Kaaret, P. 2009, ApJ, 696, 1712
- Feng & Soria (2011) Feng, H., & Soria, R. 2011, NAR, 55, 166
- Gammie (1998) Gammie, C. F. 1998, MNRAS, 297, 929
- Gierliński et al. (1999) Gierliński, M., Zdziarski, A. A., Poutanen, J., et al. 1999, MNRAS, 309, 496
- Gladstone et al. (2009) Gladstone, J. C., Roberts, T. P., & Done, C. 2009, MNRAS, 397, 1836
- Gladstone et al. (2011) —. 2011, Astronomische Nachrichten, 332, 345
- Gonçalves & Soria (2006) Gonçalves, A. C., & Soria, R. 2006, MNRAS, 371, 673
- Harrison et al. (2013) Harrison, F. A., Craig, W. W., Christensen, F. E., et al. 2013, ApJ, 770, 103
- Houck & Denicola (2000) Houck, J. C., & Denicola, L. A. 2000, in Astronomical Society of the Pacific Conference Series, Vol. 216, Astronomical Data Analysis Software and Systems IX, ed. N. Manset, C. Veillet, & D. Crabtree, 591
- Kajava & Poutanen (2009) Kajava, J. J. E., & Poutanen, J. 2009, MNRAS, 398, 1450
- Kalberla et al. (2005) Kalberla, P. M. W., Burton, W. B., Hartmann, D., et al. 2005, A&A, 440, 775
- King (2009) King, A. R. 2009, MNRAS, 393, L41
- Madsen et al. (2015) Madsen, K. K., Harrison, F. A., Markwardt, C., et al. 2015, ArXiv e-prints, arXiv:1504.01672
- Middleton et al. (2015) Middleton, M. J., Heil, L., Pintore, F., Walton, D. J., & Roberts, T. P. 2015, MNRAS, 447, 3243
- Middleton et al. (2011) Middleton, M. J., Roberts, T. P., Done, C., & Jackson, F. E. 2011, MNRAS, 411, 644
- Miller et al. (2014) Miller, J. M., Bachetti, M., Barret, D., et al. 2014, ApJ, 785, L7
- Miller et al. (2013a) Miller, J. M., Walton, D. J., King, A. L., et al. 2013a, ApJ, 776, L36
- Miller et al. (2004) Miller, J. M., Raymond, J., Fabian, A. C., et al. 2004, ApJ, 601, 450
- Miller et al. (2013b) Miller, J. M., Parker, M. L., Fuerst, F., et al. 2013b, ApJ, 775, L45
- Mineshige et al. (1994) Mineshige, S., Hirano, A., Kitamoto, S., Yamada, T. T., & Fukue, J. 1994, ApJ, 426, 308
- Mitsuda et al. (1984) Mitsuda, K., Inoue, H., Koyama, K., et al. 1984, PASJ, 36, 741
- Natalucci et al. (2014) Natalucci, L., Tomsick, J. A., Bazzano, A., et al. 2014, ApJ, 780, 63
- Poutanen et al. (2007) Poutanen, J., Lipunova, G., Fabrika, S., Butkevich, A. G., & Abolmasov, P. 2007, MNRAS, 377, 1187
- Rana et al. (2015) Rana, V., Harrison, F. A., Bachetti, M., et al. 2015, ApJ, 799, 121
- Remillard & McClintock (2006) Remillard, R. A., & McClintock, J. E. 2006, ARA&A, 44, 49
- Roberts (2007) Roberts, T. P. 2007, Ap&SS, 311, 203
- Roberts et al. (2006) Roberts, T. P., Kilgard, R. E., Warwick, R. S., Goad, M. R., & Ward, M. J. 2006, MNRAS, 371, 1877
- Roberts & Warwick (2000) Roberts, T. P., & Warwick, R. S. 2000, MNRAS, 315, 98
- Roberts et al. (2004) Roberts, T. P., Warwick, R. S., Ward, M. J., & Goad, M. R. 2004, MNRAS, 349, 1193
- Roberts et al. (2005) Roberts, T. P., Warwick, R. S., Ward, M. J., Goad, M. R., & Jenkins, L. P. 2005, MNRAS, 357, 1363
- Shakura & Sunyaev (1973) Shakura, N. I., & Sunyaev, R. A. 1973, A&A, 24, 337
- Steiner et al. (2009) Steiner, J. F., Narayan, R., McClintock, J. E., & Ebisawa, K. 2009, PASP, 121, 1279
- Stobbart et al. (2006) Stobbart, A.-M., Roberts, T. P., & Wilms, J. 2006, MNRAS, 368, 397
- Titarchuk (1994) Titarchuk, L. 1994, ApJ, 434, 570
- Tomsick et al. (2014) Tomsick, J. A., Nowak, M. A., Parker, M., et al. 2014, ApJ, 780, 78
- Verner et al. (1996) Verner, D. A., Ferland, G. J., Korista, K. T., & Yakovlev, D. G. 1996, ApJ, 465, 487
- Vierdayanti et al. (2006) Vierdayanti, K., Mineshige, S., Ebisawa, K., & Kawaguchi, T. 2006, PASJ, 58, 915
- Walton et al. (2011) Walton, D. J., Gladstone, J. C., Roberts, T. P., et al. 2011, MNRAS, 414, 1011
- Walton et al. (2013a) Walton, D. J., Miller, J. M., Harrison, F. A., et al. 2013a, ApJ, 773, L9
- Walton et al. (2012) Walton, D. J., Miller, J. M., Reis, R. C., & Fabian, A. C. 2012, MNRAS, 426, 473
- Walton et al. (2013b) Walton, D. J., Fuerst, F., Harrison, F., et al. 2013b, ApJ, 779, 148
- Walton et al. (2014) Walton, D. J., Harrison, F. A., Grefenstette, B. W., et al. 2014, ApJ, 793, 21
- Walton et al. (2015a) Walton, D. J., Harrison, F. A., Bachetti, M., et al. 2015a, ApJ, 799, 122
- Walton et al. (2015b) Walton, D. J., Middleton, M. J., Rana, V., et al. 2015b, ApJ, 806, 65
- Wilms et al. (2000) Wilms, J., Allen, A., & McCray, R. 2000, ApJ, 542, 914
- Zampieri & Roberts (2009) Zampieri, L., & Roberts, T. P. 2009, MNRAS, 400, 677