DFT calculations of magnetic anisotropy energy of Ge1-xMnxTe ferromagnetic semiconductor
Abstract
Density functional theory (DFT) calculations of the energy of magnetic anisotropy for diluted ferromagnetic semiconductor Ge1-xMnxTe were performed using OpenMX package with fully relativistic pseudopotentials. The influence of hole concentration and magnetic ion neighbourhood on magnetic anisotropy energy is presented. Analysis of microscopic mechanism of magnetic anisotropy is provided, in particular the role of spin-orbit coupling, spin polarization and spatial changes of electron density are discussed. The calculations are in accordance with the experimental observation of perpendicular magnetic anisotropy in rhombohedral Ge1-xMnxTe (111) thin layers.
pacs:
75.30.Gw, 71.15.Mb-
February 2015
1 Introduction
Microscopic understanding of anisotropic properties of any ferromagnet constitutes a very challenging theoretical task and is very important from the point of view of possible applications. Particularly, in the case of ferromagnetic semiconductors, a deep understanding of the mechanisms responsible for the behavior of magnetization becomes crucial because a number of semiconductor properties may be changed by external factors. It was established that direction of the easy axis of magnetization can be changed by changing the density of free carriers or by applying a strain. The carrier concentration can be varied by applying gate voltage to the layer, and strain in a film can be imposed by cementing it to a piezoelectric actuator. These and other related phenomena are described in a recent review [1].
Previous theoretical descriptions of magnetic anisotropy
in semiconductors
were based either on the mean-field Zener model,
or on the concept of single ion anisotropy.
The Zener model was applied to III-V and II-VI diluted ferromagnetic
semiconductors [2, 3].
In this approach, it is assumed that
the nonzero macroscopic magnetization of magnetic ions leads, via
exchange interaction, to the spin splitting of band states.
Because of the presence of spin-orbit (S-O) interaction,
the band structure, and thus the energy of carriers populating band
states, depend on the direction of magnetization.
In this model the magnetic anisotropy is due to
the simultaneous presence of two factors, i.e. the finite
concentration of free carriers, and the non-vanishing S-O coupling
in the host crystal.
For insulating crystals, or for the vanishing band S-O
interaction, a vanishing magnetic anisotropy is predicted.
(Note that the limit of isolated impurities is beyond the scope
of the model.)
The Zener model explained, at least semiquantitavely, a number of
experiments [2, 4, 5, 6].
The second approach is based on the concept of single ion
anisotropy.
The anisotropic properties of a macroscopic crystal are
brought about by anisotropic magnetic properties of magnetic
or ions subject to ligand electric fields of
the crystal environment.
In II-VI and IV-VI semiconductors, the Mn2+ ions
in the crystal retain to some extend their atomic-like character.
In the absence of the S-O coupling,
according to the Hund’s rule five electrons on
shell form an orbital singlet with the total angular momentum .
This system does not interact with the crystal field,
and the ground state of the ion is sixfold degenerate since the total spin
.
Actually, however, the Hund’s rule is an approximation only,
because due to relativistic S-O effects there is a coupling between
and the excited states of configuration.
Consequently, the ground state is no longer a pure state, and the coupling
of Mn with its crystal surrounding becomes possible.
This leads to the ground state splitting, and Mn can be described by the
matrix of the effective spin hamiltonian [7].
For example, the spin hamiltonian of Mn2+ in a cubic environment
is proportional to .
This effect is experimentally observed as a fine structure splitting of the
electron paramagnetic resonance (EPR) spectra [7].
During the last five decades various calculations of this effect were presented,
see for example Refs. [8, 9, 10, 11].
However, in these works the virtual, excited states taken into account in the
perturbation treatment had the same number of electrons on orbitals as the
ground state, i.e., five.
This constraint was lifted in another approach to the single ion anisotropy proposed in Ref. [12]. In this work, the system consisted of the Mn2+ ion and band carriers, and in the perturbation calculations of the effective spin hamiltonian the number of electrons on the excited states could be different than five. In other words, the virtual transfer of electrons between the shell and band states was allowed. This idea was previously widely used in the calculations of kinetic exchange integral in semiconductors [13, 14], or in the calculations of exchange coupling between magnetic ions [15].
Within this approach it was possible to study the influence of both carrier concentration and alloy disorder on the ground state splitting. The method succesfully explained the EPR measurements of Mn ion in strained PbTe layers [12], the single ion magnetic anisotropy in Pb1-x-ySnxMnyTe mixed crystals [16], the magnetic specific heat in Pb1-xMnxTe [17], as well as that of PbTe doped with Eu2+ and Gd3+ [18].
In the above theories of single ion magnetic anisotropy the manganese spin is treated as a quantum mechanical object. In particular, the nonvanishing S-O coupling for electrons is necessary to produce a nonzero ground state splitting, or single ion anisotropy of Mn. The band S-O coupling is of minor importance in the sense that even for the zero band S-O interaction we get the splitting, although much smaller than in the case of the actual S-O coupling. On the other hand, it is also possible to propose a model of single ion anisotropy [19] in which the manganese spin, like in the Zener model, is treated as a classical Heisenberg vector interacting with band carriers via interaction, but of course, in this case the nonzero band S-O coupling is necessary. In this model, a strong dependence of magnetic anisotropy constants on the concentration of free holes was predicted and qualitatively confirmed experimentally [20] in Sn1-xMnxTe.
In the present paper we study magnetic anisotropy in Ge1-xMnxTe ferromagnetic semiconductor by first principle calculations. A natural question arises what, concerning the magnetic anisotropy, significantly new information may be obtained applying this method? Certainly, using DFT calculations it is not possible to obtain directly the ground state splitting or the effective spin hamiltonian for the Mn ion. This is not related to the accuracy problem or the limitations in computational resources but to the fact that DFT calculations determine the charge density in the ground state of the system. On the other hand, as it is shown below, this approach allows to investigate microscopic mechanisms responsible for the anisotropy, in particular the role of S-O coupling, of the range of spin polarization of atoms surrounding the magnetic ion, and of the influence of crystal disorder. Although we concentrate exclusively on Ge1-xMnxTe we think that the general conclusions may be useful for other ferromagnetic semiconductors.
GeTe is a nonmagnetic narrow gap IV-VI semiconductor, which
has rhombohedral crystal symmetry with the angle characterizing
the unit cell at room temperature.
In addition, the Ge and Te sublattices
are displaced relative to each other along the [111] direction
by a vector , where the lattice constant
Å and [22, 23]; this displacement causes GeTe to be
a unique ferroelectric.
These features also characterize magnetic Ge1-xMnxTe mixed crystals
for moderate manganese contents .
In IV-VI semiconductors, Mn ions are incorporated as Mn2+
with the electron configuration. They introduce
local magnetic moments [24] and remain
electrically neutral.
Ge1-xMnxTe diluted magnetic semiconductor
exhibits ferromagnetic transition with the Curie
temperature up to 190 K [25, 26].
In these mixed crystals ferromagnetism is induced by quasi-free carriers.
The simultaneous presence of ferromagnetic and
ferroelectric order (multiferroicity) makes this compound very interesting for
possible applications,
in particular as a magnetic phase-change material, or a
spintronic system with electrical polarization controlled spin
splittings of band states [27].
Recently, magnetization and ferromagnetic resonance (FMR) measurements were performed on both monocrystalline layers of Ge1-xMnxTe grown on the BaF2 (111) substrate and on polycrystalline, layered Ge0.9Mn0.1Te microstructures [23, 26, 28, 29, 30]. The experiments probed magnetic anisotropy energy (MAE) in the ferromagnetic state. One of the striking results is that in monocrystalline layers with the manganese content of the order of 10 at. %, the easy axis of magnetization is oriented along the [111] crystallographic direction perpendicular to the layer, while the usual in-plane easy axis due to dipolar interactions (shape anisotropy) is observed in polycrystalline microstructures and is partially recovered in strained monocrystalline Ge1-xMnxTe layers upon annealing. In the layers with the Mn content higher than 20 at. %, for which the X-ray diffraction studies reveal the cubic (rock-salt) structure, the usual in-plane easy axis is observed.
Motivated by the experimental results we study microscopic mechanisms of magnetic anisotropy and the decisive factors that determine MAE. We mainly report the results obtained for rhombohedral crystals characterized by Å, and , and low Mn concentrations. Most of the calculations were performed for supercells containing 64 atoms with one Ge replaced by Mn atom, which corresponds to approximately in Ge1-xMnxTe mixed crystal. For comparison, we present also some results for the 216 atoms supercell containing one Mn atom, which corresponds to . These Mn concentrations are much smaller than those in the samples studied experimentally, and this is the first reason why a quantitative comparison with experiment is not possible. The second reason is also important: preliminary calculations clearly indicated that MAE strongly depends on the microscopic disorder present in an alloy. This disorder is inevitable in mixed crystals due to both the different ionic radii of ions constituting the crystal, and to the random occupation of lattice sites. Consequently, in an actual crystal each Mn ion is in a different surrounding. In general, these surroundings have no symmetry, what leads to different directions of the easy axis of magnetization for different Mn ions. Below, an example of the dependence of MAE on the nearest neighbourhood of Mn ion is given. However, a detailed analysis of influence of the microscopic disorder is beyond the scope of the paper. That is why geometry optimization of the supercells typically was neglected.
The paper is organized as follows. After presenting the technical details of calculations in Section II, in Section III we analyze the dependence of MAE on the concentration of free holes and on the manganese ion’s neighbourhood. Section IV contains analysis of various factors that determine MAE. We discuss the role of spin-orbit coupling, of spin polarization of free carriers in the supercell, and of the changes of the electron density caused by the changes of manganese spin’s direction. Section V summarizes the paper. A few preliminary results were presented in a short conference communication [31].
2 Technical details of calculations
The calculations were performed with the open-source OpenMX package [32] with fully relativistic pseudopotentials. The Local Density Approximation together with the Ceperly-Alder [33] exchange-correlation functional was used. The inclusion of spin-orbit interaction is crucial for calculation of energy of magnetic anisotropy, which disappears when the spin-orbit interaction is omitted.
2.1 Pseudopotentials
The pseudopotentials distributed with OpenMX are generated assuming 16 valence electrons for Te. Because of the very high accuracy demanded by the studied problem, large sizes of supercells and very high density of grids in the k-space, it was necessary to use pseudopotentials with lower numbers of valence electrons. These were generated with the program ADPACK, contained in the OpenMX package. We generated fully relativistic pseudopotential with the configuration, , with 6 valence electrons, for Te, and with the configuration for Ge. The pseudopotentials were calculated using Troullier-Martins [34] algorithm with Kleinmann-Bylander factorization [35]. For Ge, the cutoff radii for () pseudopotentials were 1.80 (1.70) atomic units (a. u.). For Te, the cutoff radii were 2.40 (2.20) a. u. for () pseudopotentials. The radial cutoffs for pseudoatomic orbitals were 7.5 and 8.0 a. u. for Ge and Te, respectively. Furthermore, for Ge and Te we used the minimal wave functions basis, , in the notation explained in Refs. [36, 37], which means that in the wave function basis for Te and Ge atoms one and three orbitals (, and ) were included. The number of orbitals was doubled due to the inclusion of electron’s spin. These pseudopotentials and the basis set lead to equilibrium lattice parameters =6.0 Å, and , which are close to the experimental values. For comparison, the original pseudopotentials distributed with OpenMX package give =6.09 Å, and .
For Mn, we used the pseudopotential distributed with OpenMX with 15 valence electrons ( configuration), together with pseudoatomic basis . This choice increases the number of valence electrons, but since there is only one Mn atom in the supercell, the computational time is practically not affected.
Energy levels of atomic shells with are always split by the S-O
interaction. The energy difference between split levels, ,
where , is directly related to the S-O strength.
Usually, atomic pseudopotentials for are calculated
assuming that the values of these splittings are those for a real atom,
and such -dependent pseudopotentials are called fully relativistic.
On the other hand, by performing appropriate average [38]
over -dependent pseudopotentials, it is possible to obtain the so-called
scalar relativistic pseudopotentials for which .
For these two cases, and , the factor
describing in the following the S-O strength is and
, respectively.
OpenMX package offers the possibility to generate -dependent
pseudopotentials for arbitrary factors,
for which . This mimics
the variation of the S-O interaction strength for a given shell of an atom.
To study the influence of the S-O interaction on MAE, we generated
pseudopotentials for Ge and Te for a few values of , while
for Mn we always used the pseudopotential with ,
corresponding to the actual atomic S-O strength.
2.2 Constraints of the Mn spin direction
An important feature of OpenMX is the possibility to constrain directions of spin polarization for atoms. This is done by adding a properly constructed harmonic potential to the total energy functional. To introduce notation which is used below, we briefly sketch this construction [39]. In relativistic calculations the wave function is a two component spinor
| (1) |
and the electron density operator is a matrix
| (2) |
where is the occupation number. By projecting this matrix on orbitals of a given atom one obtains a matrix , which can be diagonalized by an unitary matrix dependent on two angles, and :
| (3) |
The angles and define both the direction of total spin
and the difference , which is the spin
polarization of a given atom.
To constrain spin of the atom to the direction
defined by angles and , the following term
is added to the total energy functional:
| (4) |
where
| (5) |
If after the selfconsistent procedure the spin direction is the same as the demanded one, the energy connected with this term is zero. Indeed, after calculations this energy was always negligible compared to other energies of the system, and the final angles and describing the spin directions were practically the same as those demanded provided the spin polarization of atoms was not negligible.
In most calculations, directional constraints were applied only to Mn. Analysis of the results shows that the spins of Ge atoms are parallel to the spin of Mn, and the directions of Te spins are opposite. Moreover, the calculated MAE does not depend significantly on whether the constraint was applied to the Mn spin only, or to all atoms in the supercell. We conclude therefore that the direction of Mn spin governs the directions of Ge and Te spins.
In all calculations, the Mn spin is rotated in (10) plane and the angle is measured in this plane from the [111] direction. Such a rotation corresponds to the situation frequently studied in electron ferromagnetic resonance experiments, when the external magnetic field rotates in this plane. Ge1-xMnxTe on BaF2 substrates grows along the [111] direction, thus and correspond to the Mn spin perpendicular and parallel to the plane of growth, i.e., oriented along the [111] and[11] crystallographic directions, respectively.
2.3 Other input parameters
The calculations were performed in part for nonzero densities of free holes , because actual Ge1-xMnxTe samples are -type due to very high concentrations of native defects (Ge vacancies). This additional positive charge was compensated by a uniform negative background. The hole concentrations assumed in calculations were in the interval cm-3. To speed up the convergence, particularly in the case of nonzero hole concentrations, the calculations were performed assuming the electron temperature 300 K.
The integrals in numerical calculations are approximated by sums over discrete sets of points. Thus, it is important to properly choose the grid for the system in the real and the reciprocal space to secure an optimal balance between the accuracy and the computational time. Convergent results are obtained for the length of the grid in real space approximately equal to 0.15 Å. Much more important is the number of integration points in the Brillouin zone giving convergent results, which, as it is discussed below, strongly depends on the concentration of holes.
2.4 Angular dependence of MAE
Group theory predicts a general dependence of MAE on the direction of magnetization. The knowledge of this dependence enables significant saving of computer time. For the crystal symmetry, the first nonvanishing terms in MAE are of the fourth order in magnetization, or in the total spin components , . When the symmetry is lowered to for rhombohedral Ge1-xMnxTe, the lowest order terms are proportional to and , and MAE can be written as
| (6) |
where is the angle between the direction of the Mn spin placed in (1-10) plane and the [111] crystallographic direction, and is the isotropic part chosen in such a way that .
In most cases, the rhombohedral angle and the displacement were assumed. For these parameters the first term in Eq. (6) dominates, and MAE may be written in the form
| (7) |
The remaining terms in Eq. (6) are important when the crystal structure is close to the perfect cubic, or when two or more Mn ions are placed in the supercell. The validity of the fitting formula, Eq. (7), is fully confirmed by the obtained numerical results. Moreover, the correctness of Eq. (7) for rhombohedral Ge1-xMnxTe is confirmed by ferromagnetic resonance measurements [23, 40], which also lead to the conclusion that the terms proportional to the fourth order in magnetization are very small.
3 Factors that determine MAE
3.1 Band structure of GeTe
We first discuss the impact of the crystal distortions on the band structure of pure GeTe. Figure 1 shows the band structure for four sets of structural parameters, namely (a) , , (b) , , (c) , , and (d) , . In the first case the crystal symmetry is , and it is lowered to for (b), and to for both (c) and (d).
When the symmetry is lower than , the and points in the Brillouin zone are nonequivalent. They are defined by and , respectively, where , , are the primitive vectors of the reciprocal lattice. Other points in the Brillouin zone of a rhombohedral lattice are defined in Ref. [41].
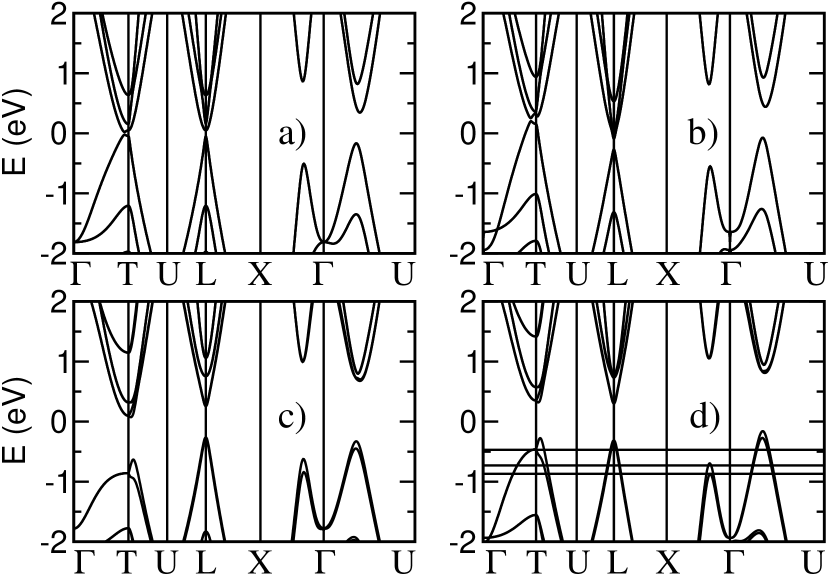
As it follows from Fig. 1, the impact of the rhombohedral distortion on the band structure is much weaker than that of the internal displacement of the Ge and Te sublattices, since the latter opens the band gap of about 0.5 eV at both and points. One can also observe that the decrease of the angle leads to the decrease of band energies in the vicinity of the point compared to those in the vicinity of , while the increase of parameter has the opposite effect.
The band structures shown in Fig. 1 are calculated for wavefunction basis s1p1. Qualitatively, the same results are obtained for enlarged bases s2p2 and s3p3.
It is known that the LDA calculations underestimate the energy gap. Due to this effect, GeTe in the structure is found to be semimetallic with zero energy gap. This is also the case when the rhombohedral distortion is accounted for but the internal displacement is neglected, Fig. 1. For the present work it is important that the system has a non-vanishing energy gap for the used crystal parameters, close to the experimental ones, and . This enables a comparison of magnetic anisotropy in insulating and conducting crystals, and an analysis of the role of free carriers. For hole concentrations of the order of 1021 cm-3, typical for Ge1-xMnxTe [23], the Fermi level lies deep in the valence band and the precise band structure in the vicinity of the band maximum is not important.
3.2 Dependence of MAE on the hole concentration
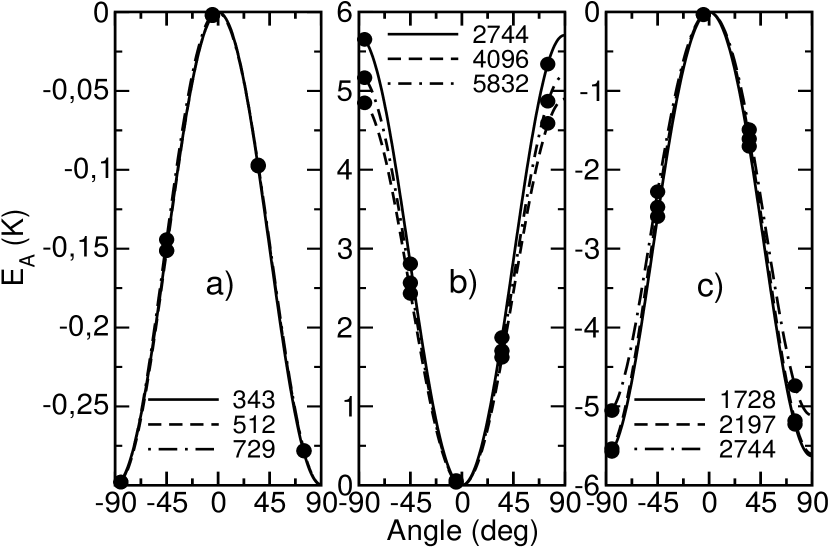
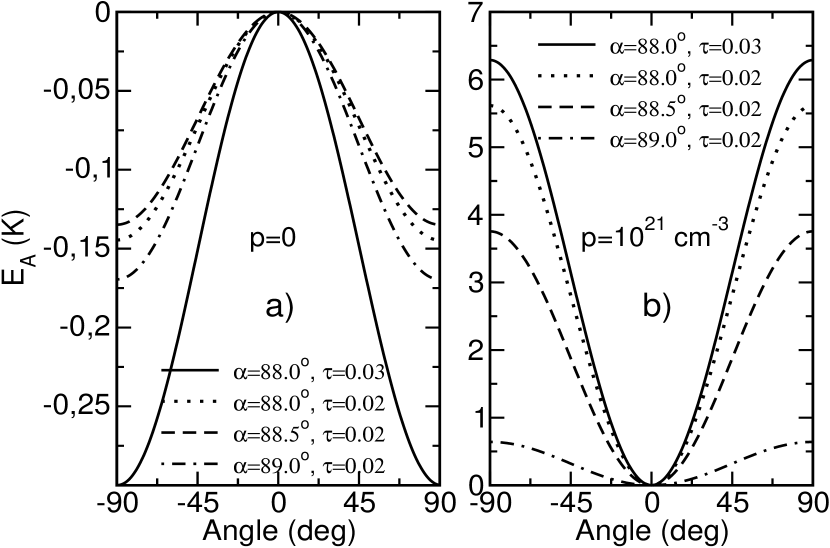
Figure 2 presents the angular dependence of MAE for the supercell containing one Mn ion for 3 hole concentrations. The calculated values are shown as points, and the curves are obtained by fitting the results according to Eq. (7), i.e., using one fitting parameter . In all cases, the angular dependencies of are symmetric relative to .
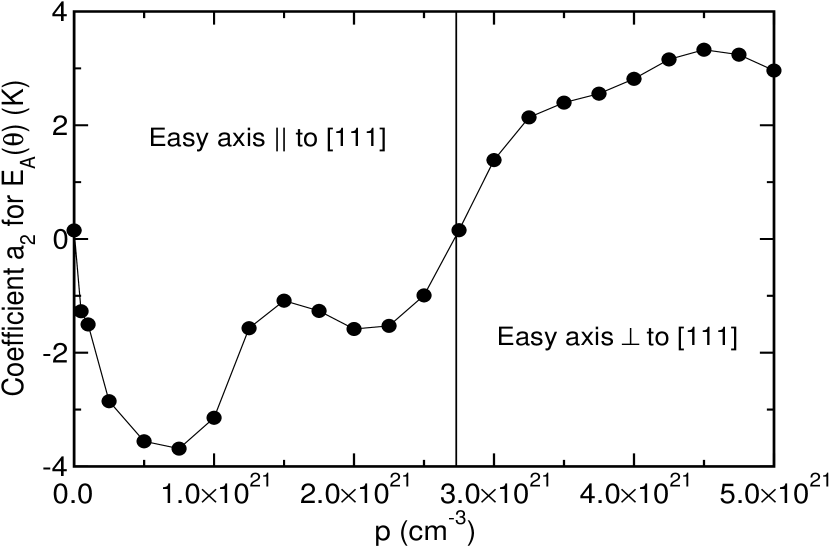
The values of the coefficient , calculated for several hole concentrations ranging from zero to cm-3, are summarized in Fig. 3. The obtained results show that both the absolute value of MAE and its sign depend on the concentration of free carriers. Indeed, the presence of free holes can enhance the magnitude of MAE by more than one order of magnitude compared to the insulating case. As discussed below, this is caused by a larger and more spatially extended spin polarization around Mn in metallic samples.
Regarding the sign of MAE, three ranges of hole concentrations can be distinguished. First, for vanishing or very small , the coefficient is positive, i.e., the equilibrium orientation of Mn spin is perpendicular to the [111] direction. Second, in the window cm-3 - cm-3, is negative. Finally, for higher , is positive again. Moreover, with the increasing hole concentration a non-monotonic behavior is observed.
The impact of free carriers on magnetic properties reflects pecularities of the band structure. Changes of the direction of easy axis caused by changes in carrier concentration were observed and analyzed for Ga1-xMnxAs [43, 44]. Similarly, in Sn1-xMnxTe, the cubic anisotropy constant depends on the hole concentration [20]. Another effect related to the changes in carrier concentration was observed in Pb1-x-ySnxMnyTe diluted magnetic semiconductor, in which the Curie temperature depends non-monotonically on the hole concentration [45]. The effect was explained by significant modifications of the RKKY interaction caused by the two-band structure ( and bands) of the valence band [46]. The multiband structure of the valence band is characteristic for IV-VI compounds, and it is absent in Ga1-xMnxAs. In the case under consideration, the number of valence bands occupied with holes depends on the Fermi energy, . In Fig. 1d we show the Fermi level position for three hole concentrations. For the highest concentrations, as much as four bands are occupied (at , , and those on both - and - directions). Each of those bands has an its own characteristic orbital composition, strength of the S-O coupling, -factor, and coupling with Mn. For this reason, the non-monotonic dependence of MAE on the hole concentrations, shown in Fig. 3, can be related to progressive occupation of consecutive valence bands.
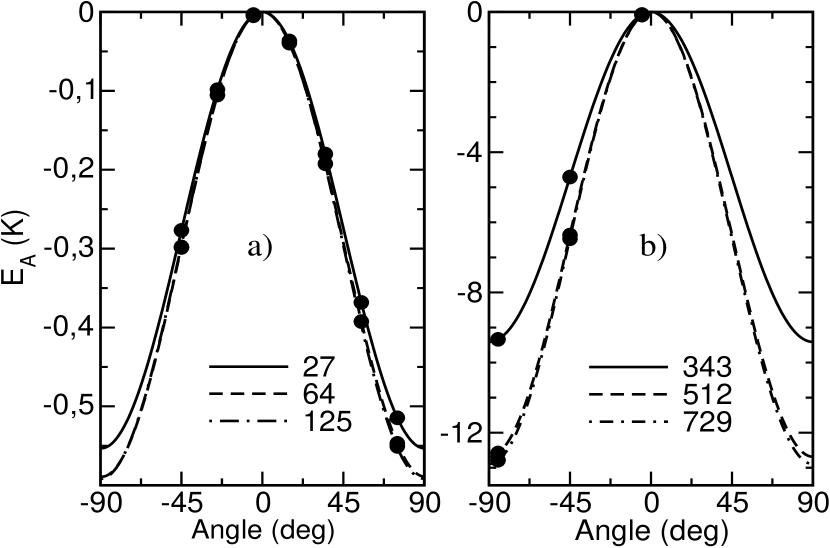
Figure 4 presents the results of calculations for the supercell containing one Mn ion for both the insulating and the metallic crystal with cm-3. As it follows from the figure, the directions of easy axes are the same as for the supercell. However, the magnitude of is about twice higher for the supercell in both insulating and metallic cases. These results show that the Mn ions in the supercell cannot be treated as isolated, even in the insulating crystal.
Finally, also shown in Figs. 2 and 4 is the convergence with respect to the number of integration points (NIPs) in the Brillouin zone. The convergence is easier to achieve for the insulating system than for the metallic one. In the former case, the obtained dependencies are practically the same for three consecutive NIPs, , and . When the hole concentration is finite, the convergence is much slower. Unfortunately, due to limitations in computational resources we could not perform calculations for NIP greater than for the supercell for all the considered cases. However, for one selected concentration cm-3, NIP was increased to 163=4096 and 183=5832, and the results shown in Fig. 2b confirm that a satisfactory accuracy of about 5 per cent was achieved.
The increase of the supercell size leads to the so-called folding
of the Brillouin zone. Due to the folding,
the grid spacing obtained with NIP= used for
the supercell is the same as
NIP= used for the supercell, and both
correspond to the grid generated with NIP= for
the simple cubic unit cell.
From Figs 2 and 4 it follows that
the accuracy of the coefficient calculated for metallic
systems is about ten per cent, and less than one per cent
for insulating systems.
3.3 Dependence of MAE on the macroscopic structural parameters and
Figure 5 shows the angular dependence of MAE on crystal structure parameters and for two concentrations, and cm-3. The impact of the lattice parameters is qualitatively different in the insulating and conducting crystal. The change in the internal displacement from to (continuous and dotted lines in Fig. 5, respectively) results in significant change of the amplitude of MAE in the insulating case, while in the conducting case it is less important. On the other hand, changes in the rhombohedral angle , which are not very important in the insulating crystal, produce much bigger effect in the conducting case. Similar differences are discussed in the next subsection, they are related to the fact that the spatial region around the Mn ion contributing to MAE is more localized in the insulating case.
Let us also remind that Ge1-xMnxTe containing more than 20 at. % of manganese is not rhombohedral but cubic, and the easy axis of magnetization lies in plane of the layer (i.e., it is perpendicular to the [111] direction). Although our calculations were performed for much lower manganese concentration and quantitative conclusions cannot be drawn, the direction of changes in MAE values is in accordance with experiment.
3.4 Dependence of MAE on the geometry of the Mn surrounding
In the metallic cases, the calculated amplitude of MAE is at least an order of magnitude larger than that observed in experiment. However, one should keep in mind that the calculations were done for supercells which represent a perfect translationally invariant infinite lattice. As it was mentioned in the Introduction, in real mixed crystals there is always a microscopic disorder, as a result of which each Mn ion is in a different surrounding. Moreover, the experimental Mn concentrations are an order of magnitude higher than those considered here, and thus the Mn-Mn coupling must be taken into account.
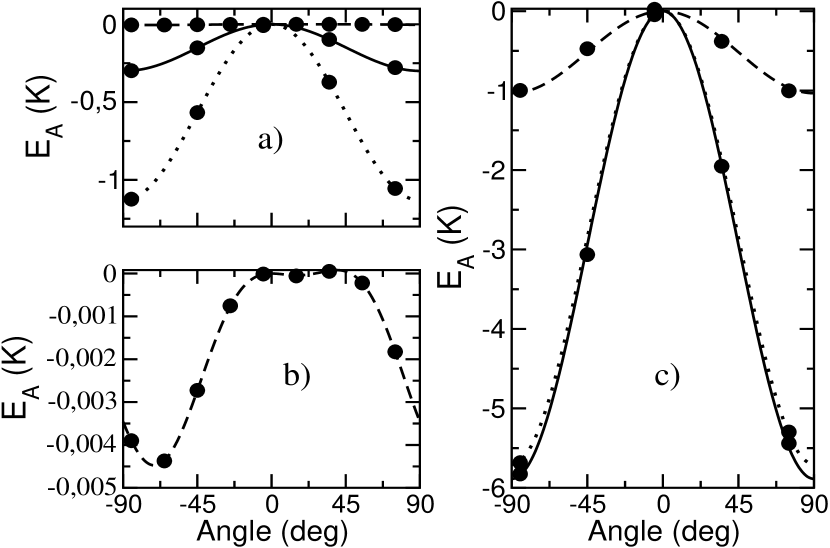
Figure 6 shows the angular dependence of MAE for 3 atomic configurations of the Mn neighbours. In all cases, the symmetry of the crystal is rhombohedral. The two left panels, Figs. 6a and 6b, show MAE for the insulating case, and Fig. 6c for the hole concentration cm-3.
First, the continuous lines represent MAE for the ideal lattices, characterized by and =0.03, and they already were presented in Fig. 2. Due to the non-vanishing internal displacement , 3 out of 6 Mn-Te distances are equal 3.189 Å, and the 3 remaining are 2.819 Å.
Second, the dotted lines show the results for the configuration when the Mn ion is moved along the main diagonal of the supercell by , and all distances to the six nearest neighbouring Te ions are the same. In the metallic case, the displacement of the Mn ion has a very small influence on MAE, while in the insulating case the impact is substantial. More specifically, the absolute values of changes of are 0.2 K and 0.8 K in the metallic and insulating cases, respectively, while the relative changes are 3% and 277%, respectively.
This difference is connected with the much larger spatial range and magnitude of spin polarization of valence electrons in the metallic than in the insulating case. This issue is discussed in detail in the following. Consequently, in the metallic sample the spin polarization extends over the whole supercell, and the very localized perturbation of the lattice caused by a displacement of a single ion has a small influence on MAE. On the other hand, in the insulating case the range of spin polarization is much smaller, and therefore the system is sensitive to the perturbation in the nearest neighbourhood of Mn. That is why the changes of MAE are also larger.
Finally, the broken lines display the results obtained for configurations with partially optimized atomic positions. In the optimization procedure, the Mn ion together with its nearest 12 Ge and 6 Te neighbours were allowed to move, while the remaining atoms in the supercell were kept at their initial ideal positions. The displacements of 19 atoms lead to a much larger perturbation of the lattice than the displacement of the Mn atom only, and the changes of MAE are significant in both metallic and insulating cases. For this partially relaxed Ge1-xMnxTe lattice, the Mn-Te bond lengths are 3.043 Å and 2.796 Å. Thus, although the replacement of Ge by Mn atom does not lead to such a large local lattice deformation as in other IV-VI semiconductors (for example, in Pb1-xMnxTe the difference between ionic radii of Pb and Mn is much larger than that between Ge and Mn), the impact of local distorsions on MAE is certainly not negligible.
The details of MAE for and the partially relaxed lattice are shown in the lower left panel of Fig. 6. The broken line is a fit to the calculated points according to formula resulting from group theory considerations
where the second and the third term on the right hand side are proportional to
the
angular dependent parts of the Legendre polynomials and ,
respectively. Only such terms are allowed for rhombohedral symmetry if we
consider terms up to fourth order in spin components. One can observe that such
a fitting reproduces well the calculated values.
3.5 MAE of the Mn-Mn pairs
We also performed preliminary calculations for supercells containing two Mn atoms. For such supercells there are 21 possible nonequivalent configurations. For most of them the symmetry is not rhombohedral any more, thus Eq. (7) is no longer valid, and the term must be added to the fitting formula for . The coefficients and depend on both the configuration and the hole concentration. Interestingly, the average of over configurations almost disappears, indicating that although for most configurations the crystal symmetry is not rhombohedral, after the averaging procedure the functional dependence of MAE is in accordance with the macroscopic rhombohedral symmetry.
The situation is similar to that considered in Ref. [16], where the single ion anisotropy of Mn in Sn1-xMnxTe crystal was analyzed. In this work, the chemical microscopic disorder caused by the random placement of Mn ions in the lattice was taken into account. For each Mn ion, the amplitude of MAE was much larger than that observed in experiment, and the angular dependence did not correspond to the symmetry because the nearest neighbourhood of Mn ions had not such symmetry. However, after the averaging procedure the average MAE was reasonably close to the experimental values, and the angular dependence was consistent with the macroscopic cubic symmetry of the crystal.
4 Mechanism of magnetic anisotropy
4.1 Spin polarization
Atomic spin polarizations , defined in Section II, was analyzed for the supercells for two hole concentrations, and cm-3. The polarization depends on the atomic species, the distance from Mn, and on the hole concentration.
For , the Mn polarization , which is close to for the free atom. The values of and are much smaller, of the order of 0.01, and practically vanish (i.e., they are less than 0.001) beyond the first Te and Ge neighbours.
In the metallic case, the spin polarization of Mn depends on the hole concentration, and changes from 4.76 to 4.68 for the considered concentration range. The main effect induced by the presence of free holes is the pronounced increase of of the nearest Mn neighbours from 0.01 to 0.07. Also the spatial range of spin polarization of Te anions is larger, since it vanishes only for distances greater than 10 Å from Mn. On the other hand, spin polarization of Ge cations is similar to that in the insulating case. These results are explained by observing that in the metallic phase, Mn polarizes free holes, i.e., the states from the valence band top. These states are mainly built up from the atomic states of Te, which are polarized by Mn. The contribution of Ge orbitals to the hole states is much smaller, and so is the spin polarization of Ge. As it is shown in the next subsections, the strength of the spin polarization and its range are the decisive factors that determine MAE.
4.2 Dependence on the spin-orbit strength
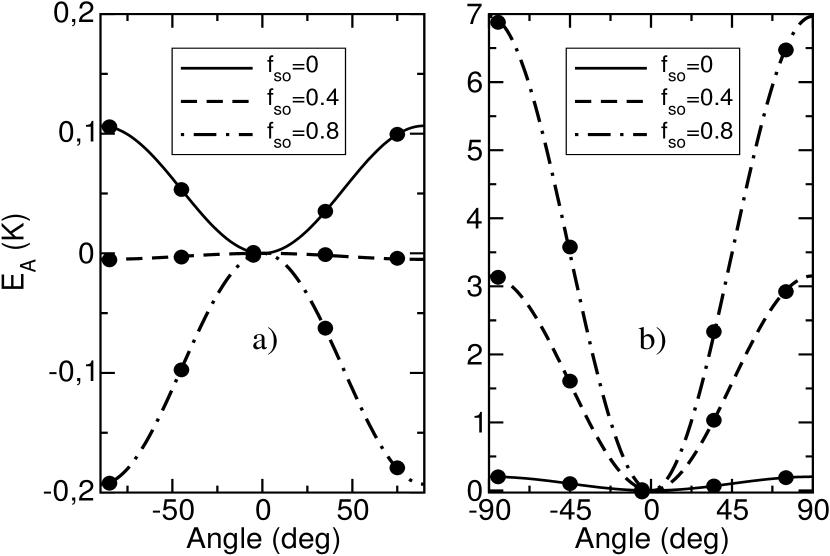
Figure 7 displays the angular dependence of MAE for different values of , the factor that tunes the spin-orbit interaction strength for Ge and Te. The figure compares the results for the insulating case, Fig. 7a, with those for the metallic one with cm-3, Fig. 7b.
When , i. e., the S-O coupling is non-vanishing for the Mn ion only, the angular dependencies of MAE are nearly the same in the insulating and the metallic cases (note that the energy scales for left and right panels of Fig. 7 are different), and the anisotropy is very weak. It follows from the non-vanishing S-O coupling of Mn, together with the hybridization between its orbitals and the orbitals of neighbouring atoms.
When the S-O interaction is turned on, the neighbouring atoms contribute to MAE as well. The reason is that for a given crystal structure, from the total energy point of view, each atom has its preferred direction of the polarization which, in general, is not the same as the actual direction of the manganese spin. That is why a change of direction of Mn spin changes total energy.
The impact of the increasing strength of the S-O interaction is different in the insulating and the conducting systems. In the former case, the anisotropy changes sign, but MAE remains small. In the metallic regime, the amplitude of MAE can increase by an order of magnitude or more, and it can also change sign depending on the actual hole concentration, see Fig. 3. We also found that the polarizations of Ge and Te atoms and their directions do not depend on significantly. Actually, the differences in polarizations for Ge or Te for different are less than 0.005.
These results clearly show that even in the insulating case
the magnetic
anisotropy is not related to Mn ion only but also to atoms in the Mn
neighbourhood, the
spatial range of which depends on the hole concentration.
4.3 Components of the total energy
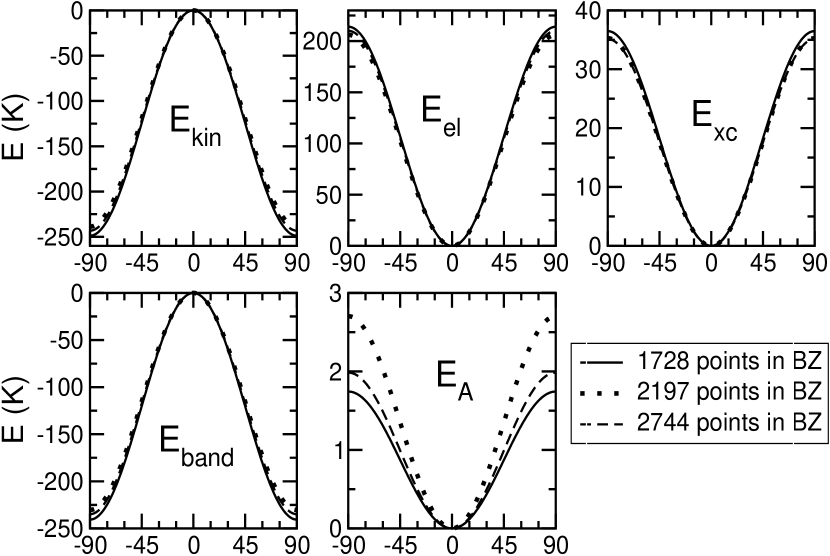
Total crystal energy can be decomposed into the contributions of kinetic energy, electrostatic electron-electron and electron-core interactions and exchange-correlation energy. In Fig. 8 we show changes of the total energy, , changes of its components, , , , and also changes of the band energy, , i. e. the sum of Kohn - Sham hamiltonian eigenvalues over occupied states. We note that the electrostatic term contains not only electron - electron and electron - core interactions, but also the S-O interaction, because the pseudopotentials are spin-dependent. From Fig. 8 it follows that the changes of components of the total energy are much larger than the changes of , which is typical for DFT calculations. The results of all the considered cases are qualitatively similar to those shown in Fig. 8. They clearly indicate that the changes of spin direction of the Mn ion are accompanied by spatial redistribution of electron density.
4.4 Microscopic picture of magnetic anisotropy
The above considerations allow us to propose the following picture
for the mechanism of magnetic anisotropy.
Assume that we know the total energies of the system,
and , for two directions of the Mn spin,
and , respectively.
As it was discussed above, the direction of the Mn spin
determines the spin directions of remaining atoms in the system.
Let us assume now that we know the solutions to the Kohn-Sham
problem for the first direction of the Mn spin, ,
and let us denote this set of eigenfunctions, corresponding to
, by .
Let us now change, using a unitary transformation, the directions
of spins in in such a way that after the rotation
the polarization of atoms correspond to the second direction
of Mn spin, .
The total energy , calculated with the new set of
wave functions , in general, is different from
.
This unitary transformation does not change electron densities
and
(which are the eigenvalues of electron density
operator at a given point, Eq. (2)) thus
it does not change the kinetic, electron-electron, electrostatic
part of the electron-core, and the exchange correlation energies.
The only term in the Kohn-Sham hamiltonian
which does not commute with the transformation is that
describing the electron-core interaction, because pseudopotentials
are spin
dependent. Thus, the difference between and is solely due to
spin-orbit interaction.
If we now take this new set of the wave functions, ,
as a starting point for the selfconsistent procedure, at
the end we obtain total energy and the set of wave
functions .
The directions of polarization of atoms calculated for
are the same as for , however the
resulting spatial electron density change.
Thus the change of spin directions is accompanied by changes in spatial electron distribution. These changes are, of course, very small and may be neglected in phenomena in which we are interested in energies of the order of 1 eV, however they are critical for the present problem of magnetic anisotropy. One should also notice that the spatial redistribution of electrons indicates that the so-called magnetic force theorem [47], sometimes used in calculations of magnetic anisotropy [48, 49] is not applicable in the present case. Selfconsistent calculations are necessary for each direction of the manganese spin.
On the basis of the presented results we can state that the anisotropy in Ge1-xMnxTe, particularly in the conducting case, is certainly not a single Mn ion anisotropy. This is a collective effect in the sense that all the atoms in the supercell give contribution to the phenomenon. For higher manganese content, as is in the cases studied in experiment, this is also the collective effect. This conclusion is in accordance with the Zener model [2, 3] where the magnetic anisotropy is also due to free carriers. However, ab initio calculations show that the differences in occupancies of band levels are not the only cause, the redistribution of electron densities should be also taken into account.
5 Summary
Magnetic anisotropy energy MAE in the diluted ferromagnetic semiconductor Ge1-xMnxTe was calculated within the Local Spin Density Approximation. This approximation is shown to be accurate enough to describe MAE effects of the order of 0.1 Kelvin. Low concentrations of Mn were considered, in which magnetic ions are interacting only weakly. The analysis included the impact of factors that determine MAE, namely (i) the concentration of free holes, (ii) the microscopic configuration of atoms in the surrounding of Mn, (iii) the macroscopic symmetry of the crystal (which in the case of Ge1-xMnxTe can be either cubic or rhombohedral), and (iv) the strength of the S-O interaction in valence band. The main conclusions are as follows.
First, magnetic anisotropy is largely determined by the presence of valence band holes. The increase of the hole concentration leads to both the variation of the MAE strength and to the change of its sign, i.e., to the reorientation of the magnetization easy axis from parallel to perpendicular to the [111] direction. In particular, for hole concentrations of the order cm-3, typical of Ge1-xMnxTe, the calculated direction of the easy axis of magnetization agrees with that observed in recent experiments on Ge1-xMnxTe epitaxial layers deposited on BaF2 (111) substrates (perpendicular magnetic anisotropy) [23, 28, 29, 30].
Second, MAE is surprizingly sensitive to both the macroscopic crystal structure and the atomic configuration of the Mn neighbourhood. For example, a change of the crystal parameters from and to and reduces MAE by as much as one order of magnitude. A comparable sensitivity is found for the dependence of MAE on the local atomic configuration.
Third, the calculated angular dependencies of MAE fully agree with those predicted by group theory. For Ge1-xMnxTe in the rhombohedral phase, the terms of the second order in Mn spin components satisfactorily describe the calculated results. This dominance of the quadratic terms is consistent with the experimental results [23, 40]. On the other hand, higher order terms cannot be neglected for cubic Ge1-xMnxTe.
Finally, the role of the spin-orbit coupling was elucidated by calculating MAE as a function of the S-O strength of the band states of host Ge1-xMnxTe crystal. The S-O of the host is particularly important in conducting samples.
The obtained results are related to the fact that the spin polarization of the host atoms have a decisive impact on MAE. Since the states from the top of the valence bands are mainly composed from the orbitals of Te, they determine spin polarization of the valence states. The insulating and the metallic case differ by the spatial extension of the spin polarization: in the former case only the first two coordination shells are spin polarized, while in the latter case spin polarization extends over several lattice constants. This varying degree of localization explains a number of the calculated trends in MAE. Moreover, in the presence of S-O interaction the changes in the Mn spin direction induce changes in the electron density, the impact of which on the total energy was discussed in the last section.
Regarding the comparison with experiment one notices that a description of MAE in real samples containing 10-20 per cent of Mn must include Mn-Mn magnetic coupling, much stronger in metallic than in insulating samples. Moreover, incorporation of the microscopic chemical disorder, which implies in particular local deformations of the lattice in the vicinity of Mn, is necessary. On the other hand, the orientation of easy axis (perpendicular magnetic anisotropy) observed in Ge1-xMnxTe/BaF2 (111) layer is already explained by the present results. Although the calculations were performed for Ge1-xMnxTe, they directly apply to closely related IV-VI ferromagnetic semiconductors, Sn1-xMnxTe and Pb1-x-ySnxMnyTe. The proposed microscopic mechanism of magnetic anisotropy should also be applicable to other groups of diluted ferromagnetic semiconductors.
References
References
- [1] Dietl T and Ohno H 2014 Rev. Mod. Phys. 86 187
- [2] Dietl T, Ohno H, Matsukura F, Cibert J and Ferrand D 2000 Science 287 1019
- [3] Dietl T, Ohno H and Matsukura F 2001 Phys. Rev. B 63 195205
- [4] Stefanowicz W, Śliwa C, Aleshkevych P, Dietl T, Döppe M, Wurstbauer U, Wegscheider W, Weiss D and Sawicki M 2010 Phys. Rev. B 81 155203
- [5] Sawicki M, Matsukura F, Idziaszek A, Dietl T, Schott G M, Ruester C, Gould C, Karczewski G, Schmidt G and Molenkamp L W 2004 Phys. Rev. B 70 245325
- [6] Sawicki M, Wang K-Y, Edmonds K W, Campion R P, Staddon C R, Farley N R S, Foxon C T, Papis E, Kamińska E, Piotrowska A, Dietl T and Gallagher B L 2005 Phys. Rev. B 71 121302(R)
- [7] Abragam A and Bleaney B 1970 Electron Paramagnetic Resonance of Transition Ions (Clarendon Press, Oxford)
- [8] Sharma R R, Das T P and Orbach R 1966 Phys. Rev. 149 257
- [9] Sharma R R, Das T P and Orbach R 1967 Phys. Rev. 155 338
- [10] Sharma R R, Das T P and Orbach R 1968 Phys. Rev. 171 378
- [11] YyWan-Lun and Tan Tao 1994 Phys. Rev. B 49 3243
- [12] Łusakowski A and Dugaev V K 2005 Phys. Rev. B 71 014422
- [13] Larson B E, Hass K C, Ehrenreich H and Carlsson A E 1998 Phys. Rev. B 37 4137
- [14] Dietl T, Śliwa C, Bauer G and Pascher H 1994 Phys. Rev. B 49 R2230
- [15] Kacman P 2001 Semicond. Sci. Technol. 16 R25
- [16] Lusakowski A 2006 Solid State Comm. 137 107
- [17] Łusakowski A, Jędrzejczak A, Górska M, Osinniy V, Arciszewska M, Dobrowolski W, Domukhovski V, Witkowska B, Story T and Gałązka R R 2002 Phys. Rev. B 65 165206
- [18] Łusakowski A 2005 Phys. Rev. B 72 094429
- [19] Łusakowski A, Story T and Gałązka R R 1993 Acta Phys. Pol. A 84 829
- [20] Eggenkamp P J T, Swagten H J M, Story T and de Jonge W J M 1995 J. Magn. Magn. Mat. 140–144 2039
- [21] Yosida K and Tachiki M 1957 Prog. Theor. Phys. 17 331
- [22] Fukuma Y, Asada H, Nishimura N and Koyanagi T 2003 J. Appl. Phys. 93, 4034
- [23] Przybylińska H, Springholz G, Lechner R T, Hassan M, Wegscheider M, Jantsch W and Bauer G 2014 Phys. Rev. Lett. 112, 047202
- [24] Story T, Swüste C H W, Eggenkamp P J T, Swagten H J M and de Jonge W J M 1996 Phys. Rev. Lett. 77 2802
- [25] Lechner R T, Springholz G, Hassan M, Groiss H, Kirchschlager R, Stangl J, Hrauda N and Bauer G 2010 Appl. Phys. Lett. 97 023101
- [26] Fukuma Y, Murakami T, Asada H and Koyanagi T 2001 Physica E 10 273
- [27] Di Sante D, Barone P, Bertacco R and Picozzi S 2013 Adv. Mater. 25 509
- [28] Knoff W, Dziawa P, Osinniy V, Taliashvili B, Domukhovski V, Łusakowska E, Świątek K and Story T 2007 Mat. Sci. Poland 25 295
- [29] Knoff W, Świątek K, Andrearczyk T, Domukhovski V, Dziawa P, Kowalczyk L, Łusakowska E, Siusys A, Taliashvili B, Wróbel J and Story T 2011 Phys. Stat. Sol. B 248 1605
- [30] Fukuma Y, Asada H, Miyawaki S, Koyanagi T, Senba S, Goto K and H. Sato H 2008 Appl. Phys. Lett. 93 252502
- [31] Łusakowski A and Bogusławski P 2014 Acta Phys. Pol. A 126 1177
- [32] see http://www.openmx-square.org.
- [33] Ceperley D M and Alder B J 1980 Phys. Rev. Lett. 45 566
- [34] Troullier N and Martins J L 1991 Phys. Rev. B 43 1993
- [35] Kleinman L and Bylander D M 1982 Phys. Rev. Lett. 48 1425
- [36] Ozaki T 2003 Phys. Rev. B. 67 155108
- [37] Ozaki T and Kino H 2004 Phys. Rev. B 69 195113
- [38] Bachelet G B, Hamann D R and Schluter M 1982 Phys. Rev. B 26 4199
- [39] see http://www.openmx-square.org/tech_notes/NCDFT_WS08.pdf.
- [40] Knoff W, Łusakowski A, Wołoś A and Story T 2015 Acta Phys. Pol. A 127 404
- [41] Falicov L M and Golin S 1965 Phys. Rev. 137 A871
- [42] Łusakowski A, Bogusławski P and Radzyński T 2011 Phys. Rev B 83 115206
- [43] Chiba D, Sawicki M, Nishitani Y, Nakatani Y, Matsukura F and Ohno H 2008 Nature 455 515
- [44] Sawicki M, Chiba D, Korbecka A, Nishitani Y, Majewski J A, Matsukura F, Dietl T and Ohno H 2010 Nat. Phys. 6 22
- [45] Story T, Karczewski G, Świerkowski L and Gałązka R R 1990 Phys. Rev. B 42 10477
- [46] Story T, Eggenkamp P J T, Swüste C H W, Swagten H J M, de Jonge W J M and Lemmens L F 1992 Phys. Rev. B 45 1660
- [47] Liechtenstein A I, Katsnelson M I, Antropov V P and Gubanov V A 1987 J. Magn. Magn. Mat. 67 65
- [48] Jansen H J F 1999 Phys. Rev. B 59 4699
- [49] Kota Y and Sakuma A 2014 J. Phys. Soc. Jpn. 83 034715