Deformation-Driven Diffusion and Plastic Flow in Two-Dimensional Amorphous Granular Pillars
Abstract
We report a combined experimental and simulation study of deformation-induced diffusion in compacted two-dimensional amorphous granular pillars, in which thermal fluctuations play negligible role. The pillars, consisting of bidisperse cylindrical acetal plastic particles standing upright on a substrate, are deformed uniaxially and quasistatically by a rigid bar moving at a constant speed. The plastic flow and particle rearrangements in the pillars are characterized by computing the best-fit affine transformation strain and non-affine displacement associated with each particle between two stages of deformation. The non-affine displacement exhibits exponential crossover from ballistic to diffusive behavior with respect to the cumulative deviatoric strain, indicating that in athermal granular packings, the cumulative deviatoric strain plays the role of time in thermal systems and drives effective particle diffusion. We further study the size-dependent deformation of the granular pillars by simulation, and find that different-sized pillars follow self-similar shape evolution during deformation. In addition, the yield stress of the pillars increases linearly with pillar size. Formation of transient shear lines in the pillars during deformation becomes more evident as pillar size increases. The width of these elementary shear bands is about twice the diameter of a particle, and does not vary with pillar size.
pacs:
45.70.-n, 47.57.Gc, 83.50.-v, 83.80.FgI Introduction
Disordered materials such as metallic glasses can exhibit highly localized deformation and shear band formationGreer et al. (2013); Falk and Langer (2011). Most experiments on these systems, however, use loading geometries in which there are free boundaries and inhomogeneous strains, while simulations have typically focused on systems with periodic boundary conditions under homogeneously-applied shear strain. To understand at a microscopic level the effects of loading geometry on the macroscopic mechanical response, it is useful to study a disordered system in which individual particles can be imaged and tracked as they rearrange under an applied load. Here we introduce a granular packing–a packing of discrete macroscopic particles for which thermal agitation plays a negligible role Jaeger et al. (1996); de Gennes (1999)–in a pillar geometry commonly used for mechanical testing of metallic glasses. We combine experiment and simulation to study the response of these two-dimensional (2D) pillars to athermal, quasistatic, uniaxial compression.
One question of interest is how the mechanical response of the pillar depends on pillar size. We find that the pillar shape evolves under load in a self-similar fashion, so that the shape of the pillar at a given strain is independent of system size. We also find that as the pillars deform, the strain rate localizes into transient lines of slip, whose thickness of a few particle diameters is independent of system size. Thus, the system is self-similar in shape at the macroscopic scale, but, surprisingly, its yielding is not self-similar at the microscopic scale.
A second question concerns the random motions of particles as they rearrange under inhomogeneous loading conditions. Because particles jostle each other, they display diffusive behavior in homogeneously sheared systems that are devoid of random thermal fluctuations Ono et al. (2002). Recently, crystal nucleation and growth were observed in situ in mechanically fatigued metallic glasses at low temperature Wang et al. (2013). Crystallization is typically thought to require diffusion. Therefore, it was suggested that the “shear transformation zones” (STZs) Falk and Langer (2011) should be generalized to “shear diffusion transformation zones” (SDTZs) Wang et al. (2013), to reflect the contributions of random motions driven by loading, even under inhomogeneous conditions. Our amorphous granular pillar is an athermal system as far as the macroscopic particles are concerned (effective vibrational temperature 0), so our experiment and simulations can examine how inhomogeneous loading affects particle motion. We find that the idea of load-induced diffusion can be generalized to inhomogeneous loading by replacing time with the cumulative deviatoric strain, and the mean-squared displacement with the mean-squared displacement of a particle relative to the best-fit affine displacement of its neighborhood (i.e. the mean-squared non-affine displacement Falk and Langer (1998)). With this generalization, we observe that the mean-squared non-affine particle displacement crosses over from ballistic to diffusive behavior as a function of the cumulative deviatoric strain.
The article is organized as follows. In section II, we describe the experimental and simulation setup, as well as the simulation methodology, of 2D amorphous granular pillars under uniaxial and quasistatic deformation. Section III describes the results of our combined experiments and simulations on the deformation of a 2D granular pillar containing 1000 particles. In section IV, we discuss the exponential crossover of non-affine particle displacement from ballistic motion to diffusion with respect to cumulative deviatoric strain. Section V presents our simulation results on the size-dependent deformation of large 2D granular pillars. Then we conclude the article in section VI.
II Methods
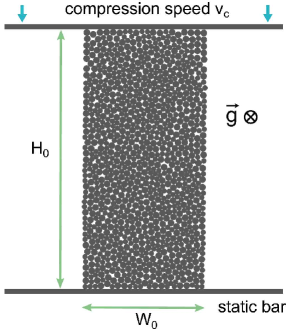
The compacted 2D amorphous granular pillars in our study consist of 50-50 mixture of bidisperse cylindrical particles (grains) standing upright on a substrate. A top-view of the schematic setup is shown in Fig. 1. The pillars have aspect ratio , where and are the original height and width of the pillars respectively. In our experiment, the cylindrical granular particles are made of acetal plastic. The diameter of the large grains in the pillars, denoted by , is inch (0.635 cm), while for the small grains the diameter has the value of inch (0.47625 cm). The ratio of diameter between large and small grains is therefore . Both types of grains are 3/4 inch (1.905 cm) tall. The masses for the large and small grains are 0.80 gram and 0.45 gram respectively. The pillars are confined between a pair of parallel bars. The bottom bar is static while the top bar deforms the pillars uniaxially with a slow, constant speed inch per second (0.0084667 cm/sec). The force sensors connected to the bars measure the forces on the top and the bottom bars, and the trajectory of each particle in a pillar is tracked by a high-speed camera mounted above the pillar. The basic parameters in our simulation, including the size and mass of the grains, as well as the velocity of the bars, are the same as in the experiment. Further experimental details will be described in an upcoming paper Rieser et al. .
II.1 Packing Generation Protocol
Properly prepared initial configurations are crucial for the study of the mechanical properties of amorphous solids. In our experiment, 50-50 random mixture of bidisperse grains are compacted to form a pillar with aspect ratio 2 to 1. To facilitate direct comparison between experiment and simulation, for small-sized pillars (number of grains in the pillar ), the simulation initial conditions are taken from the experimental data, which was then relaxed in simulation to avoid particle overlapping resulted from measurement error. For large-sized pillars, which can only be studied by simulation, we generate compacted, amorphous granular pillars through computer simulation, using the protocol described below. The particle area density in the simulation-generated pillar is controlled to be at the onset of jamming transition O’Hern et al. (2003). To generate the initial conditions, we assign the following truncated Lennard-Jones potential with purely repulsive interaction to the large (L) and small (S) grains
| (1) |
where the subscripts , denote L or S. The zero-force cut-off distances are chosen to be the sum of radii of two particles in contact, namely , , and , where is the diameter of a large grain. We note that this potential will only be used to generate the initial conditions of the granular packings, and is different from the particle interaction model we describe later for the deformation of the granular pillars.
To create a disordered granular packing with 50-50 mixture of total number of large and small grains, a rectangular simulation box with dimensions is initially created, where the width of the box is chosen such that the initial particle area density, , is slightly above the particle overlapping threshold. We then randomly assign the positions of the particle within the simulation box, and subsequently use conjugate-gradient (CG) method to minimize the total potential energy of the system. Periodic boundary conditions are applied during this process. The particle positions are adjusted iteratively until the relative change of energy per particle between two successive CG steps is smaller than . When this stage is reached, the pressure of the system is calculated using the following virial formula
| (2) |
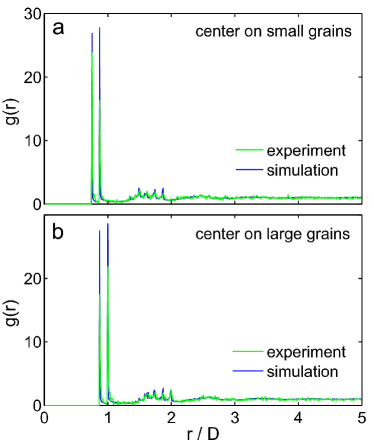
where is the area of the simulation box, is the distance between particles and . If the pressure is greater than zero, both dimensions of the simulation box will be enlarged by a fraction of , and the particles in the box will be mapped to the corresponding new positions in the enlarged box via affine transformation. CG energy minimization will then be carried out on the new configuration. This iterative process stops when the calculated pressure of the system at the end of a CG run becomes smaller than . The final configuration will be taken as the initial conditions of close-packed 2D amorphous granular assembly. Vacuum space is then added on the lateral sides of simulation box to create a pillar with 2:1 aspect ratio. Calculation of radial distribution functions for different-sized pillars indicates that the structure of the amorphous assemblies generated following the above procedures does not show noticeable size dependence. Comparison of the radial distribution functions computed for the experimental and simulation-generated initial conditions is shown in Fig. 2.
II.2 Simulation Methodology
We use the method of MD to simulate the quasistatic deformation of the 2D granular pillars. The simulation force model includes three components: the grain-grain interaction, the grain-bar interaction and the grain-substrate interaction. Each of these forces will be described in the following.
II.2.1 Grain-Grain Interaction
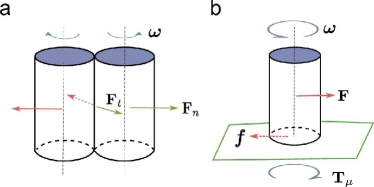
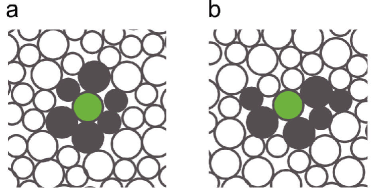
As illustrated in Fig. 3a, the interaction between two grains includes normal and tangential contact force, which are denoted by and respectively. Two grains experience a repulsive normal contact force if the distance between the particle centers is smaller than the sum of their radii. For two smooth, elastic cylindrical particles with parallel axes, the normal contact force as determined by the Hertzian theory of contact mechanics is proportional to the indentation depth between the two particles Johnson (1985). For our granular particles, denote by and the positions of particles and , and denote by the distance vector between the two particles, the indentation depth is calculated as
| (3) |
where . and are the particle radius of and respectively. will be zero if the two particles are not in contact. The normal contact force acting on the particle by particle is then given by
| (4) |
where , and is the normal contact stiffness. The corresponding normal contact force on particle is given by Newton’s third law, namely, . In Hertzian theory of contact mechanics Johnson (1985), the constant for two cylinders in contact can be calculated as
| (5) |
where is the height of the cylinders. is the normalized contact elastic modulus, which is computed from the respective elastic modulus of the two cylinders, and , and their Poisson’s ratios, and :
| (6) |
The existence of a friction force between two particles in contact is a characteristic feature of granular materials. Appropriate modeling of contact friction is crucial to the study of granular dynamics. The tangential frictional force between two grains in contact can be very complicated in reality Silbert et al. (2001). We adopt the history-dependent shear contact model initially developed by Cundall and Strack Cundall and Strack (1979). This well-tested model has been used by many others to model the dynamics of granular assemblies Silbert et al. (2001, 2002); Landry et al. (2003); Brewster et al. (2005); Zhang and Makse (2005); Rycroft et al. (2006a, b); Kamrin et al. (2007); Rycroft et al. (2009a, b). The essence of this model is to keep track of the elastic shear displacement of two particles throughout the lifetime of their contact, and applying the Coulomb elastic yield criterion when the displacement reaches a critical value. Our implementation of the Cundall-Strack model follows Silbert et al. Silbert et al. (2001). Specifically, the tangential contact force between particle and is calculated as:
| (7) |
where the shear displacement is obtained by integrating the tangential relative velocities of the two particles during the lifetime of their contact Silbert et al. (2001). Here is the tangential contact elastic modulus. It is taken to be proportional to the normal contact stiffness . Following Silbert et al., we choose . Previous studies showed that the dynamics of system is relatively insensitive to this parameter Silbert et al. (2001), which is confirmed by our own simulation.
To model the elastic yield of shear contact, the magnitude of is truncated to satisfy the Coulomb yield criterion , where is the friction coefficient between the grains.
The tangential contact force will induce torques on the two grains in contact, as given by
| (8) |
Here is the torque exerted by grain on grain due to the tangential contact force .
II.2.2 Grain-Bar Interaction
The grain-bar interaction is modeled in a similar way to the grain-grain interaction. The bar is essentially treated as a rigid grain with infinitely large radius. When a grain comes in contact with a bar, the grain can experience normal and shear contact force induced by the bar, and the shear contact force is also calculated by tracking the elastic shear displacement between the grain and the bar. The motion of the moving bar is not affected by the grains. The static bar at the bottom side of the pillar is always static, while the top bar deforms the pillar at a constant speed . Compared to grain-grain interaction, the interaction parameters between the grains and the bar is slightly modified. Since the bars are modeled as rigid bodies that cannot be elastically deformed, it means that the elastic modulus of the bars is considered to be infinite. Consequently, the effective interaction modulus between the bars and the grains, based on Eq. 6, is twice as large as that between the grains. Therefore, from Eq. 5, the normal interaction stiffness between the bars and the grains is twice as large as that between the grains, i.e., . Since the shear modulus of contact is proportional to , we have as well.
II.2.3 Grain-Substrate Interaction
The effect of the substrate on the grains is determined after all the forces and torques on each grain due to other grains and bars have been determined. The substrate can induce both frictional force and torque on the grains, as illustrated in Fig. 3b. If a grain is initially static, unless the magnitude of total force due to other grains/bars is larger than the maximum frictional force that can be exerted by the substrate , the substrate frictional force will cancel out other forces on the grain and the particle will continue to have zero velocity. Here is the mass of the grain , is the gravitational acceleration and denotes the frictional coefficient between the grains and the substrate. In another case, if the velocity of the grain is non-zero, the substrate will induce a frictional force opposite to the direction of particle motion, with magnitude . A similar algorithm applies to the rotational motion of a particle. An initially static grain will not start to rotate unless the torque due to other interactions surpasses the maximum substrate-induced frictional torque , where is the radius of the cylindrical-shape particle. The prefactor is based on the assumption that frictional force is evenly distributed on the circular contact interface between a cylindrical-shape grain and the substrate. If the angular velocity of the grain is non-zero, a frictional torque
| (9) |
will slow down the rotational motion of the particles, where and denotes the angular velocity of particle .
II.2.4 Equations of Motion
After all the forces and torques on an individual grain are determined, they are summed up and the velocities and angular velocities of the grains are then updated according to Newtonian equations of motion:
| (10) |
where and are the total force and torque on the particle respectively. is the moment of inertia for grain . The standard velocity Verlet integrator is used to update the positions and velocities of the particles, while a finite difference method is used to integrate the first-order differential equation for the angular velocities.
There is a subtle numerical issue that must be addressed when modeling velocity and angular velocity changes of the particles in the presence of the damping effects of a frictional substrate. In numerical integration of equation of motion, time is discretized into small timesteps with each timestep being a small increment . To complete the simulation within a reasonable time frame, cannot be too small, which means that the changes of velocity and angular velocity of the grains due to the substrate induced force and torque within a timestep are not infinitesimal. Hence, the motion of particles might not be able to be brought to a halt by the substrate the velocity and angular velocity of the particles could oscillate around the zero. Consider, for example, a stand-alone cylindrical grain with initial velocity and angular velocity . Without other interactions, the substrate will induce friction and frictional torque on the grain, which slows down the translational and rotational motion of the grain respectively. According to the equations of motion in Eq. 10, the translational and rotational acceleration will be and , with being the radius of particle . Hence, within a timestep , the change of velocity or angular velocity is a finite number: , . If the velocity or angular velocity have been damped to values below these two numbers, they cannot be damped further but instead oscillate around zero, which is clearly a numerical artifact. To work around this issue, we introduce two small parameters
| (11) |
such that when and are both satisfied, the velocity and total force on the particle will be set to zero. Here is the force of particle on particle , and is the force of the bars on particle . Similarly, for the rotational motion, if and , the angular velocity and total torque of the particle is set to zero.
II.3 Choice of Simulation Model Parameters
The independent parameters in the interaction model of our simulation include the grain-grain stiffness , grain-grain friction coefficient , grain-substrate friction coefficient , and the timestep for integration of equations of motion . Among these parameters, has been experimentally measured to be around 0.23. Hence will be adopted in our simulations. The grain-grain friction coefficient is unknown. We have carried out simulation using multiple values of , and the results indicate that choosing can achieve good match between the experiment and simulation. Due to the quasistatic nature of deformation by the moving bar on the pillars, the increment of force on a grain by the bar within one timestep must be much smaller than the maximum static friction by the substrate on a grain, namely
| (12) |
where is the speed of the top moving bar. Hence, the smaller the value of , the higher the value of that can be adopted in simulation. While there is no physical reason for a lower bound of , smaller results in an increased time span to complete simulation. Realistic consideration leads to our choice of second. The upper bound of allowed calculated from Eq. 12 is considered to be smaller than the real contact stiffness of two particles in experiment. For this reason, we have systematically studied the influence of on the simulation results in a small-sized pillar containing 1000 grains. The relatively small sized pillar allows us to use second and thus access a wider range of , from = 1 N/mm to = 100 N/mm. The results indicate that the statistical behaviors of deformation dynamics, such as flow stress and particle-level deformation characteristics, are not significantly influenced by the value of the . We therefore choose N/mm and in our simulation.
The results of our study will be expressed in terms of several characteristic units. Length will be expressed in the diameter of the large grains or the radius . The unit of velocity will be the bar speed and the unit of time will be , which is the time it takes for top bar to move over a distance equal to . The units for force and stress will be , respectively, where for convenience, we will use the symbol to denote the mass of a large grain. is thus the minimum force to induce the translational motion of a stand-alone large grain and is the corresponding averaged stress of the bar on the grain.
III Combined Experiment and Simulation on Deformation of Small-Sized Pillars
Deformation of an pillar has been studied by both experiment and simulation. The experimental initial particle arrangement in the pillar is the same as those depicted in Fig. 1. To facilitate comparison between experiment and simulation, our parallel simulation of pillar deformation uses the experimentally measured initial conditions, which were further relaxed in simulation to avoid particle overlapping resulted from measurement error. When the pillar is deformed by the moving bar, the strain of deformation is defined as the change of pillar height divided by the original height of the pillar , namely, . The deformation stress is calculated as the normal force on the top moving bar divided by the maximum width of the pillar near the top edge , namely .
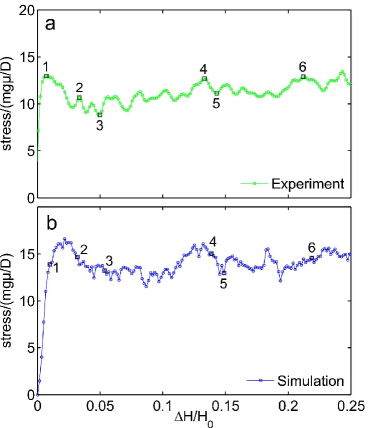
Fig. 4 shows the experimental and simulation stress-strain curve of the pillar. The measured stress shows yielding behavior when the deformation strain exceeds a very small value . From our simulation, we find that the yield strain in general becomes smaller as the grain-grain stiffness or the packing density of the pillar is increased. The yield stress however shows little dependence on . The parameter that affects most was found to be the grain-grain friction coefficient . In the range of we have studied ( from 0 to 0.3), increases monotonically with the increase of . The simulation results presented in this paper use , which was found to achieve overall good match between the experiment and simulation.
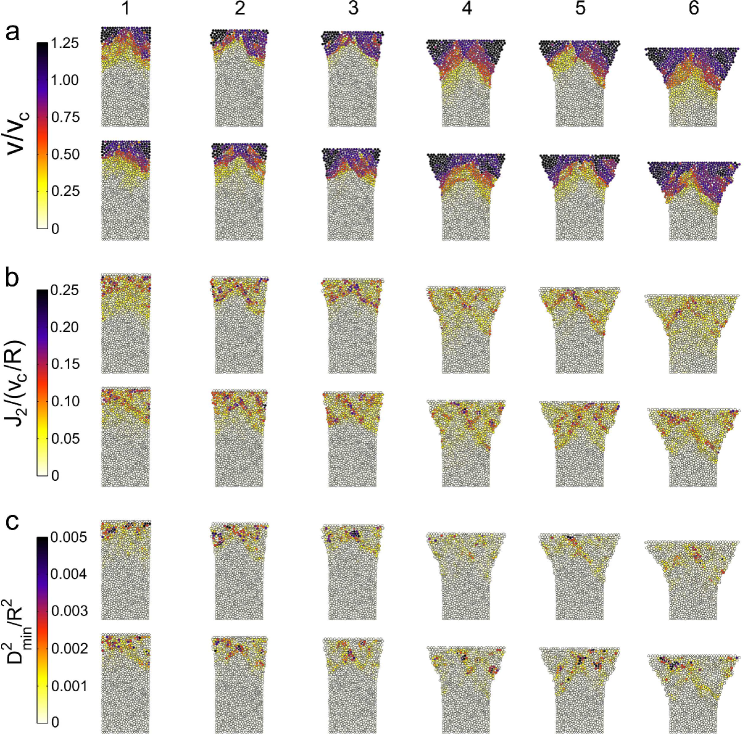
In Fig. 4, we label several stress/strain values and calibrate the corresponding particle-level structural changes in the pillar. The experimental and simulation results are then compared side-to-side in Fig. 5. Fig. 5a shows the mean particle velocity field in the pillar at six different stages of deformation. The mean velocity of a particle , denoted by , is calculated as the average displacement magnitude of the particle from current time to a later time ,
| (13) |
where the value of time interval is chosen to be for the present purpose. contains information of the absolute amount of displacement of the particle within . As shown in Fig. 5a, the mean velocities of the particles near the moving bar are close to , which is expected as the pillar is deformed quasistatically by the bar. The mean velocity of a particle in general becomes smaller as the particle is further away from the moving bar. At the early stages of deformation, particles at the bottom part of the pillar have not moved and therefore have zero values of . A sharp boundary between the moving and non-moving regions of the pillar often forms along the the direction that is roughly 45 degree to the direction of uniaxial deformation.
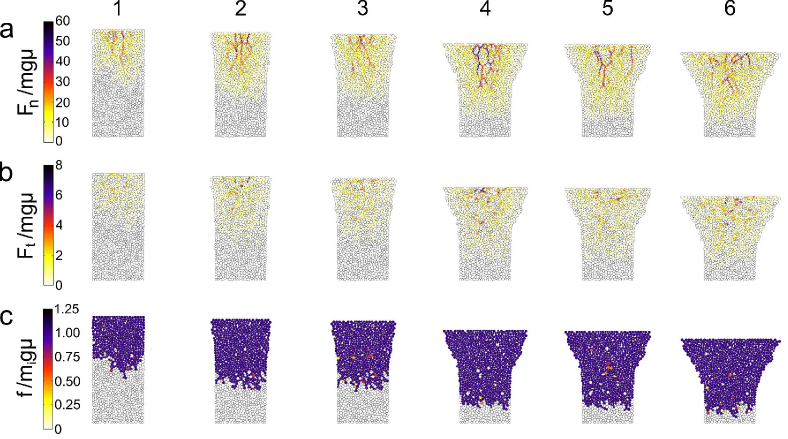
In the simulations we have access to detailed information on the inter-particle interactions. In Fig. 6 we plot the grain-grain normal force , tangential force and substrate-induced force frictional force on the particles at six stages of deformation corresponding to the special labels in Fig. 4. Comparing Fig. 6a with Fig. 6b and Fig. 6c, we find that is in general much larger than , which is further larger than , namely . In particular, Fig. 6a shows that particles with large are connected with force chains. The magnitude of forces in these force chains is higher for particles residing in the interior the pillar. This indicates that the stress in the pillar is rather inhomogeneous, with larger stresses in the interior region of the pillars than close to the surface.
We further look at the rearrangement of particles in the pillar by defining a neighbor sampling distance , and calculate the affine transformation strains and non-affine displacements of the particles with respect to their neighbors within . The value of is chosen to be , which roughly corresponds to the average first nearest-neighbor distance of the particles in the pillar, as can be seen from the computed radial distribution functions in Fig. 2. A particle is considered to be the neighbor of a particle if their distance is smaller than , which is illustrated in Fig. 7. The configurations of the particle and its neighbors at a given time and a subsequent time will then be used to compute the best-fit local affine transformation matrix and the non-affine displacement associated with particle , using the method introduced by Falk and Langer Falk and Langer (1998); Shimizu et al. (2007). Specifically, is obtained by calculating the best affine transformation matrix that minimizes the error of deformation mapping:
| (14) |
where is the distance vector between particles and at time . is the distance vector at a later time . The summation is over the neighbors of particle at time , whose total number is given by . The best-fit affine transformation matrix is usually non-symmetric due to the presence of rotational component. A symmetric Lagrangian strain matrix can be calculated from as
| (15) |
where is an identity matrix. The hydrostatic invariant is then computed from as
| (16) |
The shear (deviatoric) invariant is then given by
| (17) |
Hereafter we will refer to as the deviatoric strain associated with the particle from to . The deviatoric strain rate, denoted by , is the normalization of with respect to :
| (18) |
Fig. 5b-c shows the computed deviatoric strain rate and for each particle in the pillar at six different stages of deformation, where the experimental and simulation results are compared side to side. and are computed using , which is the same as the value of used for computing the mean velocities of the particles in Fig. 5a. Comparing Fig. 5b with Fig. 5a, it can be seen that large values of deviatoric strain rate occur at places where the gradient of mean velocity, and hence the gradient of particle displacement, is large, which is understandable as strain is a measure of displacement gradient. One can also notice from Fig. 5b the presence of thin shear lines in the pillars, where particles with large deviatoric strain rate reside. The width of these shear lines is about twice the diameter of the particles. These shear lines largely correspond to the moving boundary between the deformed and undeformed regions in the pillar. The presence of such shear lines will appear clearer as pillar size increases, which will be discussed in the later part of the article.
Comparing the profile in Fig. 5c with deviatoric strain rate in Fig. 5b, it is clear that particles with larger values of are correlated with larger values of , and hence also deviatoric strain (Eq. 18). The deviatoric strain reflects the local shear component of affine deformation (shape change), while measures additional particle displacement with respect to its neighbors that cannot be described by mere shape change. The positive correlation between and is understandable because the larger the value of (which usually drives plastic deformation), the error of describing local particle rearrangement in terms of purely shape change, which is the definition of , will more likely to be larger.
IV Local Deviatoric Strain Driven Particle Diffusion
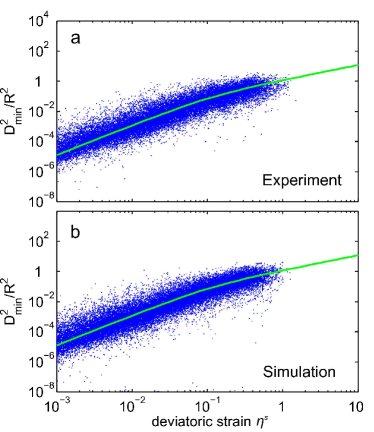
The positive interdependence between and motivates us to map out their correlation quantitatively. Starting with an initial configuration of the pillar at time that corresponds to deformation strain , we fix the neighbor sampling distance and calculate and for each particle in the pillar using a logarithmic series of time interval . This procedure is then repeated for at least eight values of initial times equally spaced by . We then plot all the calculated values of with respect to on a single plot, using logarithmic axes for both and . The results of experiment and simulation are shown together in Fig. 8. From Fig. 8, it can be seen that while for a given specific value of , the possible values of are scattered, the existence of statistical correlation between and is apparent. We find that in the range of small values of , scales quadratically with , which gradually transits to linear scaling at larger values of . This is reminiscent of the scaling relationship between the growth of mean squared displacement (MSD) for a thermally diffusive particle and time , which is often explained pedagogically by an unbiased random walker. Indeed, we find that, by considering as MSD, and deviatoric strain as time, the data in Fig. 8 can be fit very well using the following equation that describes the exponential crossover of a thermal particle from ballistic to diffusive motion, expected for a Langevin particle with no memory Chaikin and Lubensky (2000):
| (19) |
where on the left hand side of the above equation, the calculated is scaled by to render it dimensionless. is the dimensionless effective diffusivity while takes meaning of “crossover deviatoric strain”. Our fitting of the data gives , for the experiment, and , for the simulation.
The analogy between and MSD, and between and time , may have deep implications. describes the mean-squared non-affine displacement of a particle with respect to its neighbors and can be naturally identified as an analogy to MSD. The analogy between deviatoric strain and time implies that, for the granular packings, where there is no thermal agitation and the system is deformed heterogeneously, the cumulative deviatoric strain plays the role of time and drives effective particle diffusion. Argon had originally used bubble raft deformation to illustrate the concept of shear transformation zone (STZ) Argon and Kuo (1979); Argon (1979), which emphasizes the affine part of localized stress-driven processes. Recently, Wang et al. found that cyclic mechanical loading can induce the nano-crystallization of metallic glasses well below the glass transition temperature Wang et al. (2013), resulting from stress-driven accumulation of non-affine displacement of the atoms in the sample. The concept of shear diffusion transformation zones (SDTZs) was proposed by the authors to explain the experimental results and to emphasize the diffusive character of STZs. Our results lend support to the concept of SDTZ by showing that, even in amorphous granular packings, where there is no thermal-driven diffusion at all, if the accumulated local deviatoric strain is large enough (above a few percent strain), the non-affine displacement of a particle with respect to its neighbors crosses over to the diffusive limit. This suggests that SDTZ may be a key concept for a broad range of amorphous solids.
The analogy between local cumulative shear transformation strain in athermal amorphous solids and time in thermal systems for particle diffusion may be rationalized by a “space-time equivalence” argument, as follows. A finite temperature means temporally random momentum fluctuations, for crystals and non-crystals alike. Even in crystals, such random momentum fluctuations (due to collision of multiple phonons) can drive the random walker behavior of a particle, if these temporal fluctuations can be significant compared to the potential energy barrier. But in amorphous solids without spontaneous temporal fluctuations, there will be nonetheless still another source of randomness, which is the local spatial structure and structural response of the amorphous solid. This is indeed what motivated the “heterogeneously randomized STZ model” Zhao et al. (2013, 2014). In other words, even if two “Eshelby inclusions” at different locations of an amorphous solid transform by exactly the same transformation strain , one reasonably would still expect drastically different internal particles arrangements and rearrangements inside these zones. This ultimately is because the local strain is just a coarse-graining variable, that represents a key aspect of the structural transformations of a kinetically frozen random cluster, but not all of its structural information. (This may not be true in simple crystals, where may entirely capture the entire structure.) Such structural mutations beyond transformation strain are reflected in . The fact that will accumulate linearly with strain at steady state means the structural mutations from generation to generation Zhao et al. (2013, 2014) are largely non-repeating and essentially unpredictable, if starting from a spatially random configuration at the beginning, even when the stress condition driving these transformations remains largely the same. Our experiment and simulation on compressing amorphous granular pillars can thus be seen as a “spatial random number generator” with the initial configuration as the “random number seed”, in contrast to more well-known “temporal random number generator” algorithms; but both types of algorithms tend to give long-term uncorrelated increments for the random walker.
V Simulation of Size-Dependent Pillar Deformation
Having achieved good agreement between experiment and simulation for the pillar, we now take advantage of the fact that our simulation can treat much larger systems than experiment, to study the size-dependent deformation behavior of the granular pillars by simulation. Three large-sized pillars, denoted by , and , are deformed by the top bar moving at the same deformation speed . The aspect ratio of the pillars (2 to 1) is fixed to be the same value of the pillar. As the initial packing density of the particles in the pillar is also the same, the initial width of the pillars scales as .
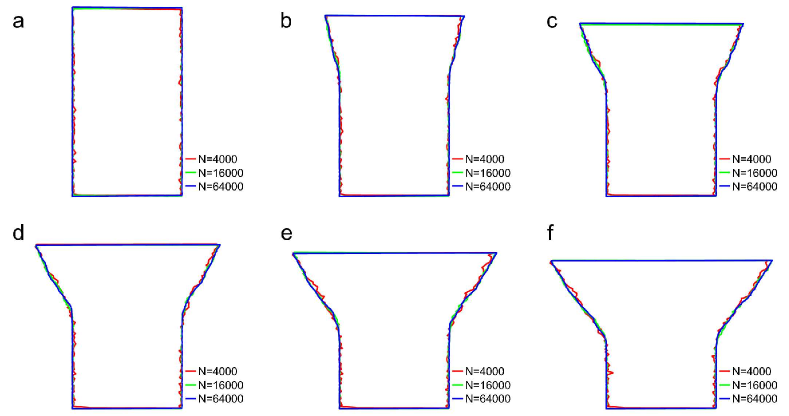
We find the macroscopic shape evolution of the different-sized pillars is self-similar during deformation. At the same values of deformation strain , we extract the boundaries of the pillars, rescale them by the respective initial pillar width , and plot them together in Fig. 9. The rescaled boundaries of the pillars are nearly identical to each other. This also implies that, the width of the top edge of a pillars divided by its original width , is to a good approximation only a function of strain but not the pillar size, namely , where the scaling function does not depend on the pillar width .
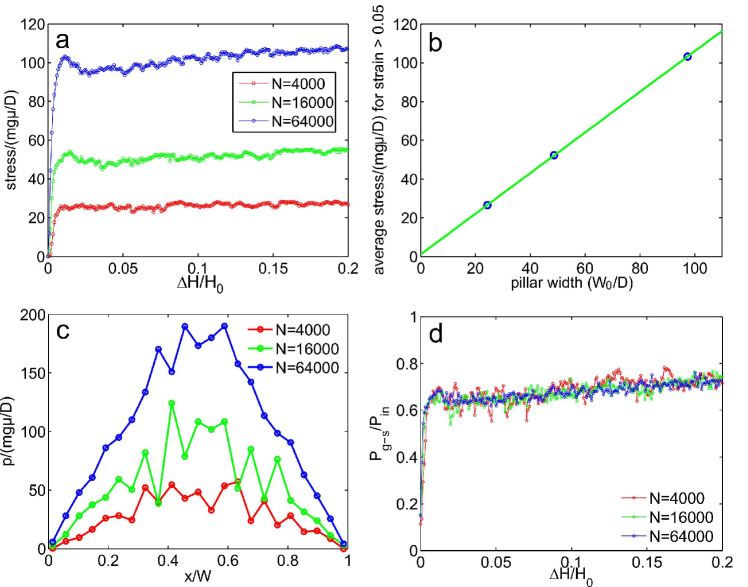
We also find that, the average flow stress of the pillars increases linearly with the initial pillar width , as shown in Fig. 10(a-b). Mathematically, this can be expressed as , where we define to be the average flow stress for strain between 0.05 and 0.2. This scaling behavior for the flow stress indicates that, for the 2D disordered granular pillars, the behavior of “smaller is weaker” is exhibited. This is quite different from the deformation of free-standing metallic glass pillars, where “smaller is stronger” is the general trend Wang et al. (2012); Jang and Greer (2010).
To understand the surprising size dependence of flow stress, we first look at the stress distribution in the pillars. In Fig. 5 we have shown that the grains in the interior region of the pillar experience larger inter-particle contact forces, resulting in larger local stress in the interior region of the pillar. The rate of increase for local stress as a function of distance to the lateral edges of the pillars is found to be very close for different-sized pillars. Such stress non-uniformity should also be reflected in the local contact pressure between the moving bar and the pillar. Indeed, we find that the contact pressure is also spatially rather non-uniform. Fig. 10c shows that, the local contact pressure increases almost linearly from near zero at the edge of pillar to saturated values around the center of contact interface. The maximum values of local contact pressure scale roughly linearly with pillar width, consistent with the linear scaling of pillar flow stress.
Since the pillars are deformed quasistatically, most of the deformation work on the pillars will be dissipated during plastic flow. The flow stress is therefore closely related to the dissipation of energy in the systems. We hence study how the energy dissipation in the pillars changes with pillar size. As the granular particles in the pillars stand on a substrate, two major mechanisms of energy dissipation during plastic flow can be identified: one is due to the grain-substrate friction and the other can be attributed to the grain-grain friction. The total external power input by the moving bar into the pillar, denoted by , can be calculated as
| (20) |
We have shown that, compared at the same deformation strain , both the flow stress and pillar width are proportional to the initial pillar width . Hence, the input power by the external force scales quadratically with , namely . As most of the input power will be dissipated in the plastic flow regime, the dissipated power should also scale with . To study how the dissipated power is distributed between the substrate-induced friction and grain-grain friction, we compute the fraction of input power dissipated by the grain-substrate frictional force and study its size dependence. The amount of power dissipated by the grain-substrate friction force, denoted by , can be calculated as
| (21) |
where the particle mean velocity has the same definition as in Eq. 13, namely the average displacement of the particle within a small time interval . The fraction of power dissipated by the substrate-induced friction, denoted by , is then given by . We calculate the values of for different sized pillars and plot them as a function of deformation strain in Fig. 10d. The result indicates that is statistically independent of pillar size. This allows us to conclude that the amount of input power dissipated by grain-substrate friction, , also scales quadratically with pillar size , and hence scales linearly with the number of particles in the pillar . This effectively means that the number of particles participating in the plastic flow scales linearly with the total number of particles in the pillar, which is consistent with the self-similar shape evolution of the pillars.
The calculated values of in Fig. 10d indicate that the majority of deformation work is dissipated by the friction between the particles in the pillar and the substrate. Substrate friction therefore must play an important role in the linear increase of flow stress with respect to pillar width and the self-similar evolution of pillar shape, which have been shown to be consistent with each other. The granular pillars in our study are not truly two-dimensional due to the presence of grain-substrate friction. This setup is however necessary for stable plastic flow of the uniaxially deformed granular pillars without cohesive interparticle interaction. Without the grain-substrate friction, the deformation behavior of the granular pillars are expected to be quite different, and the size-dependent deformation behavior observed in this study (i.e. “smaller is weaker”) may no longer hold.
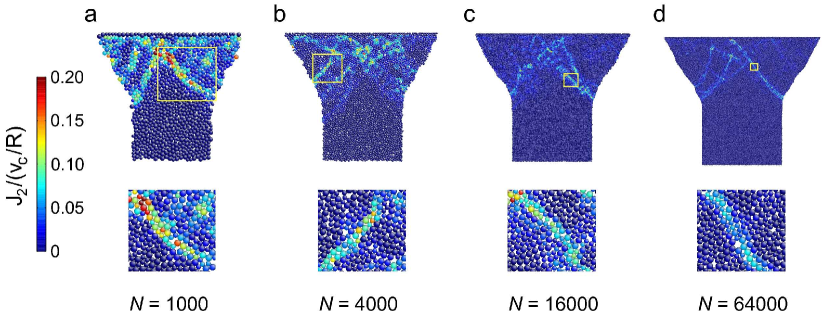
If the macroscopic shape evolution of the pillars in our systems is self-similar, then how does the local yielding behavior vary with pillar size? We characterize the deformation-induced local structural change of the pillar by computing the deviatoric strain rate associated with each particle between two stages of deformation, using the same methodology described earlier in the article. We find that, within a small amount of pillar strain, particles with large values of organize into thin shear lines, which becomes more evident as pillar size increases, as shown in Fig. 11. These shear lines orient along the direction about 45 degree to the direction of uniaxial compression. Clearly, such shear lines form along the direction of maximum shear stress. The sharpest shear lines appear predominantly at the moving boundary between the deformed and undeformed region in the pillars, as we have mentioned earlier when discussing the combined experimental and simulation study of small-sized pillars. A close-up view of these shear lines in Fig. 11 indicates that the width of the shear lines does not change as pillar size increases, maintaining a value about twice the diameter of a grain. We emphasize that these shear lines are transient in time. As deformation goes on, new shear lines will form elsewhere in the pillar, while the particles in the shear lines formed earlier may not accumulate significant amount of shear strain continuously. Evidence of such transient shear bands in granular materials was previously reported in the discrete element simulations by Aharonov and Sparts Aharonov and Sparks (2002) and Kuhn Kuhn (1999, 2003). Maloney and Lemaître Maloney and Lemaître (2006), and Tanguy et al. Tanguy et al. (2006) observed transient lines of slip in their athermal, quasistatic simulation of 2D glasses of frictionless particles, and explained their formation in terms of elastic coupling and cascading of shear transformation zones. The results of our combined experiment (Fig. 5) and simulation of uniaxial, quasistatic deformation of 2D granular pillars clearly demonstrate the existence of such transient shear lines, which carry localized deformation in the granular pillars.
The size-independent width of the transient shear lines is surprising since the overall macroscopic shape of the pillar is self-similar in systems of different sizes. Despite the self-similarity at the macroscopic scale, the system is not self-similar in how it yields at the microscopic scale. Since the slip lines are independent of system size, there must be more of them in larger systems, which is indeed observed in our simulation. Why the system chooses to be self-similar at the macroscopic scale but not at the microscopic scale is an interesting point for future study.
VI Concluding Remarks
We have carried out combined experiments and simulations of the quasistatic, uniaxial deformation of 2D amorphous granular pillars on a substrate. The simulation model developed in this article achieves excellent quantitative match to the experiment. In particular, we find that, for the granular packings, the non-affine displacements of the particles exhibit exponential crossover from ballistic motion to diffusion-like growth behavior with respect to local deviatoric strains. This result is a generalization to inhomogeneous loading of earlier observations of stress-driven diffusion of particles in simulated 2D molecular glasses under simple shear or pure shear in the thermal, quasistatic limit Ono et al. (2002); Tanguy et al. (2006); Lemaître and Caroli (2007); Maloney and Robbins (2008); Lemaître and Caroli (2009); Martens et al. (2011). Because in our study the “time” variable for diffusion, the best-fit deviatoric strain in a neighborhood, is a local measure of deformation and shear transformation, we expect that the non-affine displacement should cross over from ballistic to diffusive behavior in amorphous solids under any loading conditions.
In metallic glass pillars, the apparent strength of the pillar and strain localization behavior depends on pillar diameter, manifesting so-called “size-dependent plasticity” behavior Zhao et al. (2014). Often, “smaller is stronger” holds for metallic glasses Wang et al. (2012); Jang and Greer (2010). We have shown that for 2D granular pillars on a substrate, the frictional interaction between the granular particles and the substrate leads to the opposite size-dependent response, namely “smaller is weaker”.
Finally, our combined experiment and simulation study clearly demonstrate that transient lines of slip form in quasistatically deformed amorphous granular pillars under uniaxial loading condition. These system-spanning shear lines carry localized shear transformations in 2D granular pillars, and their width shows no size dependence. Altogether, these results could have important implications for the plasticity and internal structural evolution of amorphous solids.
VII Acknowledgement
We acknowledge support by the UPENN MRSEC, NSF-DMR-1120901. This work was partially supported by a grant from the Simons Foundation (#305547 to Andrea Liu).
References
- Greer et al. (2013) A. L. Greer, Y. Cheng, and E. Ma, Mater. Sci. Eng. R-Rep. 74, 71 (2013).
- Falk and Langer (2011) M. L. Falk and J. S. Langer, Annu. Rev. Condens. Matter Phys. 2, 353 (2011).
- Jaeger et al. (1996) H. M. Jaeger, S. R. Nagel, and R. P. Behringer, Rev. Mod. Phys. 68, 1259 (1996).
- de Gennes (1999) P. de Gennes, Rev. Mod. Phys. 71, S374 (1999).
- Ono et al. (2002) I. K. Ono, C. S. O’Hern, D. J. Durian, S. A. Langer, A. J. Liu, and S. R. Nagel, Phys. Rev. Lett. 89, 095703 (2002).
- Wang et al. (2013) C.-C. Wang, Y.-W. Mao, Z.-W. Shan, M. Dao, J. Li, J. Sun, E. Ma, and S. Suresh, Proc. Natl. Acad. Sci. U.S.A. 110, 19725 (2013).
- Falk and Langer (1998) M. L. Falk and J. S. Langer, Phys. Rev. E 57, 7192 (1998).
- (8) J. M. Rieser et al., Unpublished.
- O’Hern et al. (2003) C. S. O’Hern, L. E. Silbert, A. J. Liu, and S. R. Nagel, Phys. Rev. E 68, 011306 (2003).
- Johnson (1985) K. L. Johnson, Contact Mechanics (Cambridge University Press, 1985).
- Silbert et al. (2001) L. E. Silbert, D. Ertaş, G. S. Grest, T. C. Halsey, D. Levine, and S. J. Plimpton, Phys. Rev. E 64, 051302 (2001).
- Cundall and Strack (1979) P. A. Cundall and O. D. L. Strack, Geotechnique 29, 47 (1979).
- Silbert et al. (2002) L. E. Silbert, G. S. Grest, and J. W. Landry, Phys. Rev. E 66, 061303 (2002).
- Landry et al. (2003) J. W. Landry, G. S. Grest, L. E. Silbert, and S. J. Plimpton, Phys. Rev. E 67, 041303 (2003).
- Brewster et al. (2005) R. Brewster, G. S. Grest, J. W. Landry, and A. J. Levine, Phys. Rev. E 72, 061301 (2005).
- Zhang and Makse (2005) H. P. Zhang and H. A. Makse, Phys. Rev. E 72, 011301 (2005).
- Rycroft et al. (2006a) C. H. Rycroft, G. S. Grest, J. W. Landry, and M. Z. Bazant, Phys. Rev. E 74, 021306 (2006a).
- Rycroft et al. (2006b) C. H. Rycroft, M. Z. Bazant, G. S. Grest, and J. W. Landry, Phys. Rev. E 73, 051306 (2006b).
- Kamrin et al. (2007) K. Kamrin, C. H. Rycroft, and M. Z. Bazant, Model. Simul. Mater. Sci. Eng. 15, S449 (2007).
- Rycroft et al. (2009a) C. H. Rycroft, A. V. Orpe, and A. Kudrolli, Phys. Rev. E 80, 031305 (2009a).
- Rycroft et al. (2009b) C. H. Rycroft, K. Kamrin, and M. Z. Bazant, J. Mech. Phys. Solids 57, 828 (2009b).
- Shimizu et al. (2007) F. Shimizu, S. Ogata, and J. Li, Mater. Trans. 48, 2923 (2007).
- Chaikin and Lubensky (2000) P. M. Chaikin and T. C. Lubensky, Principles of Condensed Matter Physics (Cambridge University Press, 2000).
- Argon and Kuo (1979) A. S. Argon and H. Y. Kuo, Mat. Sci. Eng. 39, 101 (1979).
- Argon (1979) A. S. Argon, Acta Metall. 27, 47 (1979).
- Zhao et al. (2013) P. Zhao, J. Li, and Y. Wang, Int. J. Plasticity 40, 1 (2013).
- Zhao et al. (2014) P. Zhao, J. Li, and Y. Wang, Acta Mater. 73, 149 (2014).
- Wang et al. (2012) C.-C. Wang, J. Ding, Y.-Q. Cheng, J.-C. Wan, L. Tian, J. Sun, Z.-W. Shan, J. Li, and E. Ma, Acta Mater. 60, 5370 (2012).
- Jang and Greer (2010) D. Jang and J. R. Greer, Nat. Mater. 9, 215 (2010).
- Aharonov and Sparks (2002) E. Aharonov and D. Sparks, Phys. Rev. E 65, 051302 (2002).
- Kuhn (1999) M. R. Kuhn, Mech. Mater. 31, 407 (1999).
- Kuhn (2003) M. R. Kuhn, Granul. Matter 4, 155 (2003).
- Maloney and Lemaître (2006) C. E. Maloney and A. Lemaître, Phys. Rev. E 74, 016118 (2006).
- Tanguy et al. (2006) A. Tanguy, F. Leonforte, and J.-L. Barrat, Eur. Phys. J. E 20, 355 (2006).
- Lemaître and Caroli (2007) A. Lemaître and C. Caroli, Phys. Rev. E 76, 036104 (2007).
- Maloney and Robbins (2008) C. E. Maloney and M. O. Robbins, J. Phys.: Condens. Matter 20, 244128 (2008).
- Lemaître and Caroli (2009) A. Lemaître and C. Caroli, Phys. Rev. Lett. 103, 065501 (2009).
- Martens et al. (2011) K. Martens, L. Bocquet, and J.-L. Barrat, Phys. Rev. Lett. 106, 156001 (2011).