Measuring the growth of galaxy clusters
Abstract:
We suggest how we can use the mass profile of galaxy clusters beyond their virial radius to measure their mass accretion rate, a key prediction of structure formation models. The mass profile can be estimated by applying the caustic technique to dense redshift surveys of clusters and their outskirts, where dynamical equilibrium does not necessarily hold. An additional probe of the mass growth of clusters is their mass fraction in substructures. We show that the caustic technique, that identifies cluster substructures as a by-product, returns catalogs of substructures with mass larger than a few that are between 60% and 80% complete, depending on the density of the redshift survey.
1 The mass accretion rate of galaxy clusters
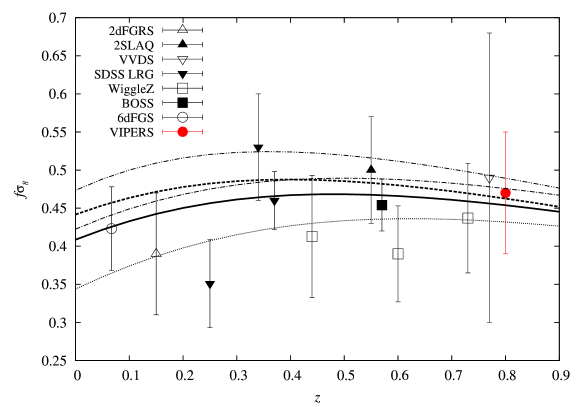
In the next decade or two, ongoing and upcoming wide-field imaging and spectroscopic redshift surveys (e.g., DES, eBOSS, DESI, PFS, LSST, Euclid, WFIRST) aim to measure the growth rate of cosmic structure on linear and mildly non-linear scales, up to wave numbers Mpc-1, in the redshift range . A quantity that has been commonly measured is , where , is the scale factor, the linear growth factor, and the normalization of the power spectrum of the density perturbations. The claimed accuracy of the growth rate measured, for example, with Euclid is 1% to 2.5% in the redshift range [1]; however, current measures of based on redshift space distortions up to redshift are affected by uncertainties between 10% and 50% [2] (Figure 1). Combining galaxy-galaxy lensing with redshift-space distortions is a promising improvement that, however, is not yet accurate enough to discriminate among different cosmological models and modified gravity theories [4].
On very non-linear scales, above the wave numbers Mpc-1, the measurement of the growth rate of individual dark matter halos has only been attempted on the scales of galaxies: by combining the number of observed pairs of close or disturbed galaxies with the merger probability and time scale derived from -body simulations, we can infer the galaxy-galaxy merger rate [5, 6, 7]. However, current results are inconclusive [5]: in fact, the merger rate of dark matter haloes and the merger rate of galaxies are related by dissipative processes that are difficult to model [8] and these two rates do not necessarily coincide [9, 10, 11].
Dissipative processes are less relevant during the mass accretion of galaxy clusters, whose rate could be simply estimated based on the measurement of the amount of mass in the cluster outskirts. However, this advantage over the galaxy-galaxy merger rate has never been capitalized because, in the large and less dense cluster outskirts, (1) cluster galaxies are difficult to distinguish from foreground and background galaxies, and (2) other probes, e.g. X-ray emission, are below the sensitivity of current instruments. Moreover, the cluster outskirts are not in dynamical equilibrium and the usual mass estimation methods based on virial equilibrium are inappropriate.
This observational deficiency clashes with the numerous and detailed studies of the mass growth of galaxy clusters in -body simulations based on the identification of their merger trees [9, 12, 13, 14, 15]. Various laws for the average mass accretion history of dark matter halos have been proposed: (1) where is the halo mass at the formation redshift of the halo [16]; (2) [12]; (3) [13, 17]. The discrepancies between the various relations are due to different mass and time resolutions and different halo statistics of the -body simulations used to infer the relations.
The Caustic group111www.dfg.unito.it/ricerca/caustic in Torino has started a project aiming at estimating the mass accretion rate of galaxy clusters by measuring the mass of a spherical shell surrounding the cluster and its infall time. This approach is rather crude when compared with the stochastic aggregation of dark matter halos in the hierarchical clustering formation models. Nevertheless, our preliminary results are promising: they suggest that measuring the mass accretion rate of galaxy clusters is actually feasible and can potentially provide a new observational test of the cosmological and structure formation models.
2 Cluster mass profiles in the outer regions: the caustic method
If we can measure the mass profile of a cluster beyond its virial radius , we can estimate its instantaneous mass accretion rate as
| (1) |
where . Equation (1) assumes that a shell of proper radii and takes a cosmic time to fall onto the cluster with constant acceleration and null initial velocity. We keep Gyr fixed with redshift and accordingly vary , where is the Hubble parameter. The additional factor corrects for the transformation from the cosmic time to the infall time derived with the proper radii and [18].
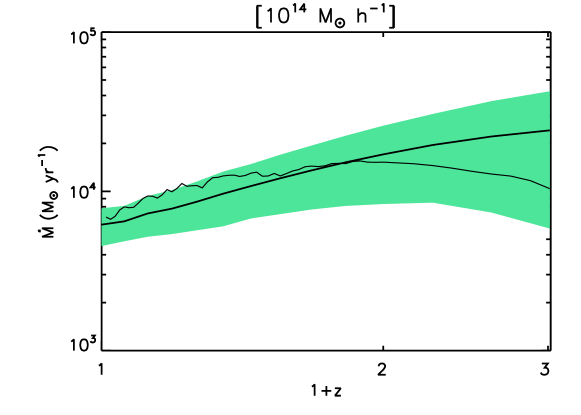
Figure 2 shows how this simple recipe compares with the CoDECS -body simulation [19] of clusters in a CDM model. The thick line shows the mean computed with equation (1) for a sample of clusters with at , whereas the thin line is the mean mass accretion rate obtained from the merger trees of the dark matter halos. The mean accretion rate from the merger trees lie in the region of one standard deviation of our (shaded area). In addition, the mean rate from the merger trees is recovered by the mean of our prescription within 20% in the redshift range .
The results of Figure 2 show that estimating the mass accretion rate of clusters is indeed feasible if we can measure the cluster mass profile beyond . This measurement can be performed with the caustic technique. The caustic technique [20, 21, 22] uses the celestial coordinates and redshifts of galaxies to estimate the gravitational potential and mass profiles of a cluster from the central region to radii much larger than the virial radius. The caustic technique (i) does not rely on the dynamical equilibrium of the cluster; (ii) measures the three-dimensional distribution of mass, based on the assumption of spherical symmetry; (iii) estimates a mass that is unaffected by the presence of substructures within the cluster [21, 22] and by structures along the line of sight [23]; (iv) can be applied to clusters at any redshift and it is only limited by the telescope time required to measure a sufficiently large number of galaxy redshifts. A robust estimate of the cluster mass out to requires galaxy redshifts [22]. Figure 3 shows how, with this number of redshifts in the field of view of a cluster, the caustic technique recovers the mass profile up to with no bias (solid squares) and with a relative uncertainty of 20% (error bars). The required number of galaxies for such an accurate estimate was demandingly large in the late nineties, when the technique was designed, but, thanks to the development of multi-fiber spectroscopy, it is a feasible target nowadays.

The measurement of a cluster mass accretion rate is tightly linked to the estimate of the total mass of the cluster within its turnaround radius, the so-called ultimate mass [25]: with the caustic technique, by combining the 50 CIRS clusters [25] with the 58 HeCS clusters [26], we found , a measure accurate to 5% [26]. Our measure agrees with the CDM prediction, where has a log-normal distribution with a peak at mass ratio 2.2 and dispersion 0.38 [27]. The accuracy of this unique estimate of the ultimate mass suggests that we can aim to measure the mass accretion rate with the caustic technique to a 20% accuracy or better.

In principle, we could also estimate the mass in the outskirts of clusters with weak gravitational lensing analyses. However, the major source of uncertainty with this approach is the mass projected along the line of sight. This uncertainty increases with decreasing cluster mass and increases with increasing radius. More importantly, the uncertainty increases at both lower and higher redshifts. Figure 3 shows that the expected accuracy of the caustic technique is a factor of two better than the accuracy expected with weak lensing for clusters at , and a factor of four better for clusters at [24, 29]. Finally, for the accretion rate estimate, the caustic method can be applied to clusters at any redshift, whereas weak lensing is basically limited to clusters within the redshift range 0.1-0.5 [24, 29].
Figure 4 shows a remarkable example of how a superposition along the line of sight can affect the weak lensing mass: the two clusters A750 and MS0906 are almost aligned along the line of sight and the weak lensing mass of MS0906 is approximately the sum of the masses of the two clusters; a sufficiently dense redshift survey shows that the two clusters are distinct and the caustic technique can easily estimate their individual masses [23].
3 Identification of cluster substructures with the caustic technique
An additional diagnostic of the mass growth of clusters is the presence of substructures in the central region and the outskirts of the cluster. The first most serious difficulty of this approach is the identification of substructures. Suggested methods are based on the distribution of galaxies in redshift space [30], X-ray emission [31, 32], and gravitational lensing [33] (see [34] for additional references). Some investigations have attempted to use this piece of information to constrain the dynamical state of clusters or their formation time (see e.g., [35, 36, 37, 38]).
With optical observations, the best approach clearly is to combine galaxy positions and redshifts. The first step of the caustic method is to arrange the galaxies in a binary tree based on a galaxy pairwise projected binding energy, similarly to the method proposed by Serna and Gerbal [39]. However, the caustic method goes further and identifies two thresholds that separate the branches of the binary tree and provide a list of groups and a list of substructures from the cluster center out to its outskirts.
The substructures identified in redshift space can correspond to real substructures or can be due to chance alignment; in addition, some of the real substructures of the cluster may not be identified. The number of false detections and the completeness of the substructure sample depend on the cluster mass, on the substructure mass and, crucially, on the density of the redshift survey. When applied to mock redshift surverys of clusters extracted from -body simulations, with typical properties of surverys like CIRS [25] and HeCS [26], namely redshifts within and cluster mass , of the substructures identified with the caustic technique are false detections, while the completeness is between 60% and 80% for substructures masses larger than a few [34].
We thus conclude that the caustic technique appears to be a very promising method to identify substructures
in galaxy clusters. In future work, we will investigate how this technique compares with
methods based on X-ray and gravitational lensing studies.
I am grateful to my collaborators Ana Laura Serra, Cristiano De Boni, and Heng Yu for making this old idea come true and for allowing me to show results from our common projects. I thank Christian Marinoni and the other organizers of Frontiers of Fundamental Physics 14 for giving me the opportunity of illustrating this project at its early stage. I am thankful to Margaret Geller and Ken Rines for our long-lasting collaboration and the countless enlightening discussions on galaxy clusters over the years. I acknowledge partial support from the grant Progetti di Ateneo/CSP TO Call2 2012 0011 ”Marco Polo” of the University of Torino, the INFN grant InDark, and the grant PRIN 2012 ”Fisica Astroparticellare Teorica” of the Italian Ministry of University and Research.
References
- [1] L. Amendola, et al., 2013, Living Reviews in Relativity, 16, 6
- [2] C. Howlett, A. Ross, L. Samushia, W. Percival, M. Manera, 2014, MNRAS, submitted [arXiv:1409.3238]
- [3] S. de la Torre, et al., 2013, A&A, 557, A54
- [4] R. Reyes, R. Mandelbaum, U. Seljak, T. Baldauf, J. E. Gunn, L. Lombriser, R. E. Smith, 2010 Nature, 464, 256
- [5] J. M. Lotz, P. Jonsson, T. J. Cox, D. Croton, J. R. Primack, R. S. Somerville, K. Stewart, 2011, ApJ, 742, 103
- [6] H.-Y. Jian, L. Lin, T. Chiueh, 2012, ApJ, 754, 26
- [7] K. R. V. Casteels, et al., 2014, MNRAS, 445, 1157
- [8] P. F. Hopkins, T. J. Cox, L. Hernquist, D. Narayanan, C. C. Hayward, N. Murray, 2013, MNRAS, 430, 1901
- [9] O. Fakhouri, C.-P. Ma, 2008, MNRAS, 386, 577
- [10] Q. Guo, S. D. M. White, 2008, MNRAS, 384, 2
- [11] B. P. Moster, T. Naab, S. D. M. White, 2013, MNRAS, 428, 3121
- [12] F. C. van den Bosch, 2002, MNRAS, 331, 98
- [13] J. McBride, O. Fakhouri, C.-P. Ma, C.-P. 2009, MNRAS, 398, 1858
- [14] O. Fakhouri, C.-P. Ma, M. Boylan-Kolchin, 2010, MNRAS, 406, 2267
- [15] C. Giocoli, G. Tormen, R. K. Sheth, 2012, MNRAS, 422, 185
- [16] R. H. Wechsler, J. S. Bullock, J. R. Primack, A. V. Kravtsov, A. Dekel, 2002, ApJ, 568, 52
- [17] A. Tasitsiomi, A. V. Kravtsov, S. Gottlöber, A. A. Klypin, 2004, ApJ, 607, 125
- [18] C. De Boni, A. L. Serra, A. Diaferio, C. Giocoli, M. Baldi, 2015, Apj, submitted, [arXiv:1501.01977]
- [19] M. Baldi, 2012, MNRAS, 422, 1028
- [20] A. Diaferio, M. J. Geller, 1997, ApJ, 481, 633
- [21] A. Diaferio, 1999, MNRAS, 309, 610
- [22] A. L. Serra, A. Diaferio, G. Murante, S. Borgani, 2011, MNRAS, 412, 800
- [23] M. J. Geller, A. Diaferio, K. J. Rines, A. L. Serra, 2013, ApJ, 764, 58
- [24] H. Hoekstra, 2003, MNRAS, 339, 1155
- [25] K. Rines, A. Diaferio, 2006, AJ, 132, 1275
- [26] K. Rines, M. J. Geller, A. Diaferio, M. J. Kurtz, 2013, ApJ, 767, 15
- [27] M. T. Busha, A. E. Evrard, F. C. Adams, R. H. Wechsler, 2005, MNRAS, 363, L11
- [28] H. Hoekstra, 2007, MNRAS, 379, 317
- [29] H. Hoekstra, J. Hartlap, S. Hilbert, E. van Uitert, 2011, MNRAS, 412, 2095
- [30] A. Dressler, S. A. Shectman, 1988, AJ, 95, 985
- [31] J. J. Mohr, D. G. Fabricant, M. J. Geller, 1993, ApJ, 413, 492
- [32] V. Parekh, K. van der Heyden, C. Ferrari, G. Angus, B. Holwerda, 2014, A&A, in press, [arXiv:1411.6525]
- [33] M. Shirasaki, 2014, ApJ, in press, [arXiv:1407.5350]
- [34] H. Yu, A. L. Serra, A. Diaferio, 2015, in preparation
- [35] J. J. Mohr, M. J. Geller, G. Wegner, G. 1996, AJ, 112, 1816
- [36] G. P. Smith, J. E. Taylor, 2008, ApJL, 682, L73
- [37] S. Deb, A. Morandi, K. Pedersen, S. Riemer-Sorensen, D. M. Goldberg, H. Dahle, 2012, ApJ, submitted, [arXiv:1201.3636]
- [38] D. Lemze, et al. 2013, ApJ, 776, 91
- [39] A. Serna, D. Gerbal, 1996, A&A, 309, 65