Data quality monitoring in the presence of aerosols and other adverse atmospheric conditions with H.E.S.S.
Abstract
Cherenkov telescope experiments, such as H.E.S.S., have been very successful in astronomical observations in the very-high-energy (VHE; E 100 GeV) regime. As an integral part of the detector, such experiments use Earth’s atmosphere as a calorimeter. For the calibration and energy determination, a standard model atmosphere is assumed. Deviations of the real atmosphere from the model may therefore lead to an energy misreconstruction of primary gamma rays. To guarantee satisfactory data quality with respect to difficult atmospheric conditions, several atmospheric data quality criteria are implemented in the H.E.S.S. software. These quantities are sensitive to clouds and aerosols. Here, the Cherenkov transparency coefficient will be presented. It is a new monitoring quantity that is able to measure long-term changes in the atmospheric transparency. The Cherenkov transparency coefficient derives exclusively from Cherenkov data and is quite hardware-independent. Furthermore, its positive correlation with independent satellite measurements, performed by the Multi-angle Imaging SpectroRadiometer (MISR), will be presented.
1 Introduction
During the last three decades, imaging atmospheric Cherenkov telescopes (IACTs) have qualified as powerful instruments for gamma-ray astronomy in the very-high-energy (VHE; E 0.1 TeV) regime, allowing detailed studies of the most violent phenomena known in the Universe. The gamma-ray flux at these energies is rather low and the IACT technique provides the large effective areas required making use of telescopes on the ground. Due to its opacity at these energies, the Earth’s atmosphere acts as the calorimeter of the detector system; therefore, the VHE photons can be observed only indirectly at ground level. One of the main strengths of this type of detector is its low energy threshold, which unfortunately increases with the atmospheric absorption. The atmospheric absorption will also affect the reconstruction of the energy of the primary particle, since shower images are compared to Monte Carlo shower simulations for which nominal hardware parameters and average atmospheric conditions at the H.E.S.S. site (23∘16’18” S, 16∘30’00” E, 1800 m a.s.l) are assumed [2][4]. However, this comparison might be affected by changes in the telescope efficiency, which include not only changes in the optical efficiency and photo-sensor response but also atmospheric fluctuations. Any atmospheric phenomenon that acts as a light absorber will attenuate Cherenkov light from EAS (Extensive Air Shower) particles and therefore reduce the amount of Cherenkov photons that reach the detector, which will cause an underestimation of the energy of the primary gamma ray. This is especially problematic for spectral analysis, since mis-reconstructed energies lead to biased values of the flux normalization and, in particular, in the case of non-power-law spectra, other spectral parameters [13]. To limit such effects to a minimum, corresponding monitoring quantities have to be used in the Cherenkov technique in order to detect data that are taken in the presence of clouds and aerosols111The technical framework presented in this document is specific to the H.E.S.S. Analysis Program in Heidelberg (hap-HD).. These data quality quantities are applied in an automated and uniform way to the data set. This guarantees a well-defined and reproducible data selection which is especially important for the analysis of large amounts of data, as for example in surveys. We will introduce the most important atmospheric conditions that affect spectral shower reconstruction. Furthermore, we want to present a new way to estimate the atmospheric transparency by using only observables and calibration parameters from the Cherenkov data taken with the H.E.S.S. telescope array and a detailed comparison of this new atmospheric monitoring quantity with MISR (Multi-angle Imaging SpectroRadiometer) satellite data. Finally, the last part will contain a short systematic study on the effect of the atmospheric transparency on reconstructed spectral parameters.
2 Atmospheric Effects And Their Detection
2.1 Clouds
The maximum of the Cherenkov emission from air showers triggered by particles of energies within the H.E.S.S. energy domain (E 300 GeV) is at altitudes between 6-11 km (see [4]). Therefore, any atmospheric light-absorbing structure situated at or below such altitudes might at least partially attenuate the Cherenkov light from the shower. As a result, fewer photons reach the cameras, which leads to a decreased trigger probability and ultimately lower single telescope and central trigger rates [8].
If absorbing structures (local clouds) are passing through the field-of-view, a fluctuating behavior in the central trigger rate222Here, all trigger rates are assumed to be corrected for the decrease that goes with increasing the observational zenith-angle. on time-scales smaller than the standard duration of data sets (typically, a 28-min run) can be observed. Observations taken under such atmospheric conditions can be identified by
-
•
(i) fluctuations in the central trigger rate, if caused by rather small-scale absorbers (e.g. small clouds)
-
•
(ii) steady decline in the central trigger rate, if connected to large-scale absorbing structures moving into the field-of-view (e.g. large clouds)
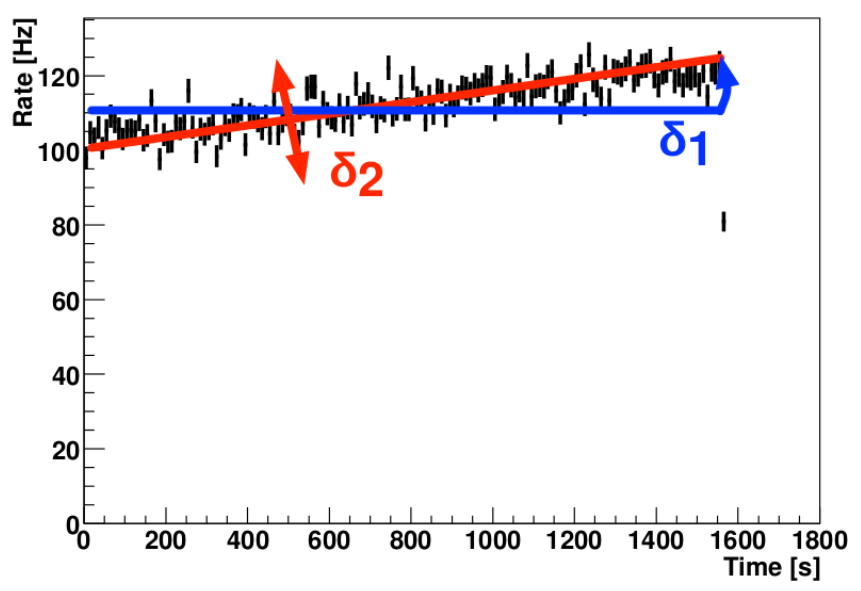
In order to quantify these changes in the central trigger rate for each data set taken with with H.E.S.S., the average central trigger rate is calculated over 10-s time intervals. The resulting evolution of the trigger rate is then fitted by a linear function.
The slope of this function can then be used to address case (ii). As a data quality criterion, the extrapolated trigger rate, obtained by multiplying the slope of the trigger rate evolution with the run duration, is required to be within 30% of the run-averaged value of the trigger rate.
Fluctuations of the central trigger rate (case (i)) can be quantified by the rms of the residuals of the fit. As an atmospheric data monitoring quantity in H.E.S.S., the rms value is divided by the time-averaged central trigger rate. The corresponding quality cut is at 10%.
The derivation of these quantities is also illustrated in Fig.1.
However, these quantities are only sensitive to clouds that affect the central trigger rate on time-scales smaller than the run duration.
2.2 The Cherenkov Transparency Coefficient
The detection of modifications to the central trigger rates on time-scales much larger than the duration of the individual data sets, as resulting from shower attenuation by large-scale absorbing structures like aerosol layers, requires a different approach.
We have developed a new quantity, the Cherenkov transparency coefficient, which is designed to be as hardware-independent as possible in order to separate hardware-related effects from the decrease in trigger rates caused by large-scale atmospheric absorption.
For the definition of the Cherenkov transparency coefficient we assume that the zenith-angle-corrected single telescope trigger rates are dominated by cosmic-ray (CR) protons. The local CR proton spectrum in the relevant energy range is approximately [15]. Hence, the trigger rates can be estimated by
| (1) | |||||
| (2) |
where is the energy threshold and the effective area of the telescopes. The term allows one to take into account higher-order corrections, such as energy-dependent shower profiles. Furthermore, is assumed to be inversely proportional to the average pixel gain [1], the muon efficiency [3] and the atmospheric transparency, parametrized by a factor so that . The quantities and are telescope-specific, so for each telescope one can derive an estimation of ,
Random fluctuations in the trigger of a single telescope are removed by selecting only those events where at least two telescopes are triggered in coincidence. The corresponding trigger rate will therefore depend on the number of active telescopes, so the averaged trigger over all active telescopes is calculated and rescaled by a factor of that depends on the telescope multiplicity. The corresponding values are for observations with three participating telescopes and for observations with four telescopes. This rescaling also cancels out the contribution of other CR species to the trigger rate.
The Cherenkov transparency coefficient () is then defined as
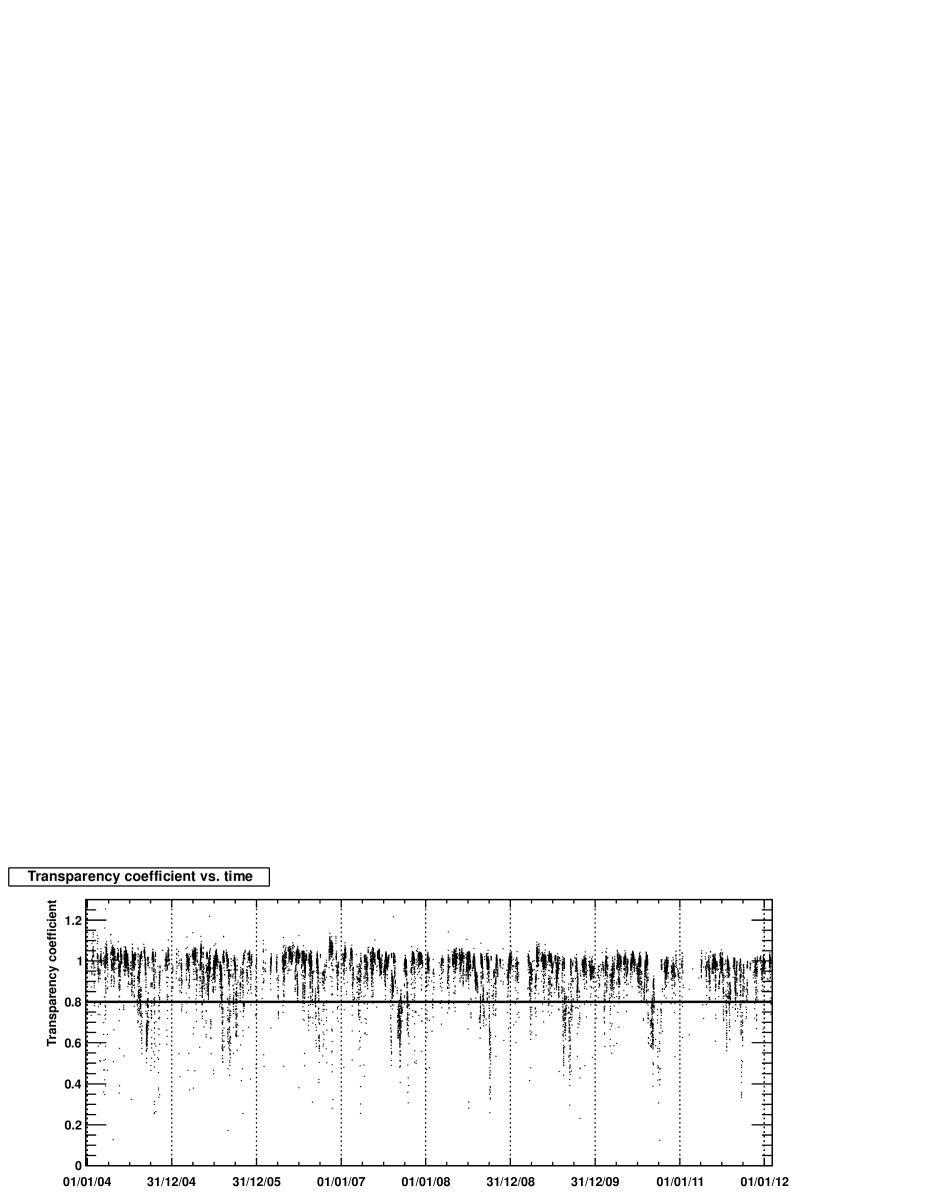
Figure 2 shows the evolution of the Cherenkov transparency coefficient over a time of eight years of H.E.S.S. observations. The quantity is strongly peaked at unity (with a relative FWHM of ) and shows periodic downward-fluctuations around September.
This quantity is used as the third and the last atmospheric data quality parameter with a cut value of 0.8 (see section 4). The cut affects 11% of all runs. The cuts on trigger rate fluctuation and slope, as described in section 2.1, affect 6% and 4% of all runs, respectively. It should be noted that there is a large overlap between the three cuts.
Runs affected by at least one of the three cuts are flagged as not fulfilling the quality standards for spectral reconstruction. However, they can still be used in the creation of images or source detection since for such purposes no spectral information is necessary.
3 Atmospheric Absorption Due To Aerosols
The sensitivity of the Cherenkov transparency coefficient to the concentration of aerosols in the atmosphere will be confirmed through a positive correlation with independent aerosol measurements, such as satellite data. The influence of the atmospheric aerosols on transparency is quite complex and strongly depends on the detailed scattering and absorption properties of the different aerosol types (e.g. sulphate, dust, organic carbon, sea salt) and their relative concentrations in the atmosphere at a given time. Many studies of the atmospheric absorption of aerosols have been carried out, not only for astronomical purposes but also for climate and atmospheric studies. However, we are particularly interested in those related with increases of aerosol absorption due to biomass burning. That is, agricultural biomass burning takes place every year around September in Namibia and its neighboring countries. Aerosols from such processes seem to decrease the amount of UV solar radiation reaching the surface by up to 50%, with typical values in the range of 15-35% [11].
In the following, we will test for a correlation between the Cherenkov transparency coefficient and the Aerosol Optical Depth (AOD), or more specifically with the atmospheric transparency (). The MISR (Multi-angle Imaging SpectroRadiometer) instrument on board NASA’s Terra spacecraft has a better spatial resolution (1.1 km in global mode) [6] with respect to other satellite instruments, and has the capability to observe at different viewing angles, so that MISR can distinguish between different types of atmospheric particles (aerosols), different types of clouds and different land surfaces. The processed (Level 3) AOD data used in this study have proven to be in better agreement with the ground-based Aerosol Robotic Network (AERONET) measurements [16] than previous satellite measurements. In particular, a detailed 10-year study of the aerosol climatology with MISR over South Africa, Namibia’s neighbor country, has revealed that the northern part of South Africa seems to be rich in aerosol reservoirs and the aerosol concentration (based on optical depth) is 34% higher than that in the southern part of the country [16].
Tesfaye et al. (2011) have also found seasonal changes in the aerosol composition in South Africa. During summer and early winter in the southern hemisphere, the northern part of South Africa is dominated by a mixture of coarse-mode and accumulation-mode particles, which are a result of air mass transport from arid/semi-arid regions of the central parts of South Africa, Botswana and Namibia. In the time from August to October (winter and early summer) it is dominated by sub-micron particles. The most important sources of sub-micron particles are industrial and rural activities (including mining and biomass burning). The periodic drops in the Cherenkov transparency coefficient for the H.E.S.S. site (see Fig. 2) correlate with the seasonal increase of sub-micron particles due to, among other sources, biomass burning like in nearby South Africa. This gives an indication of the main atmospheric phenomenon responsible for the reduced trigger rates of some H.E.S.S. observations, especially in early summer, and points to the Cherenkov transparency coefficient as a good data quality parameter to monitor the atmosphere transparency. Therefore, we expect a strong and positive correlation with the AOD measured by satellites. To do this, we used the AOD retrieved from MISR data and the Cherenkov transparency coefficient from H.E.S.S. data. Both data sets cover the same period of time between 2004 and 2011.
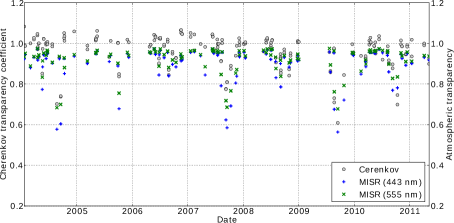

The processed (level 3) MISR AOD data at the H.E.S.S. site (with a grid spatial resolution of 0.5∘ x 0.5∘) at three different wavelengths (443 nm, 555 nm and 670 nm), from UV to red wavelengths were used. Note that the satellite only measures the AOD during daytime and, depending on latitude, the satellite samples a fixed location every 2 to 9 days. The overlap of satellite measurements and H.E.S.S. data taking is therefore sparse within a time interval of overlap of 24 hours, reducing the available data set for the correlation study (only 2% of the H.E.S.S. data can be used). Fig. 4 quantifies the correlation between the atmospheric absorption () for the three different wavelengths measured by MISR and the Cherenkov transparency coefficient. The solid lines are the results of a linear fit between measurements. The Pearson correlation coefficients for the wavelengths 443 and 555 nm (blue and green) are 0.85 and 0.84 respectively. This shows a positive and strong correlation between the atmospheric transparency measured from satellites and the Cherenkov transparency coefficient, in particular for the blue band, which is most relevant for this study since the number of Cherenkov photons emitted per path length in a certain wavelength range (eq. (1) in [4]) is maximum in the UV-blue part of the spectrum.
Figure 4 also shows an increase of the steepness (“m” in the figure) of the best fit of the linear correlation, with increasing wavelength. This is due to the fact that the atmospheric transparency measured with the MISR satellite decreases towards shorter wavelengths, while the Cherenkov transparency coefficient is always the same. The decrease of the atmosphere transmission with decreasing wavelength can be explained by simple Mie scattering. Tesfaye et al. (2011) established an inverse proportionality between the aerosol particle size and their extinction efficiency at a certain wavelength. An increase of the AOD at short wavelengths therefore indicates the presence of sub-micron (radii 0.35 m) particles, attributed by the authors to urban pollution (sulphates) and extensive biomass burning activities (carbonaceous aerosols). As a consequence, the aerosol-induced reduction in the atmosphere transparency is expected to be more pronounced at shorter wavelengths, which is where the bulk of the Cherenkov light is emitted.
4 Systematic Effect On Reconstructed Spectra
In order to investigate systematic effects of the Cherenkov light attenuation of EASs by aerosols on the reconstructed gamma-ray spectrum, as traced by the Cherenkov transparency coefficient , we have analyzed data taken on the Crab Nebula, a standard candle at TeV energies without any detectable variability over timescales of years.
The full data set investigated was recorded during the years from 2004 to 2011 and has an exposure of 84 hours. In order to keep systematic effects arising from the radial acceptance profile in the cameras (see, e.g. [2]) to a minimum, only observations within a one-degree offset from the source were used. Also, to minimize a possible zenith-angle-dependent energy bias, only data taken at zenith angles smaller than 47 degrees have been selected. The data has been divided into subsets corresponding to different ranges of the atmospheric transparency parameter after applying standard quality criteria to remove those runs with technical problems or with small clouds in the field-of-view during the observations [2]. The standard cut-based analysis using simple air shower image parameters, the Hillas analysis [10], was then employed to obtain spectral information for each subset.
The gamma-ray spectrum of the Crab Nebula has been measured by H.E.S.S. [2] and was found to have an approximate power-law shape with some curvature at the highest energies. For a pure power-law fit in the energy range (-) TeV, the flux normalization at , , and the spectral index, , were found to be and .
Assuming that atmospheric absorption leads to an underestimation of the reconstructed energy by a constant attenuation factor, a power-law spectrum is expected to stay form invariant with changing atmospheric conditions. However, this shift in the spectrum energy range is expected to bias the estimated flux normalization at a given reconstructed energy. Quantitatively, assuming the reconstructed gamma-ray energy and the true energy to be related via , one finds
| (3) |
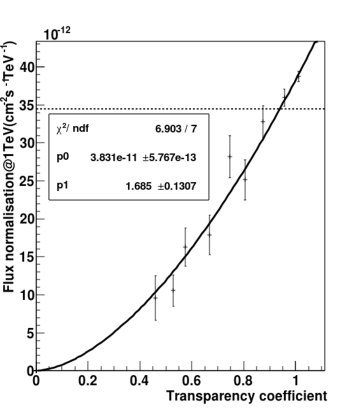
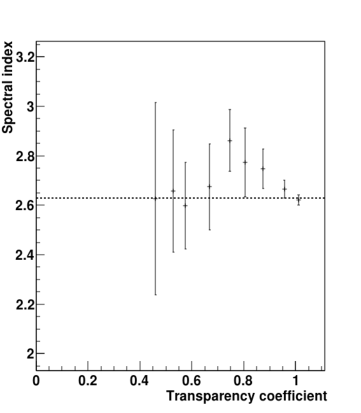
Fig. 5 shows the reconstructed flux normalization as a function of . The data is well fitted by a power law with an exponent and confirms the -dependence as expected from the simple model given by Eq. 3. The reconstructed spectral index shows no significant dependence on .
The application of the presented data quality cuts limits the bias in reconstructed flux normalization to values smaller than 20%.
5 Conclusions
H.E.S.S. uses an uniform and automatic data quality selection scheme featuring three atmospheric data quality quantities. These quantities are designed to identify data taken in the presence of atmospheric absorbers like clouds and aerosols, the former of which are relatively easy to detect by parametrising the time evolution of the central trigger rate within each recorded data set.
On the contrary, large-scale aerosol and cloud layers persist longer in the atmosphere; as a result, their signature on the trigger rate is of a larger time-scale than the typical data set duration.
In order to detect such absorber structures, a new and mostly hardware-independent quantity has been developed, the Cherenkov transparency coefficient . Together with the other atmospheric data quality monitoring quantities, its application as a cut quantity limits the bias in reconstructed flux normalization to values smaller than 20%.
This quantity is sensitive to elevated aerosol concentrations, as confirmed by a strong correlation with independent MISR satellite measurements of aerosol concentrations at blue wavelengths ( nm). However, this correlation might be limited by the low statistics arising from the small temporal overlap of H.E.S.S. and MISR observations as well as the limited amount of H.E.S.S. data with very low values of . Furthermore, this quantity is not able to distinguish between large-scale clouds and aerosols and is based on some simplified assumptions, such as the perfect inverse proportionality between telescope energy threshold and the muon efficiency. Addressing these points might result in a better correlation between the atmospheric absorption measured by satellites and the Cherenkov transparency coefficient. Simultaneous observations of on-site radiometer and LIDAR data and the Cherenkov telescope might also help and are currently under study [17] [5].
The Cherenkov transparency coefficient is currently used as a data quality parameter in H.E.S.S. Previous methods, using other atmosphere-sensitive parameters [14] [12] [7] [13], have been used to correct the flux for changes in atmospheric conditions. The strong correlation with independent atmospheric measurements suggests that the Cherenkov transparency coefficient could be applied in the same way, currently under study, making it possible to use the Cherenkov technique over a wider range of atmospheric conditions.
Furthermore, since all the parameters needed to derive are available from routine calibration and quality checks that are generic to the IACT technique, in principle this quantity can be also implemented in other IACT experiments. Its implementation in the future Cherenkov Telescope Array CTA is also under study.
Acknowledgment: The authors would like to acknowledge the support of their host institutions. We want to thank the whole H.E.S.S. collaboration for their support, especially Prof. Werner Hofmann and Prof. Christian Stegmann as well as Prof. Thomas Lohse and Dr. Ira Jung for the many fruitful discussions.
References
- [1] Aharonian, F. et al., 2004, Astropart.Phys. 22, 109-125.
- [2] Aharonian, F. et al., 2006, AA 457, 899-915.
- [3] Bolz, 2004, PhD thesis
- [4] Bernlöhr, K. , 2000, Astropart.Phys. 12, 255-268.
- [5] Chadwick, P.M. et al., 2013, International Cosmic Ray Conference 2013
- [6] Diner, D.J. et al., 1988, IEEE Trans. Geosci. Rem. Sens., 36, 1072-1087.
- [7] Dorner, D. et al., 2009, A&A, 493, 721.
- [8] Funk, S. et al., 2004, Astropart.Phys. 22, 285-296.
- [9] Hahn, J. et al., 2014, Astropart.Phys. 54, 25-32.
- [10] Hillas, A. M., 1985, International Cosmic Ray Conference 1985, 3, 445-448.
- [11] Kalashnikova, O.V., et al., 2007, Rem. Sens. Environ., 107, 65-80.
- [12] LeBohec, S.; Holder, J., 2003, Astropart. Phys.,19, 221-233.
- [13] Nolan, S.J. et al., 2010, Astropart.Phys. , 34, 304.
- [14] Pühlhofer, G. et al., 2003, Astropart.Phys. , 20, 267.
- [15] Sanuki, T. et al., 2000, ApJ, 545, 1135.
- [16] Tesfaye, M. et al., 2011, Journal Of Geophysical Research, 116, 20216.
- [17] Vasileiadis, G. et al., 2013, International Cosmic Ray Conference 2013.