Meridional circulation dynamics from 3D MHD global simulations of solar convection
Abstract
The form of the solar meridional circulation is a very important ingredient for mean field flux transport dynamo models. Yet a shroud of mystery still surrounds this large-scale flow, given that its measurement using current helioseismic techniques is challenging. In this work we use results from 3D global simulations of solar convection to infer the dynamical behavior of the established meridional circulation. We make a direct comparison between the meridional circulation that arises in these simulations and the latest observations. Based on our results we argue that there should be an equatorward flow at the base of the convection zone at mid latitudes, below the current maximum depth helioseismic measures can probe (0.75 R⊙). We also provide physical arguments to justify this behaviour. The simulations indicate that the meridional circulation undergoes substantial changes in morphology as the magnetic cycle unfolds. We close by discussing the importance of these dynamical changes for current methods of observation that involve long averaging periods of helioseismic data. Also noteworthy is the fact that these topological changes indicate a rich interaction between magnetic fields and plasma flows, which challenges the ubiquitous kinematic approach used in the vast majority of mean field dynamo simulations.
Subject headings:
dynamo — Sun: evolution — Sun: fundamental parameters — Sun: general — Sun: interior — magnetohydrodynamics (MHD)1. Introduction
The pressing need for a better understanding of space weather phenomenology and its implications has provided impetus for ongoing improvements in solar dynamo models. Nonetheless a fully detailed and consensual picture adequately explaining the origin and evolution of the large-scale solar magnetic field has not yet materialized. Amongst the several types of extant mean-field models, (see review by Charbonneau, 2010), a specific class of dynamo models known as mean-field Babcock-Leighton Flux Transport Dynamos (FTD) has been particularly successful in explaining some of the main observational features of the solar cycle, e.g. (Wang et al., 1991; Dikpati & Charbonneau, 1999; Nandy & Choudhuri, 2002; , 2014). These models rely heavily on the advective role of the meridional circulation (MC), a relatively weak, large-scale plasma flow that its thought to act as a conveyor belt in the convection zone (CZ), transporting magnetic flux in radius and latitude. In these models (running mainly in the kinematic regime), the MC is an important determinant of the period and amplitude of the cycle (Charbonneau, 2010, and references therein).
From an observational point of view, the meridional circulation is known with a good degree of confidence at low to mid latitudes in the photospheric layers of the Sun, through Doppler measurements and tracking of surface features (Ulrich, 2010; Hathaway, 2012). This surface component of the MC appears to play an important role in the inversion of the solar dipole. Observations and surface advection models suggest that it effectively transports the residual field produced by the decay of active regions (the Babcock-Leighton mechanism) towards the poles, contributing to the polarity reversal (, 1961, 2011; Muñoz-Jaramillo et al., 2013). However, in the solar interior, due to the weak nature of this flow, its measurement is experimentally challenging and a complete profile mapping over the whole CZ has not yet been achieved by helioseismology. Since until recently the observational constraints on the MC profile were restricted to the surface layers of the Sun, FTD models employed extrapolations to the solar interior based on mass conservation and simplified MC profiles with one or two cells per hemisphere. Of particular importance is the so-called return flow, an equatorward directed component of the MC at the base of the CZ that, in the context of FTD, is responsible for the equatorward migration of the dynamo wave over the course of the cycle (Wang et al., 1991; Choudhuri, et al., 1995). Even if more complex MC topologies are assumed, this equatorward flow at the base of the CZ retains a preponderant role (, 2014).
Recently, helioseismic measurements by (2013) mapped the MC down to a depth of 0.75 R⊙ for latitudes below 60∘. Based on their measurement they then extrapolate the behavior of the MC all the way down to the base of the CZ and suggest that this large-scale flow is globally structured as an upper cell that rotates counter-clockwise (in the northern hemisphere) and a bottom cell that rotates clockwise. This suggested configuration implies that the flow direction at the base of CZ is poleward directed. See figures 1 and 4a of (2013). However, when this proposed MC cell topology is used in FTD models, solar-like dynamo solutions are no longer produced (see section 3 of (2014)). Though these new observational developments are potentially transformative, we must emphasize that the actual measurements place little constraint on the amplitude and direction of the flow near the base of the CZ, where it matters most for regulating the cycle in FTD.
Another interesting result in need of a theoretical interpretation is the observed variation of the surface MC, the amplitude of which varies in anti-phase with the solar cycle (Komm et al. 2009, Hathaway 2010). This and the development of a high-latitude counter-rotating secondary cell in the descending phase of the cycle (, 2009; Ulrich, 2010), hints at possible changes in the overall topology of the MC over the course of the solar cycle. Understanding how this process occurs requires modelling techniques that are dynamically consistent.
Unlike kinematic dynamo models in which the flows are prescribed and their consequences studied, global convective dynamo simulations self-consistently establish the meridional and zonal flows as a consequence of the internal fluid dynamics, (e.g. Clune et al., 1999; , 2004; Ghizaru et al., 2010; , 2012). In this work we use one such 3D MHD simulation of the solar CZ to explore the topological structure of the MC and its implications within the context of magnetic cycles, helioseismic measurements and mean-field kinematic dynamo simulations.
The data used in this study is obtained from an Implicit Large-Eddy Simulation (ILES) of global solar convection produced by the EULAG-MHD code (Smolarkiewicz, Charbonneau, 2013), more specifically the millennium simulation recently presented in Passos, Charbonneau (2014) (henceforth PC14) and based on a setup described in Ghizaru et al. (2010) and Racine et al. (2011). This simulation is performed on a 1286447 mesh in () which allows long integration times. The numerical dissipation introduced by the ILES scheme amounts to an implicit adaptive subgrid model which maintains numerical stability. In contrast to DNS, information on small-scale dissipation is not readily retrievable, but the resolved scales are dynamically consistent. These simulations reach a turbulent regime characterized by considerable dynamic range when zonal averages are used to define large scales and fluctuations around these averages are used to define small scales, (Racine et al., 2011).
2. Meridional circulation structure
Before we investigate the dynamics of the MC in our simulations, we first assess the degree of resemblance between the simulated meridional flow and the solar MC. In (2013) the authors use helioseismic measurements carried out by SDO (HMI Doppler-shift data) averaged over a two year period, spanning from May 1, 2010 to April 30, 2012 which corresponds to the rising phase of sunspot cycle 24. For our initial assessment we will use a time window corresponding to the same phase of the magnetic cycle in our simulation. To represent solar magnetic activity we built a proxy for the large-scale magnetic field by integrating the zonally averaged toroidal field over an extended region centered at the depth and latitudes where the field accumulates (see Fig. 1b), following the procedure described in detail in PC14. This toroidal proxy is our analog of the sunspot number. The large-scale magnetic cycle developing in this simulation shows regular polarity reversals with a period on the order of 40 years, with the large-scale magnetic field peaking at the base of the convection zone at mid/high latitudes (see figures 1 and 2 of PC14).
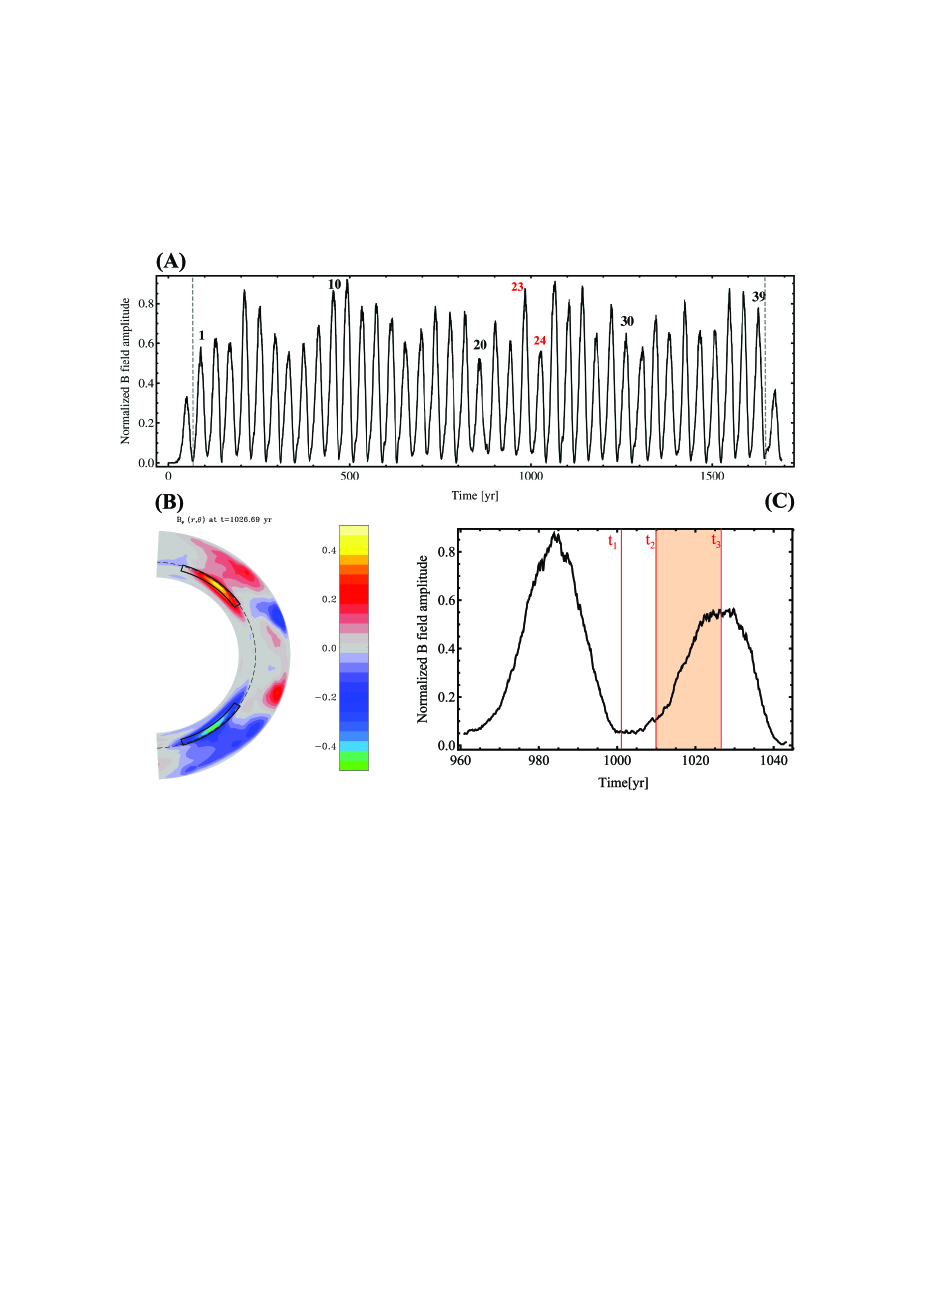
In order to produce a latitudinal velocity diagram () comparable to the one presented in figure 4 of (2013), we choose a cycle from the simulation with similar characteristics as sunspot cycle 24, i.e. broadly speaking a low amplitude cycle following one of higher amplitude. Coincidentally, the 24th cycle in our millennium simulation is a good candidate to perform this comparison. Figure 1C shows the period over which we averaged our signal, i.e. over the rising phase of the cycle which is analogous to the 2 year interval used in (2013) (nearly 20% of the cycle duration in both cases).
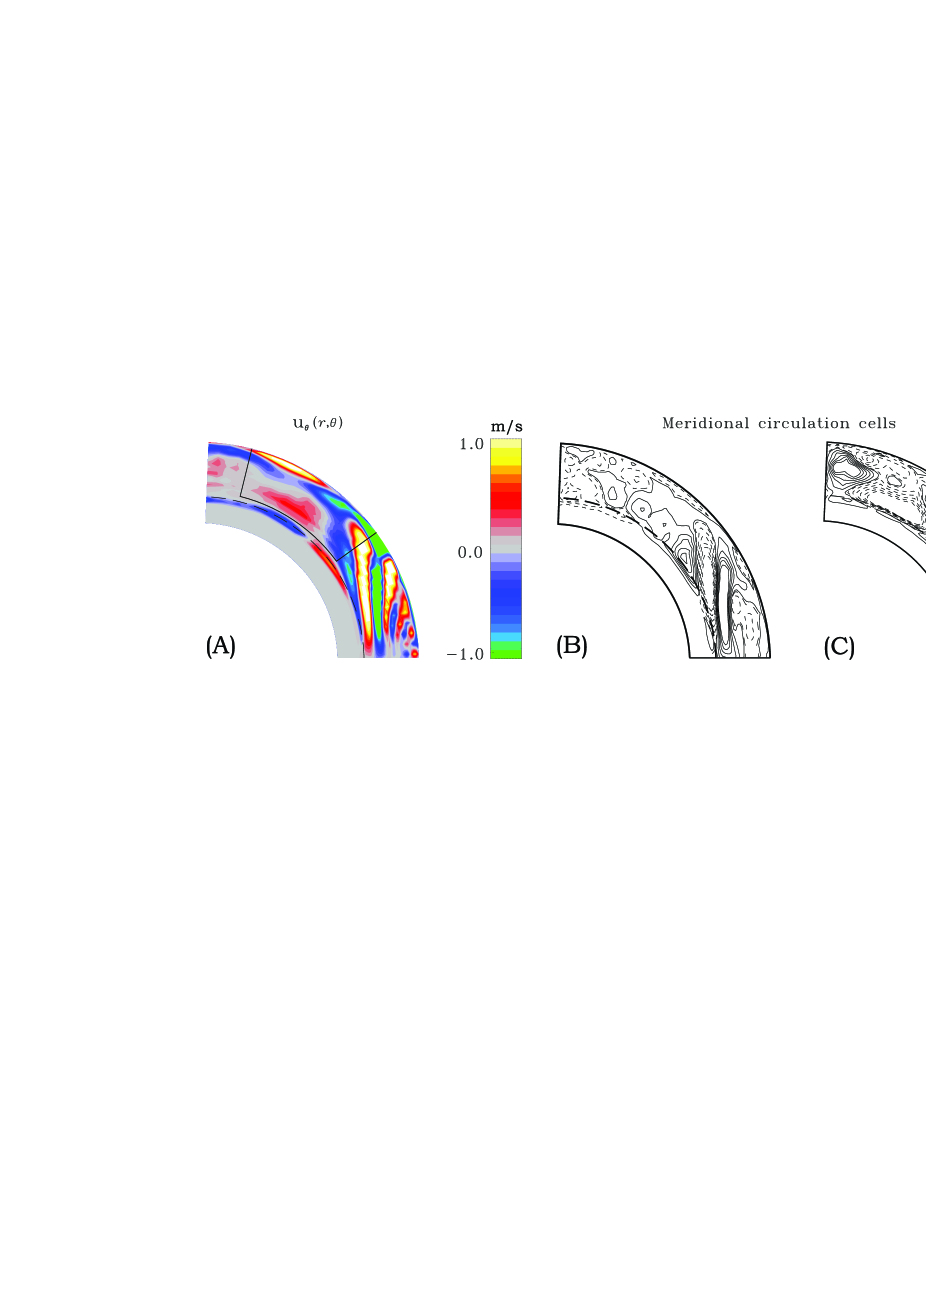
The large-scale axisymmetric latitudinal velocity component, , is extracted from the simulation also by zonal averaging (see Fig. 2A). Here we follow the convention usually used in EULAG-MHD, i.e. is defined positive towards the poles. Using and , in a similar manner to that presented in Guerrero et al. (2013), we also compute the stream function of the meridional flow which is useful for understanding the cell morphology (see panels (B) and (C) of figure 2).
A detailed comparison of the helioseismically-inferred internal meridional flow with our EULAG-MHD simulation is complicated by the fact that the large-scale magnetic cycle developing in the latter peaks at much higher latitude () than the sunspot butterfly diagram (), and shows only hints of equatorial migration. The large-scale field migration toward lower latitudes in the simulation appears to be inhibited by the presence of rotationally-aligned “banana cells” outside of a cylinder tangent to the equatorial base of the convection zone. The existence of these cells reflects the strong influence of rotation on turbulent convection, and is a robust feature observed in all numerical simulations of rotating convection in the low Rossby number regime, with or without magnetic fields (see, e.g., Miesch & Toomre 2009, §2.2.3; also Guerrero et al. 2013). However, the dynamical response of the simulation to the magnetic cycle poleward of the simulated “activity belts” shows some encouraging similarities to the sun. For example, Beaudoin et al. (2012) have shown that the pattern of cyclic rotational torsional oscillations developing poleward of the mid-latitude regions of peak large-scale magnetic fields show the same amplitude, phasing, and even double-branch structure as inferred helioseismically (see their Fig. 5 and accompanying discussion). This offers hope that the meridional circulation dynamics may also be similar, considering that meridional and zonal force balances are tightly coupled (more on this in §3 herein).
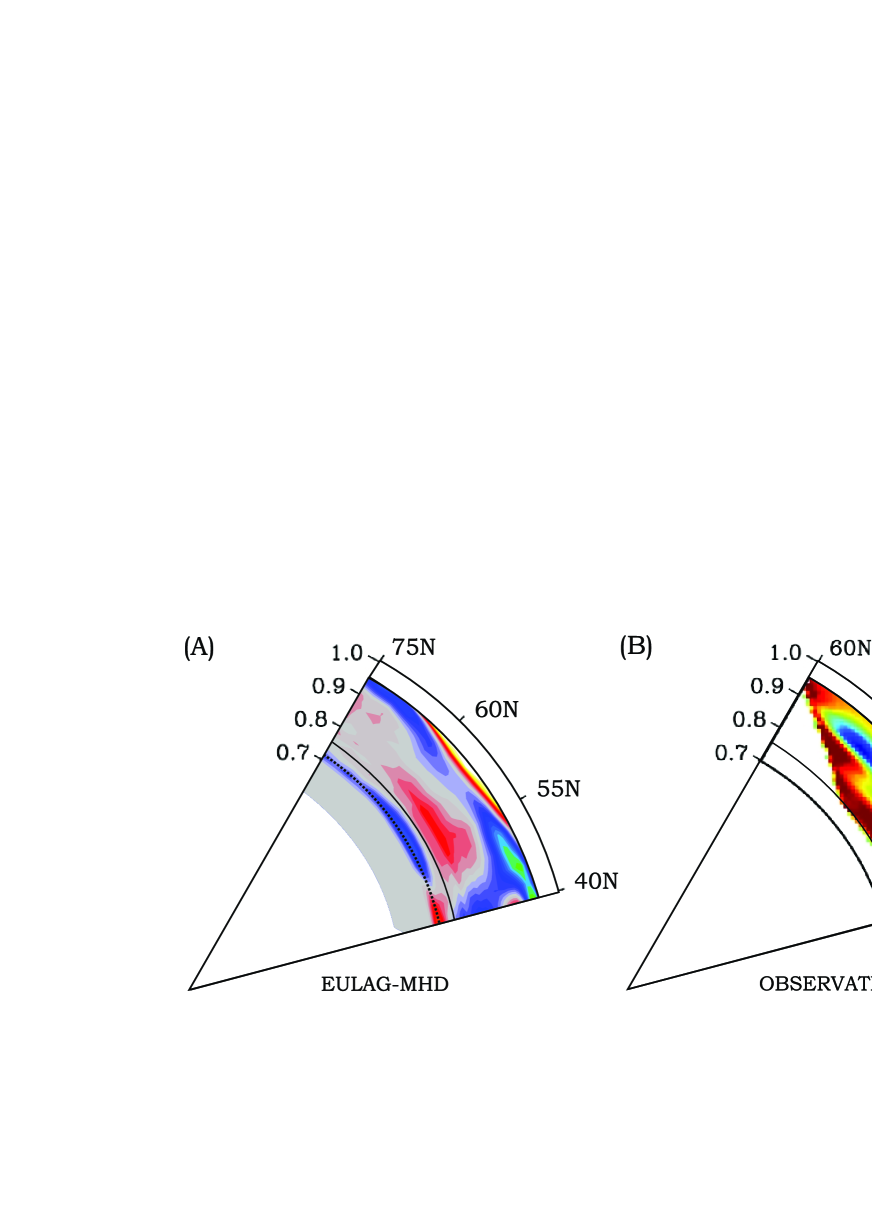
Figure 3 replots the mid- to high-latitude portion of the profile in Fig. 2A, artificially remapped to the 15—60∘ latitude range of the (2013) data, the latter plotted in (B) for comparison. A key feature of the MC extracted from the simulation is an equatorward flow present below the largest depth probed by (2013), indicated by the solid circular arc in the left panel of figure 3. This equatorward flow is part of a counter-clockwise meridional cell appearing at those latitudes and depths. Panels (B) and (C) of figure 2 show the different morphological configurations of the MC profile at cycle minimum and cycle maximum respectively. The cell where the return flow is located is much more pronounced at cycle maximum. Moreover, as originally reported in Passos et al. (2012), the amplitude of this equatorward flow varies in phase with the build up of the large-scale toroidal. This is an indication that the MC at this depth is highly dynamical and magnetically influenced. Another indication of this is the fact that the MC in this simulation is stronger than that arising in an analogous simulation using a purely hydrodynamic set up (no magnetic fields).
3. Meridional circulation dynamics
The existence of the equatorward flow at mid-latitudes near the base of the convection zone is a robust feature of global convection simulations, and particularly those that include a stable radiative zone below the CZ (Miesch 2005). This generally occurs even if the MC in the bulk of the CZ is multi-celled. It can be attributed to two distinct but complementary physical mechanisms, namely gyroscopic pumping and turbulent alignment of convective plumes. Both are essentially hydrodynamic mechanisms but magnetic feedbacks can alter the dynamical balances, inducing time variations.
Gyroscopic pumping refers to the tendency for a zonal force (axial torque) to induce a meridional flow through the inertia of the differential rotation (McIntyre, 2000; Miesch, Hindman, 2011). In convection simulations the zonal force arises principally from the convective Reynolds stress, which tends to transport angular momentum radially inward at mid-latitudes () due to the Coriolis deflection of downflow plumes and broader upflows (Featherstone & Miesch 2014). The convergence of the inward angular momentum flux at the base of the CZ acts to accelerate the zonal flow and induces an equatorward flow that acts to offset this acceleration. Note that this convergence of the convective angular momentum flux near the base of the CZ does not preclude one or more other regions of convergence closer to the surface. In particular, a similar convergence of inward angular momentum flux at the base of the near-surface shear layer due to plumes driven in the photospheric boundary layer may account for the shallow return flows inferred from recent photospheric and helioseismic measurements (Hathaway 2012; Zhao et al. 2013). In other words, the presence of an equatorward return flow at R⊙ does not necessarily rule out an equatorward flow at the base of the CZ as well.
Turbulent alignment refers to the tendency for helical downflow plumes to be diverted away from the vertical direction and toward the rotation axis ( in the northern hemisphere, opposite in the southern) due to the Coriolis deflection of flow components that are perpendicular to the rotation axis (Brummell et al. 1996, 1998). As these plumes enter the stably stratified fluid layers their vertical momentum is halted by the buoyancy force but they retain their equatorward momentum. The cumulative effect of many such plumes can produce a net equatorward circulation in the overshoot region and lower CZ (Miesch 2005).
These two mechanisms for maintaining an equatorward flow near the base of the CZ have been found previously in global convection simulations run with the ASH code (Miesch et al. 2000; Featherstone & Miesch 2014). Figure 4 demonstrates that similar mechanisms may be operating in our EULAG-MHD simulations. Shown are correlations among the fluctuating velocity components defined as , where is the velocity component before zonal averaging and after zonal averaging. These correlations were computed for the northern hemisphere and for 2 full magnetic cycles spanning 5 polarity reversals (enough for illustrative purposes) over the integration region shown in Fig. 1B. This region encompasses the interface between convectively stable and unstable fluid layers. The correlation is robustly negative, consistent with the maintenance of an equatorward circulation by the convergence of an inward angular momentum flux; the mechanism of gyroscopic pumping as discussed above. Meanwhile, the correlation is positive, indicating turbulent alignment. Both show variation with the phase of the magnetic cycle, with the inward angular momentum flux particularly prominent during cycle maximum.
Though these Reynolds stresses tend to induce an equatorward flow near the base of the CZ, they are opposed at mid-latitudes by the Lorentz force. Here the cyclic generation of strong toroidal fields via the -effect extracts energy from the rotational shear, decelerating lower latitudes and accelerating higher latitudes. In the region of deceleration on the equatorward edge of the toroidal bands, gyroscopic pumping induces a poleward meridional flow that varies in strength as the bands are alternately generated and destroyed (Fig. 2B, C). This establishes a marked clockwise circulation cell at mid latitudes that extends into the mid-CZ. At higher and lower latitudes the convective angular momentum transport maintains a counter-clockwise cell with equatorward flow at the base of the CZ. This high-latitude cell largely disappears during cycle minima while the mid-latitude cell extends poleward (Fig. 2B).
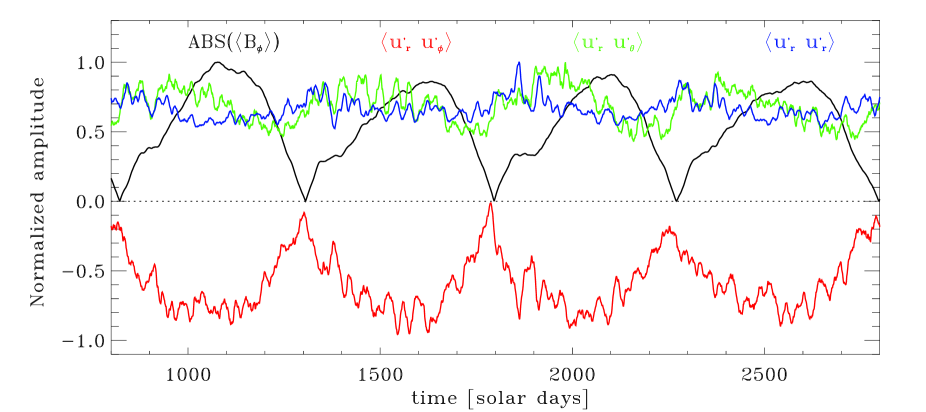
The correlation in Fig. 4, which is a measure of the convective overshoot, is higher when the toroidal field is lower and vice versa. This means that at this depth the penetration power of the downflows is higher when the toroidal field is weaker. At cycle maximum, when the amplitude of the toroidal field is maximum, the overshoot layers just below the tachocline develops a higher “rigidity”, presumably due to the magnetic tension force, and the downflows do not penetrate as deep. As a consequence, the overshooting downflows deposit their latitudinal momentum within a thinner layer immediately beneath the bottom of the CZ, thus driving a larger local acceleration of the equatorward flow than at cycle minimum. The cyclic modulation observed in the fluctuating flow correlations is an important reminder that other forces are acting. We are currently expanding our analysis of these results in order to understand the physical mechanisms through which the large-scale magnetic field is modulating the turbulence.
4. Conclusions
Extant helioseismic measurements are now mapping the solar meridional circulation to a depth of 0.75 R⊙. Based on 3D MHD global simulations of solar convection, we presented arguments that favor the existence of an equatorward flow below 0.75 R⊙, near the base of the CZ at mid to high latitudes. This information is important for the continuous development of FTD models, and offer a challenge to future helioseismic measurements which will eventually refute or confirm this result.
The horizontal (latitudinal) component of the MC extracted from this simulation, , is compared to the latest MC measurements of (2013) focusing on the latitude range poleward of the activity belts in both cases. In the simulation, solar-like features (e.g. regular large-scale magnetic cycle and torsional oscillations) appear at higher latitudes than in the Sun, and we argue that this is possibly due to the influence of the dynamics associated with rotationally-aligned, persistent “banana cells” that are typically present in this type of simulations. In an appropriately remapped latitude range and over the depths simulated () our profile shows the same broad characteristics as (2013) mapping presented in Fig. 3. We also observe evidence that the deep equatorward flow strength and topology is tightly connected with the build up of the large-scale toroidal magnetic field. As a possible explanation, we suggest that when this field component accumulates beneath the tachocline the associated magnetic tension force decreases the penetration depth of convective downflows. In turn, this process contributes to the enhancement of a mid latitude equatorward flow at the base of the CZ by depositing angular momentum at higher depths.
This is a very dynamic process that changes greatly over the course of the solar cycle and is indicative of an important two-way dynamical coupling between field and flow. This result also suggests that special attention should be taken when interpreting the results provided by helioseismology, which require long averaging periods to extract the weak meridional flow from the background turbulence noise. We are led to believe that long periods of data integration will dilute any dynamical effects impacting the deeper meridional flow cells. It should also be emphasized that this tight coupling between field and flow should have an impact in kinematic simulations of flux transport dynamo models. The ubiquitous kinematic approach is clearly missing some important aspects of the dynamical interactions between field and flow. We are currently expanding the present work to better understand the nature of the physical mechanism(s) dynamically modulating the MC global topology in the presence of a large-scale magnetic cycle.
D.Passos is thankful to Gustavo Guerrero for helping with the stream function representation, to Sandra Braz for support, and acknowledges the financial support from the Fundação para a Ciência e Tecnologia grant SFRH/BPD/68409/2010, POPH/FSE and GRPS-UdeM and the University of the Algarve for providing office space. We thank Kyle Auguston for helpful comments on the manuscript. P. Charbonneau is supported primarily by a Discovery Grant from the Natural Sciences and Engineering Research Council of Canada. All EULAG-MHD simulations reported upon in this paper were performed on the computing infrastructures of Calcul Québec, a member of the Compute Canada consortium. The National Center for Atmospheric Research is sponsored by the National Science Foundation.
References
- (1) Babcock, H.W., 1961 Astrophys. J. 133, 572
- (2) Beaudoin, P., Charbonneau, P., Racine, E., Smolarkiewicz, P. K. 2012, Sol. Phys., 282, 335
- Brummell et al. (1996) Brummell, N. H., Hurlburt, N. E., Toomre, J. 1996, ApJ, 473, 494
- Brummell et al. (1998) Brummell, N. H., Hurlburt, N. E., Toomre, J. 1998, ApJ, 493, 955
- (5) Brun, A. S., Miesch, M. S., Toomre, J. 2004, ApJ, 614, 1073
- (6) Cameron, R., Vögler, A., Schüssler, M. 2011 A&A, 533, id.A86
- Charbonneau (2010) Charbonneau, P., 2010, LRSP, 7, lrsp-2010-3
- Choudhuri, et al. (1995) Choudhuri, A.R., Schüssler, M., Dikpati, M., A&A, 303, L29
- Clune et al. (1999) Clune, C., Elliott, J., Miesch, M., Toomre, J., Glatzmaier, G. 1999, Parallel Computing, 25, 361
- Cossette et al. (2013) Cossette, J-F., Charbonneau, P., Smolarkiewicz, P. K. 2013, ApJ, 777, id. L29
- Dikpati & Charbonneau (1999) Dikpati, M., Charbonneau, P. 1999, ApJ, 518, 508
- Featherstone, Miesch (2014) Featherstone, N., Miesch, M. 2014, ApJ(submitted)
- Guerrero et al. (2013) Guerrero, G., Smolarkiewicz, P. K., Kosovichev, A.G., & Mansour, N.N. 2013 ApJ, 779, 176
- Ghizaru et al. (2010) Ghizaru, M., Charbonneau, P., Smolarkiewicz, P. K. 2010 ApJL, 715, L133
- Hathaway, Rightmire (2010) Hathaway, D., Rightmire, L., 2010 Science, 327, 5971, 1350
- Hathaway (2012) Hathaway, D. 2012, ApJ, 760, 84
- (17) Hazra, G., Karak, B. B., Choudhuri, A., 2014, ApJ, 782, id. 93
- (18) Jiang, J., Cameron, R., Schmitt, D., Schüssler, M., 2009, Astrophys. J. Lett. 693, L96
- (19) Käpylä, P. J., Mantere, M. J., Brandenburg, A. 2012, ApJ, 755, L22
- (20) Karak, B. B., Jiang, J., Miesch, M., Charbonneau, P., Choudhuri, A. R. 2014 Space Science Reviews, DOI:10.1007/s11214-014-0099-6
- Komm et al. (2011) Komm, R., Howe, Hill, F., R., González Hernández, I., Hill, F., and Haber, D., 2011 IOP Journal of Physics, 271, 012077
- McIntyre (2000) McIntyre, M. E. 2000, in Perspectives in Fluid Dynamics, ed. G. K. Batchelor, H. K. Moffatt, M. G. Worster, Cambridge Univ. Press, 557
- Miesch et al. (2000) Miesch, M., Elliott, J., Toomre, J., Clune, T., Glatzmaier, G., Gilman, P. 2000, ApJ, 532, 592
- Miesch (2005) Miesch, M.S. 2005, Liv. Rev. Sol. Phys., 2, 1
- Miesch, Toomre (2009) Miesch, M., Toomre, J., 2009, An. Rev. Fluid Mec. 41, 317
- Miesch, Hindman (2011) Miesch, M., Hindman, B., 2011, ApJ, 743, 1, id. 79, 25
- Muñoz-Jaramillo et al. (2013) Muñoz-Jaramillo, A., Dasi-Espuig, M., Balmaceda, L. A., DeLuca, E. E. 2013 ApJ, 767, 2, id. L275
- Nandy & Choudhuri (2002) Nandy, D., Choudhuri, A. R. 2002, Science, 296, 1671
- Passos et al. (2012) Passos, D., Charbonneau, P., Beaudoin, P. 2012, Sol. Phys., 279, 1
- Passos, Charbonneau (2014) Passos, D., Charbonneau, P. 2014, A&A, 568, A113
- Racine et al. (2011) Racine, E., Charbonneau, P., Ghizaru, M., Bouchat, A., Smolarkiewicz, P. K. 2011, ApJ, 735, 46
- Smolarkiewicz (2006) Smolarkiewicz, PK. 2006, Int J Numer Methods Fluids, 50, 1123
- Smolarkiewicz, Charbonneau (2013) Smolarkiewicz, P. K., Charbonneau, P. 2013, JCP, 236, 608
- Tobias, Cattaneo (2013) Tobias, S. M., Cattaneo, F. 2013, Nature, 497, 643
- Ulrich (2010) Ulrich, R. K. 2010, ApJ, 725, 658
- Wang et al. (1991) Wang, Y. -M., Sheeley, N. R., Nash, A. G. 1991, ApJ, 383, 431
- (37) Zhao, J., Bogart, R. S., Kosovichev, A. G., Duvall Jr., T. L., Hartlep, T, 2013, ApJL 774, L29