The reversible lithiation of SnO: a three-phase process
Abstract
A high reversible capacity is a key feature for any rechargeable battery. In the lithium-ion battery technology, tin-oxide anodes do fulfill this requirement, but a fast loss of capacity hinders a full commercialization. Using first-principles calculations, we propose a microscopic model that sheds light on the reversible lithiation/delithiation of SnO and reveals that a sintering of Sn causes a strong degradation of SnO-based anodes. When the initial irreversible transformation ends, active anode grains consist of Li-oxide layers separated by Sn bilayers. During the following reversible lithiation, the Li-oxide undergoes two phase transformations that give rise to a Li-enrichment of the oxide and the formation of a layered SnLi composite. We find that the model-predicted anode volume expansion and voltage profile agree well with experiment, and a layered anode grain is highly-conductive and has a theoretical reversible capacity of 4.5 Li atoms per a SnO host unit. The model suggests that the grain structure has to remain layered to sustain its reversible capacity and a thin-film design of battery anodes could be a remedy for the capacity loss.
Tin-based compounds are promising candidates to replace graphite as the anode material in lithium-ion batteries (LIBs) Obrovac et al. (2007). Having a maximum capacity of 4.4 Li per host atom (Li22Sn5) Boukamp et al. (1981), Sn alloys outperform the theoretical gravimetric limit of graphite by a factor larger than two Park et al. (2010). The interest for Sn-based material systems was originally sparked by the pioneering work of Idota et al. Idota (1997) who showed that using an amorphous tin composite oxide as the anode of a LIB cell improves the performance of the battery both in terms of capacity and cycleability.
To better understand the behavior of Sn-based materials upon lithiation and delithiation, Courtney and Dahn Courtney and Dahn (1997a) conducted a series of experiments on various Sn-oxides. They found that all the oxides initially undergo an irreversible Li uptake followed by a regime where Li insertion and extraction exhibit a reversible behavior. Using their experimental findings, Courtney and Dahn developed an empirical model where it is assumed that an amorphous Li-oxide matrix forms as the initial Li ions enter the pristine SnO sample. The O atoms are captured by Li, which offers stronger bonds as compared to Sn. At the same time, the Sn atoms are subject to a sintering process and form clusters embedded in the emerging Li-oxide matrix. The proposed Sn clustering model is based on the experimental observation of Sn signatures in X-ray diffraction measurements on the lithiated oxide materials Courtney and Dahn (1997a). Note that the aforementioned structural changes of SnO take place during the initial irreversible Li uptake. As the lithiation continues, the Sn clusters are assumed to behave as a SnLix alloy, where is the number of Li atoms per Sn, and should provide a reversible storage medium for Li. The model proposed by Courtney and Dahn has served as a reference for interpreting (de)lithiathion of Li-ion battery cells with SnO-based anode electrodes. We have adapted this model to LiOSn anodes by assuming that the Sn clusters behave similarly to bulk SnLix when exposed to Li. This will be referred to as the cluster model.
While the Li-oxide formation and the growth of Sn clusters have been confirmed by many groups Chouvin et al. (2000); Wang et al. (2000); Sandu et al. (2004); Zhang et al. (2012); Jeo (2013) the actual contribution of these Sn clusters to the reversible lithiation is questionable for several reasons. Firstly, Li-oxide is an insulator so that it would be difficult to conceive how electrons can be efficiently supplied to the Sn clusters unless the latter are well interconnected at any stage of lithiation. Secondly, during the initial phase there exist bond types in the LiOSn sample that cannot be explained by the cluster model Courtney et al. (1999); Wang et al. (2000); Sandu et al. (2004, 2006). Thirdly, it is well established that the growth of Sn clusters actually causes a capacity degradation of the anode material Courtney and Dahn (1997b); Behm and Irvine (2002); Jeo (2013). Fourthly, the initial stress builds up differently in metallic Sn and insulating SnO during the lithiation process Tavassol et al. (2014) that indicates that the volume expansion profiles are not the same for the two materials. Finally, a recent experiment by Ebner and co-workers Ebner et al. (2013) has shown that the voltage profile and the volume expansion of SnO oxide during the initial Li insertion/extraction cycle significantly differ from those of a bulk SnLi alloy. Fracturing, which was found to occur at grain boundaries in SnO, is also difficult to explain assuming a homogenous isotropic amorphous Li-oxide matrix and separated Sn clusters.
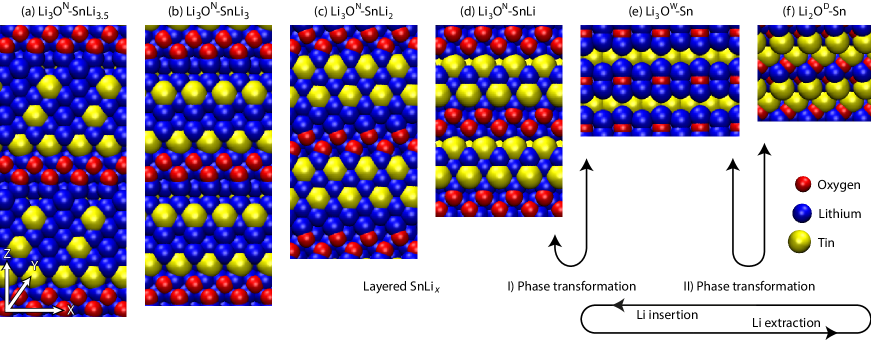
In this paper, we propose a microscopic model for reversible (de)lithiation of tin monoxide that resolves the shortcomings of the cluster model by Courtney and Dahn Courtney and Dahn (1997a) summarized in the previous paragraph. Our model is based upon an atomistic study of a large set of structures obtained from first-principles calculations. According to our recent ab-initio calculations of the irreversible Li-uptake of SnO, a fully Li-depleted anode consists of layered Li-oxide separated by Sn bilayers Pedersen and Luisier (2014). Starting from this configuration, we show here that the Li-oxide undergoes two phase transformations as the Li concentration increases, giving rise to the formation of a Li-rich and layered Li-oxide (Li3O). Subsequently 3.5 additional Li atoms per Sn atom are accommodated solely in Sn layers. Thus, the final structure contains 6.5 Li per Sn atom in total, but the reversible capacity of SnO is limited to 4.5 Li per Sn (3.5) and O (1) host atom whereas the remaining two Li atoms are strongly bound in the Li-oxide. By applying this three-phase model we are able to reproduce the experimental data for the volume expansion and the voltage profile measured upon lithiation. We also find that the obtained LiOSn model structures exhibit a good in-plane electron conductance because of their highly-conductive SnLix layers. The results presented here suggest that the undesired degradation of reversible capacity for Li-ions might be averted by designing an anode that preserves its layered structure during (de)lithiation. This could be achieved by adopting a thin-film structure on a lattice matched substrate to promote the layered structure or by inserting species that retard the ongoing Sn sintering process. These general findings could have a wider applicability and be used to better understand the behavior of other metal oxides Zhang (2011) or Na-ion batteries Kim et al. (2012).
We now describe in detail the entire process of the anode (de)lithiation as given by the proposed three-phase model. The starting configuration corresponds to the anode grain structure, in which the irreversible uptake of Li is fully complete, and the Li-oxide layers are separated by Sn bilayers as shown in Fig. 1(f). Layers or half-layers of Li are inserted into the structure as long as the relative binding energy for Li remains negative
| (1) |
where is the average relative binding energy of a single Li atom; is the total energy of the anode structure with layers of Li; is the cohesive energy of a Li atom in a bulk environment, and is the number of Li atoms in a single Li layer. Structures fulfilling the requirement in Eq. (1) have been determined for Li concentrations up to . This Li content corresponds to a fully lithiated SnO sample. For the additional Li atoms are located in the LiOSn structure within an environment similar to bulk Li and have a comparable binding energy so that . This indicates that eventual overcharging will result in the formation of domains with bulk Li, which, in the best case scenario, just act as passive spectators. In other words, having any extra Li atoms in the fully-loaded anode structure does not increase the battery capacity since these Li atoms will not be released by the layered anode upon normal discharging conditions.
Figure 1 shows all the structural configurations obtained during the (de)lithiation process described above. As the Li load increases, three different phases can be identified, which are separated by two phase transformations of the Li-oxide. The first phase, Li2O, corresponds to the fully Li-depleted configuration in Fig. 1(f). The label D refers to it being a depleted structure in which the metallic Sn bilayers surround the insulating Li-poor oxide layers. A second phase, Li3O, as shown in Fig. 1(e), appears upon insertion of the first reversible Li layer. The XY cross section of this oxide layer expands so that the label W stands for its wider cross section area. Note that no substantial change of the supercell size occurs in the Z direction though the Sn bilayer transforms into a monolayer structure. Four structural configurations of a third Li-oxide phase, Li3O, are shown in Figs. 1(a)-(d). This oxide results from a phase transformation where the number of Li atoms remains unchanged and the Li-rich oxide regains a narrow XY cross section. The label N refers to its narrower cross section area. Hereafter, the inserted Li atoms form a SnLix layered composite structure that is accompanied by a strong expansion of the corresponding supercell in the Z direction. The layered composite can accommodate a maximum of 3.5 Li per Sn atom. The fully-loaded structural configuration is given in Fig. 1(a). From Fig. 1 it is also apparent that the three-phase model offers an explanation for the “unusual” bond types through a high ratio of both Sn-Sn, Sn-Li, Sn-O, and Li-O bonds in the layered anode grains.
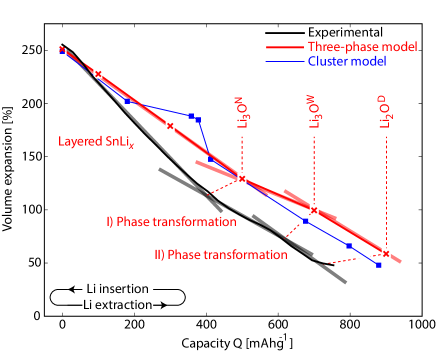
In the present study, we only focus on the first reversible (de)lithiation cycle under the assumption that the initial and irreversible transformation from Sn- to Li-oxide has already taken place. To validate the three-phase model against the experimental data in Ref. Ebner et al., 2013, we computed the volume expansion of the LiyO-SnLix anode with respect to the volume of pristine SnO upon Li-extraction, as reported in Fig. 2. The volume expansion is defined as
| (2) |
where is the volume of the LiyO-SnLix supercell at a given Li concentration ( and ), and is the volume of a pristine SnO structure with the same number of Sn atoms as in the corresponding LiOSn supercell.
The three volume expansion regimes, which can be clearly identified in Fig. 2, correspond to the three Li-oxide phases shown in Fig. 1. At first, Li atoms are released from the SnLix composite structure, which is situated in-between Li3O layers. This causes a constant volume reduction imposed by the supercell contraction in the Z direction, perpendicular to the XY cross section. While SnLix becomes fully Li-depleted, the Li-rich oxide undergoes a phase transformation (NW) that slows down the volume reduction. Though the atom rearrangement in the anode grain structure is rather drastic, the corresponding volume reduction is quite moderate because of the significant XY cross section expansion, which compensates for the supercell contraction in the Z direction. Finally, further delithiation extracts the remaining Li atoms that are loosely-bound in the oxide, giving rise to another transformation (WL). This brings back the anode structure into its depleted state Li2O with a narrow cross section, as depicted in Fig. 1(f). This final transformation induces a strong volume reduction. Figure 2 shows that the volume expansion, as predicted by the three-phase model, is in a good agreement with the volume change measured in Ref. Ebner et al., 2013. We notice that there exists a strong dependence of the anode grain volume on the Li-concentration. It may give rise to a deterioration of the layered structure during operation if the Li concentration is inhomogeneous over the anode volume. This could explain why Li-oxide has been classified as amorphous in LiOSn anodes Courtney and Dahn (1997a). It also explains why fracturing tends to occur at grain boundaries. These fractures take place to relieve accumulated strain in the regions where crystal grains of different orientation and shape intersect during volume expansion and contraction.

To further validate the three-phase model, we calculated the voltage profile of the LiOSn anode during (de)lithiation, as shown in Fig. 3. A previous work on bulk SnLi alloys Courtney et al. (1998) demonstrated that the voltage profile, which is determined by the change of the Gibbs free energy, can be obtained from the internal energy change only, while the entropy and volume terms can be safely neglected. We adopted a similar approach to compute the voltage profile during delithiation
| (3) |
where is the voltage change relative to the fully-lithiated anode structure with the total energy ; is the total energy of an anode structure with Li layers removed; is the number of Li atoms in a single Li layer, and is the elementary charge of an electron.
Figure 3 shows that a rather moderate increase of the voltage takes place as the Li atoms are released from the SnLix composite structure during the first stage of delithiation ( mAhg-1). A steep voltage increase then occurs as the SnLi composite is depleted of Li atoms and the Li-rich oxide undergoes a phase transformation ( mAhg-1). Finally, the further extraction of Li atoms from the Li-rich oxide ( mAhg-1) increases the voltage up to its maximum value of 2.05 eV for the fully Li-depleted anode structure (Fig. 1(f)). One can see in Fig. 3 that the three-phase model reproduces the experimentally observed voltage profile in a semiquantitative manner Ebner et al. (2013); Courtney and Dahn (1997a); Chouvin et al. (2000); Wang et al. (2000). Figure 3 also show that the behavior of a bulk SnLi alloy and lithiated SnO oxide is qualitatively different, which demonstrates that the Sn cluster model is not applicable for the LiOSn anode grain.
We notice that the voltage profile given by the three-phase model misses the onset of 0.3 V that is present in the experimental data at the capacity . This can be explained by the fact that the computed voltage is determined from an average change in the total energy of the anode, as given in Eq. (3), whereas eventual activation energy barriers of the Li atom diffusion process upon delithiation are not accounted for. As a first approximation, the onset voltage can be estimated in the following way. When removing a single Li atom from the anode structure, it appears that the Li atoms residing at the interface between the Li-oxide and the composite layers have the weakest bonds. This holds true for all the structures, except the one with a fully Li-loaded anode (Fig. 1(f)) in which the least bound Li is in the SnLi composite layer. The energy required to extract this Li atom from the composite layered structure is 0.16 eV, i.e., 0.16 V can be considered as the lower bound for the onset voltage () at the capacity .
The anode grain structures, which are given by the three-phase model, have been assumed to be good electrical conductors during the entire (de)lithiation cycle. This means that all the layered structures in Figs. 1(a-f) should have a high electron conductance in the XY-plane being comparable to that of bulk -Sn and Li. To confirm this hypothesis, we have calculated the band structure of the Li-oxide and SnLi composite layers, which reveals that the oxide layer is an insulator with a sizable band gap that hinders electron transport in the Z-direction, whereas the SnLi composite layer is metallic and provides conducting channels for in-plane electron transport. First-principles calculations of the ballistic electron transport through the SnLi composite layers in Fig. 1 explicitly show that the in-plane electron conductance is comparable to that of bulk -Sn and Li calculated using the same approach. Hence, the proposed anode structure is a good conductor, which is consistent with experimental observations. Details about the conductance calculations will be published elsewhere Khomyakov et al. .
We have done first-principles, density-functional theory calculations to understand the reversible lithiation/delithiation of SnO anodes in Li-ion batteries at the microscopic level. Based on these atomistic simulations, we developed a three-phase model that consistently explains how the structural and electronic properties of a SnO-based anode (phase transformation, volume expansion, voltage profile, and electron conductance) evolve during the initial (de)lithiation cycle. This model predicts that the reversible capacity of the SnO-based Li-ion battery can reach up to 4.5 Li atoms per SnO host unit, which is slightly higher than the theoretical capacity for bulk Sn Boukamp et al. (1981). It also sheds light onto the surprising experimental observation of “unusual” bonds that have been explained by a high ratio of Sn-Sn, Sn-Li, Sn-O, and Li-O bonds in the layered LiOSn structure. Using the obtained results, we proposed a plausible explanation for the deterioration and amorphization of the LiOSn structure, which are attributed to spacial inhomogeneities of the Li concentration in real samples. Finally, the observed capacity degradation of SnO anodes can be understood by applying the cluster model by Courtney and Dahn Courtney and Dahn (1997a) to describe the slower but irreversible structural changes. A loss in Li capacity results from the system transformation towards its thermodynamically more stable configuration with Sn clusters embedded in a lithium oxide rather than remaining layered as required by the reversible three-phase model.
Our findings suggest that improved SnO-based anodes could be achieved by applying a thin-film design or use an additive to retard the agglomeration of Sn. Furthermore, the layered character of the three-phase model structures appears to be general and might be used to understand the lithiation process of other metal oxides. This is supported by a similarity of voltage profiles measured in Refs. Poizot et al., 2000, 2002 for the lithiation of transition metal oxides. The model might also shed light onto the charging dynamics of sodium-ion batteries Su et al. (2013); Han et al. (2014), where Na-ions replace Li-ions as the charge carriers.
I Methods
Our first-principles calculations rely on a density-functional plane-wave pseudo-potential method within the framework of the generalized gradient approximation (GGA-PBE) Perdew et al. (1996) and the projector augmented wave (PAW) formalism Blöchl (1994), as implemented in the VASP code Kresse and Furthmuller (1996a, b). The equilibrium LiOSn structures consist of a 8x8x1 SnO supercell (64 Sn and 64 O atoms) with a Li content ranging from 128 to 448 atoms. The supercell Brillouin zone is sampled with a 2x2x2 k-point grid. The plane-wave kinetic energy cut-off is set at 500 eV. The total energy and forces are converged to at least eV and eV/Å, respectively. Further computational details can be found elsewhere Pedersen and Luisier (2014).
II Acknowledgments
This research is funded by the EU Commission (the ERC starting grant: E-MOBILE). The computer simulations are done at the Swiss National Supercomputer Center (project: s579). The authors thank Martin Ebner for helpful discussions.
References
- Obrovac et al. (2007) M. N. Obrovac, L. Christensen, D. B. Le, and J. R. Dahn, Journal of The Electrochemical Society 154, A849 (2007).
- Boukamp et al. (1981) B. A. Boukamp, G. C. Lesh, and R. A. Huggins, Journal of The Electrochemical Society 128, 725 (1981).
- Park et al. (2010) C.-M. Park, J.-H. Kim, H. Kim, and H.-J. Sohn, Chemical Society Reviews 39, 3115 (2010).
- Idota (1997) Y. Idota, Science 276, 1395 (1997).
- Courtney and Dahn (1997a) I. A. Courtney and J. R. Dahn, Journal of The Electrochemical Society 144, 2045 (1997a).
- Chouvin et al. (2000) J. Chouvin, J. Olivier-Fourcade, J. C. Jumas, B. Simon, P. H. Biensan, F. Madrigal, J. L. Tirado, and C. P. Vicente, Journal of Electroanalytical Chemistry 494, 136 (2000).
- Wang et al. (2000) Y. Wang, J. Sakamoto, S. Kostov, A. N. Mansour, M. L. denBoer, S. G. Greenbaum, C. K. Huang, and S. Surampudi, Journal of Power Sources 89, 232 (2000).
- Sandu et al. (2004) I. Sandu, T. Brousse, D. M. Schleich, and M. Danot, Journal of Solid State Chemistry 177, 4332 (2004).
- Zhang et al. (2012) L. Q. Zhang, X. H. Liu, Y.-C. Perng, J. Cho, J. P. Chang, S. X. Mao, Z. Z. Ye, and J. Y. Huang, Micron 43, 1127 (2012).
- Jeo (2013) 92, 291 (2013).
- Courtney et al. (1999) I. A. Courtney, R. A. Dunlap, and J. R. Dahn, Electrochimica Acta 45, 51 (1999).
- Sandu et al. (2006) I. Sandu, T. Brousse, D. M. Schleich, and M. Danot, Journal of Solid State Chemistry 179, 476 (2006).
- Courtney and Dahn (1997b) I. A. Courtney and J. R. Dahn, Journal of The Electrochemical Society 144, 2943 (1997b).
- Behm and Irvine (2002) M. Behm and J. Irvine, Electrochimica Acta 47, 1727 (2002).
- Tavassol et al. (2014) H. Tavassol, M. W. Cason, R. G. Nuzzo, and A. A. Gewirth, Advanced Energy Materials 5, n/a (2014).
- Ebner et al. (2013) M. Ebner, F. Marone, M. Stampanoni, and V. Wood, Science 342, 716 (2013).
- Pedersen and Luisier (2014) A. Pedersen and M. Luisier, ACS Applied Materials & Interfaces 6, 22257 (2014).
- Zhang (2011) W.-J. Zhang, Journal of Power Sources 196, 13 (2011).
- Kim et al. (2012) S.-W. Kim, D.-H. Seo, X. Ma, G. Ceder, and K. Kang, Advanced Energy Materials 2, 710 (2012).
- Courtney et al. (1998) I. A. Courtney, J. S. Tse, O. Mao, J. Hafner, and J. R. Dahn, Physical Review B 58, 15583 (1998).
- (21) P. A. Khomyakov, A. Pedersen, and M. Luisier, (unpublished) .
- Poizot et al. (2000) P. Poizot, S. Laruelle, S. Grugeon, and L. Dupont, Nature 407, 496 (2000).
- Poizot et al. (2002) P. Poizot, S. Laruelle, S. Grugeon, and J. M. Tarascon, Journal of The Electrochemical Society 149, A1212 (2002).
- Su et al. (2013) D. Su, C. Wang, H. Ahn, and G. Wang, Physical Chemistry Chemical Physics 15, 12543 (2013).
- Han et al. (2014) M. H. Han, E. Gonzalo, G. Singh, and T. Rojo, Energy & Environmental Science 8, 81 (2014).
- Perdew et al. (1996) J. P. Perdew, K. Burke, and M. Ernzerhof, Physical Review Letters 77, 3865 (1996).
- Blöchl (1994) P. E. Blöchl, Physical Review B 50, 17953 (1994).
- Kresse and Furthmuller (1996a) G. Kresse and J. Furthmuller, Physical Review B 54, 11169 (1996a).
- Kresse and Furthmuller (1996b) G. Kresse and J. Furthmuller, Computational Materials Science 6, 15 (1996b).