Another shock for the Bullet cluster, and the source of seed electrons for radio relics
Abstract
With Australia Telescope Compact Array observations, we detect a highly elongated Mpc-scale diffuse radio source on the eastern periphery of the Bullet cluster 1E 0657-55.8, which we argue has the positional, spectral and polarimetric characteristics of a radio relic. This powerful relic ( W Hz-1) consists of a bright northern bulb and a faint linear tail. The bulb emits 94% of the observed radio flux and has the highest surface brightness of any known relic. Exactly coincident with the linear tail we find a sharp X-ray surface brightness edge in the deep Chandra image of the cluster – a signature of a shock front in the hot intracluster medium (ICM), located on the opposite side of the cluster to the famous bow shock. This new example of an X-ray shock coincident with a relic further supports the hypothesis that shocks in the outer regions of clusters can form relics via diffusive shock (re-)acceleration. Intriguingly, our new relic suggests that seed electrons for reacceleration are coming from a local remnant of a radio galaxy, which we are lucky to catch before its complete disruption. If this scenario, in which a relic forms when a shock crosses a well-defined region of the ICM polluted with aged relativistic plasma – as opposed to the usual assumption that seeds are uniformly mixed in the ICM – is also the case for other relics, this may explain a number of peculiar properties of peripheral relics.
keywords:
radiation mechanisms: non-thermal – acceleration of particles – shock waves – galaxies: clusters: individual: 1E 0657-55.8 – galaxies: clusters: intracluster medium – radio continuum general1 Introduction
In the hierarchical scheme of structure formation, massive galaxy clusters are assembled by the coming together of less massive components (e.g. Press & Schechter 1974). Shocks play a crucial role in this process, as during cluster assembly they dissipate a significant quantity of gravitational energy into the intracluster medium (ICM). Shocks in galaxy clusters are difficult to detect; they were initially detected in some of the most massive galaxy clusters using X-ray observations to identify sharp edges in the surface brightness and temperature of the ICM (e.g Markevitch et al. 2002, Markevitch et al. 2005, Russell et al. 2010 and Owers et al. 2011). Unfortunately, in the cluster outskirts, where more strong shocks are expected (e.g. Hong et al. 2014), the X-ray flux is low and the X-ray identification of shocks is difficult (see e.g. Ogrean et al. 2013a). However, it is thought that a powerful shock can accelerate electrons in the ICM (via diffusive shock acceleration, see Blandford & Eichler 1987) with sufficient efficiency to produce detectable synchrotron emission in the cluster outskirts, forming a radio relic (Ensslin et al. 1998). Indeed, regions of highly extended, diffuse synchrotron emission on cluster peripheries have been frequently observed (see Ferrari et al. 2008, Brüggen et al. 2012, Feretti et al. 2012 and Brunetti & Jones 2014 for recent reviews), and in several cases deep X-ray observations have revealed that the synchrotron emission is co-located with X-ray shock signatures (see e.g Giacintucci et al. 2008, Finoguenov et al. 2010, Macario et al. 2011, Bourdin et al. 2013, Akamatsu & Kawahara 2013 and Ogrean & Brüggen 2013c). However, the X-ray shocks and synchrotron emission are not always colocated (see Ogrean et al. 2013b) which raises questions regarding the formation scenario of radio relics. It is therefore essential that the relationship between the radio relics and X-ray properties of the ICM is further studied, as this can enhance our understanding of radio relic formation.
The Bullet cluster 1E 0657-55.8 is a well known, extremely hot and massive merging galaxy cluster with a prominent bow shock, rich gravitational lensing dataset and a powerful giant radio halo (see e.g Tucker, Tananbaum, & Remillard 1995, Tucker et al. 1998, Markevitch et al. 2002, Clowe et al. 2006, Liang et al. 2000 and Shimwell et al. 2014). Liang et al. (2000) suggested that a large radio relic is present in the peripheral region of this cluster. This proposed radio relic has not been confirmed until our recent deep 1.1-3.1 GHz Australia Telescope Compact Array (ATCA) observations (Shimwell et al. 2014) which we use here. We also explore the relationship between the radio emission and X-ray emission using our radio data together with a deep Chandra X-ray dataset.
Hereafter we assume a concordance CDM cosmology, with = 0.3, = 0.7 and H0 = 70 km s-1Mpc-1. At the redshift of the Bullet cluster () the luminosity distance is 1529 Mpc and 1 corresponds to 4.413 kpc. All coordinates are given in J2000.
2 Observations and data reduction
We used the ATCA to observe 1E 0657-55.8 between 2012 December 17 and 2013 February 17 (project C2756). The observations were carried out in four configurations of the ATCA antennas; the target was observed for 8, 5, 9 and 10 hours in the 1.5B, 1.5D, 6A and 6B arrays, respectively. These observations are summarised in Table 1 and a full description of these data is given by Shimwell et al. (2014), in which we concentrated on the cluster’s giant radio halo. The flagging, calibration and imaging techniques are all described by Shimwell et al. (2014).
For the X-ray analysis we use a set of archival Chandra ACIS-I pointings with a total clean exposure of 522 ks, results from which were presented by Markevitch (2006), Clowe et al. (2006), Owers et al. (2009) and in other works. Full technical description of the X-ray analysis will be presented by Markevitch et al., in preparation; here we give the details relevant for our interesting region of low X-ray surface brightness, for which background modeling is important. Light curves of the individual pointings were examined for periods of evelated background; only a mininal number of such time intervals had to be excluded. The detector plus sky background was then modeled using the blank-sky dataset normalised by counts in the 9.5–12 keV energy band. After that, we checked the background in the source-free regions of the field of view and detected a residual faint flare component, which we modeled with a power law spectrum (without the application of the mirror energy response) and a spatial distribution similar to that of the quiescent background. This model described the difference between the blank-sky background and the real background in our observations well at all energies except for residuals below our lower energy bound, which we ignored. The ACIS readout artifact was modeled as a background component as described by Markevitch et al. (2000). Different pointings, observed with small relative offsets to minimise the effect of detector response variations, were coadded, images of the background components subtracted, and the result divided by the exposure map. The final image was extracted in the keV band and binned by 8 to a pixel size of . Given the high gas temperature and the peak ACIS-I sensitivity at keV, the image in this energy band essentially gives the line-of-sight integral of the square of the gas density.
Point sources were left in the X-ray images shown in this paper to illustrate the angular resolution of the data, but excised from further analysis. The spectral analysis followed standard steps of extracting the spectra of the source and of the background components (sky+detector and readout) from a region of interest, creating the instrument response files, and fitting a thermal plasma model (APEC) in XSPEC, fixing the Galactic absorption column at cm-2, and including the additional component to account for the difference between the blank-sky model and the actual source-free background spectrum as described above, normalised according to the region area. The uncertainty of this component was negligible — omitting this component entirely changed the best-fit temperatures by a small fraction of their statistical uncertainty. To include the effect of the background uncertainties in the derived gas temperature values, we varied the background normalization by % (a 90% scatter; Hickox & Markevitch 2006) and added the difference in quadrature to the statistical uncertainty.
| Coordinates (J2000) | 06:58:32.7 -55:57:19.0 |
|---|---|
| Amplitude calibrator | PKS B1934-638 |
| Phase calibrator | PMN J0742-56 |
| Image RMS | 15Jy/beam |
| On-source time | 32 hours |
| Frequency range | 1.1-3.1 GHz |
| Spectral resolution | 1 MHz |
| Synthesised beam FWHM | 6.5 natural resolution |
| Primary beam FWHM | 42-15 |
| Polarisations measured | XX, YY, XY and YX |
3 Results
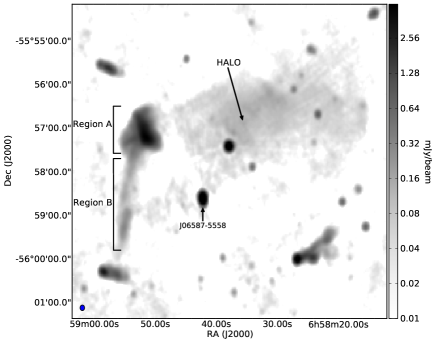
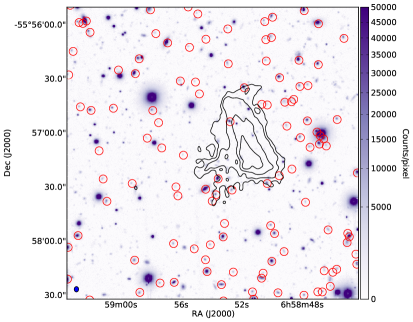
In Figure 1 we present a medium resolution image of the 1.1-3.1 GHz radio emission from the Bullet cluster. We observe diffuse emission in the eastern periphery of the Bullet cluster. The detected object peaks at RA (J2000) 06:58:51.2 DEC (J2000) -55:57:13.5 which is (750 kpc) from the cluster centre. Around this peak there is a bulb of bright diffuse emission that is connected to a faint, linear structure that extends southwards. Hereafter, we refer to the bright northern bulb as region A (declination range -55:56:09.1 to -55:57:57.1), the fainter southern part as region B (declination range -55:57:57.1 to 55:59:42.0) and the entire structure as region A+B.
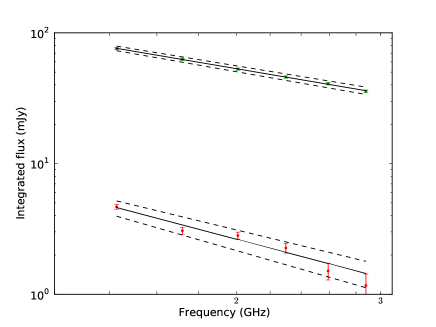
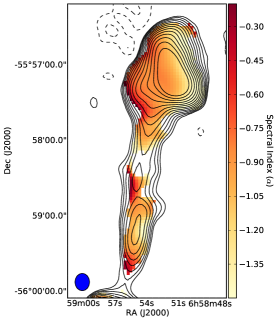
We have measured the integrated flux of the diffuse radio emission as a function of frequency for regions A and B (see Figure 2) and characterised the 1.1 GHz to 3.1 GHz emission with , where is 1.4 GHz. We calculated the uncertainty on our integrated flux density measurements by adding in quadrature the ATCA absolute flux calibration error of 2% (Reynolds 1994) with the error on the integrated flux density derived from the image noise. We determine that is equal to mJy and mJy and that is equal to and for regions A, and B, respectively. A wider frequency range (1.4-6.2 GHz) of flux measurements will be presented by Srinivasan et al., in preparation. In the left panel of Figure 3 we show the variations in the spectral index across the diffuse emission. In region A we are able to accurately constrain the spectral index and observe an East-West gradient, with a spectral index of -0.8 in the East and -1.5 in the West. In region B the diffuse emission is detected at lower significance, which prevented us from characterising spatial trends in its spectral index.
In Figure 1 and Shimwell et al. (2014) we see a very low significance bridge of emission between region B of the radio relic, J06587-5558, and the south eastern region of the radio halo. The bridge may physically connect the radio halo and radio relic but J06587-5558 – which Liang et al. (2001) speculated may be a gravitational lens, a high redshift radio galaxy, or a radio relic – is now thought to be a high redshift (z2.8) galaxy (Johansson et al. 2012). Further data is required to properly characterise this bridge of emission but structures connecting relics and halos are observed in other clusters (see e.g. Venturi et al. 2013).
3.1 Polarisation results
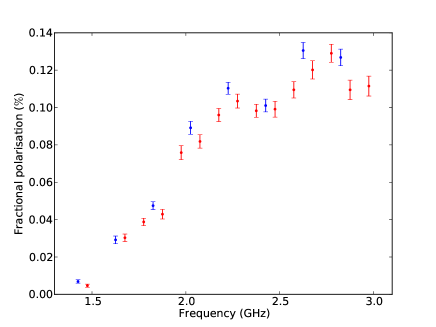
Region A of the relic is polarised and in Figure 4 we present the fractional polarised emission as a function of frequency for this region. The low significance of the emission from region B prevented us from making similar measurements in that region. Polarisation measurements were performed on 100 MHz and 200 MHz sub-bands. The consistent results from these measurements demonstrate that our integrated polarised flux measurements are not significantly effected by bandwidth depolarisation. From 1.5 GHz to 2.2 GHz the fractional polarisation increases rapidly with frequency. In the centre panel of Figure 3 we show a polarisation image of the diffuse emission. Additionally, we have measured that the Faraday dispersion spectrum, F(), peaks at rad/m2 at the region of the peak of the Stokes I emission but is similar across the diffuse emission. This corresponds to a rotation of the polarisation angles shown on the 2.3-2.5 GHz image presented in Figure 3 by 14 degrees anticlockwise. Figure 3 shows that in the northernmost region of the relic, where the polarised emission is strongest, the B-vectors are aligned with the major axis of the relic. Southwards of this the B-vectors gradually become less aligned with the major axis of the relic but this trend could be due to rotation measure variations across the object which we have not taken into account. Whilst the boundary between regions A and B of the relic cannot be precisely defined, the gradual transition in the rotation of the polarisation vectors gives the impression that regions A and B may be physically connected and not merely a chance projection.
3.2 Region A: no optical counterpart
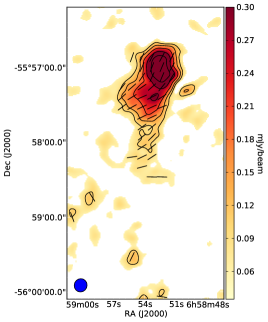
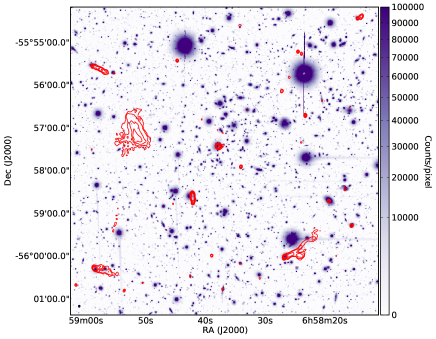
The surface brightness of region A is anomalously high for a relic, which suggests that it may be a remnant of a radio galaxy. Unfortunately, in this region on the edge of the cluster, we have not been able to find spectroscopically confirmed cluster members in the literature. However, in Clowe et al. (2006) they used R, B and V band Magellan IMACS images to determine color-selected likely cluster galaxies, a catalog of these sources is available from http://flamingos.astro.ufl.edu/1e0657/public.html. Although the redshift errors on these sources will be large, we have used this catalog together with the deep R-band Magellan IMACS image presented in Clowe et al. (2006) to search for the source of the diffuse radio emission (see the right panel of Figure 3). The R-band image reaches a limiting magnitude of 25.1 and for almost all of the other radio sources that we have detected a clear counterpart is seen in the R-band maps – this is demonstrated in the wide field R-band image presented in Figure 5. There is no obvious counterpart to the diffuse radio emission but there are many colour-selected likely cluster members close to the region of radio emission, particularly those near the south eastern area of region A, where in high resolution radio images we observe a tip to the emission (see the right panel of Figure 3). We would expect that the proposed dead radio galaxy is hosted by a giant elliptical galaxy (Matthews, Morgan, & Schmidt 1964) and a future study would be useful to conclusively identify nearby giant ellipticals and study their properties.
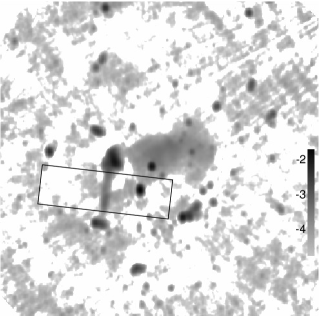
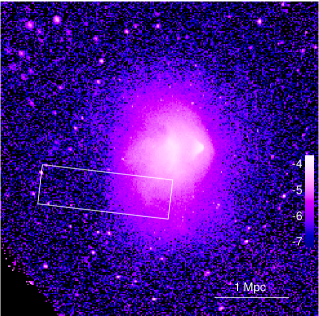
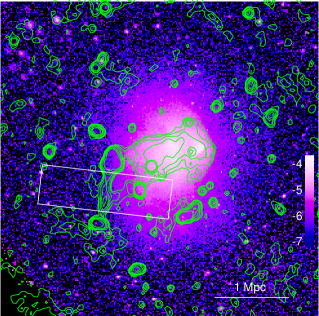
3.3 Region B: a second shock front in the Bullet cluster
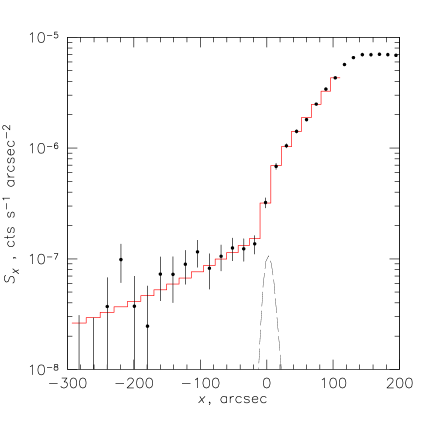
We have examined the X-ray image (Figure 6) in the region of the relic and discovered a clear X-ray brightness edge. The -wide white rectangle in Figure 6 is oriented perpendicular to region B of the relic and has the relic emission positioned in the middle; it is clear from the overlay of this rectangle (as well as of the radio contours) on the X-ray image that the X-ray edge coincides with the relic. To show this better, we have extracted an X-ray surface brightness profile in that rectangle, presented in Figure 7 with corresponding to the position of region B of the relic. A radio brightness profile, extracted in the same strip from the image shown on the left of Figure 6 (after excluding several bright point sources), is shown by a dashed line. It confirms the exact coincidence of the X-ray edge and the radio relic. The X-ray brightness edge is most prominent in this strip, although the X-ray image suggests it may extend by another to the north of the strip, although it is less sharp there and would not qualify as an “edge”. The X-ray edge in region B of the relic is defined well enough for us to attempt to derive the X-ray gas density and temperature jumps. The X-ray profile has the expected shape of a projected gas density discontinuity, as seen in many cold fronts and shock fronts (Markevitch & Vikhlinin 2007), and should allow us to derive the density jump. However, for that we need to know the radius of curvature of this discontinuity along the line of sight. The usual approach is to estimate the curvature of the brightness edge in the plane of the sky and assume it is the same in the line-of-sight direction. However, our relic is a straight line. Thus, we assume (guided by the shape of the cluster outside this region) that the curvature along the line of sight should not be very different from the distance to the cluster centre. We thus use this distance (1.0 Mpc from the cluster centre to the middle of the relic tail) and change it by factors of 0.5 and 2 to cover a conservative range of possibilities. We then fit the brightness profile in the immediate vicinity of the edge with a model consisting of a power-law density profile (with a free slope) inside the edge and a -model (Cavaliere & Fusco-Femiano 1978) outside (with a free slope and a fixed core radius for simplicity), with the amplitude and position of the density discontinuity being free parameters. This model provides an excellent fit (red histogram in Figure 7); obviously, it is degenerate with respect to the radius of curvature. For the nominal radius, the density jump is a factor of 2.67 (the rest of the best-fit parameters are: outer for a fixed core radius of 450 kpc, inner density power-law slope of , and the density jump position ). A 90% statistical interval (one-parameter, i.e., leaving all other parameters free) for the density jump is 2.19–3.19, and that for the jump position is . However, the systematic uncertainty on the jump amplitude is much greater — when the radius of curvature is changed by factors of 2 and 0.5, the best-fit density jumps are factors of 1.92 and 3.64, respectively. (We chose not to co-add these uncertainties, because the statistical error is measured, while the systematic one is just a guess.) If this edge were a shock front, using the Rankine-Hugoniot adiabat, the nominal best-fit density jump corresponds to a Mach number of 2.45, and its systematic uncertainty gives an interval (but see below for the upper bound).
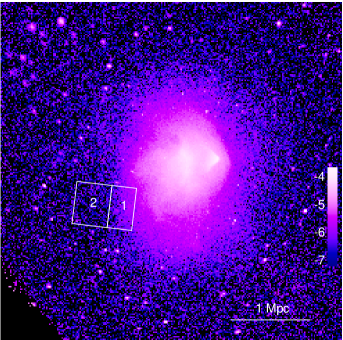
We have derived the gas temperature inside and outside the edge to confirm that this is a shock front. For a shock, we expect the temperature to be higher on the dense side, while for a cold front (another type of the density discontinuity commonly observed in clusters), the temperature jump would have the opposite sign. We fit the spectra for the regions inside and outside the edge, as shown in the left panel of Figure 8 (a subregion of the strip used for the brightness profile). The right panel of Figure 8 shows the best-fit values and 90% uncertainties, which include the background uncertainty (Section 2). While the temperature in the denser region is high, the temperature outside the edge is essentially unconstrained, so we cannot unambiguously confirm that this is a shock based on the sign of the temperature jump. However, with such a high temperature measured on the dense side, for this edge to be a cold front would require that the gas outside has keV, which is quite implausible at such distances from the centre. Thus, the feature is almost certainly a shock. This shock is opposite the well-known, western shock (Markevitch et al. 2002), similar to the pair of shocks on the opposite sides of the cluster merger seen in A2146 (Russell et al. 2010, 2012). If this is indeed a shock, a 90% upper limit on the temperature jump across this edge is a factor of 5.3 (taking into account the asymmetric errors on the two temperatures). While these are projected temperatures, the brightness contrast is sufficiently high and the errors sufficiently large for the projection effects to be unimportant. This constrains the Mach number at the high end better than the density jump does; our final value is .

4 Discussion
Radio relics are believed to be formed by shock-fronts in the peripheral regions of clusters (e.g. Ensslin et al. 1998 and Roettiger, Burns, & Stone 1999). This theory predicts that at radio wavelengths there should be spectral steepening across the relic, high polarisation levels, and diffuse emission associated with the ICM. Furthermore, there should be shock signatures in the X-ray emission from the ICM. We assert that regions A and B of the Bullet cluster, which have these properties, are a radio relic. As a consequence the Bullet cluster becomes one of only objects known to host both a radio relic and a radio halo. Unlike other relics, however, this relic has two distinct, but physically connected regions, which may provide interesting clues on the nature of peripheral relics in general, as we will discuss below.
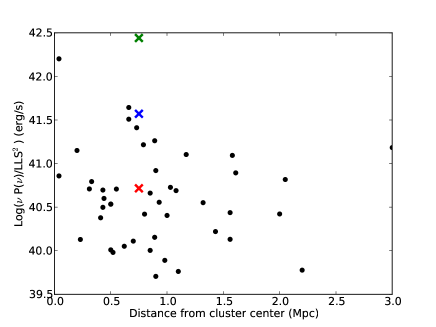
The entire relic structure has a maximum length of 930 kpc (210), a maximum width of 265 kpc (60) and a power of W/Hz (log=25.36 W/Hz) which makes this one of the most powerful radio relics known. Unlike typical radio relics, which have a fairly uniform surface brightness distribution (e.g. Feretti et al. 2012), for this relic 94% of the observed flux is from the northern bulb (region A). Furthermore, region A, with a largest linear size of just 330 kpc (75), has an exceptionally high surface brightness compared to both known radio relics and to the faint southern region B of the Bullet cluster relic (see Figure 9). An intriguing possibility is that the exceptionally high flux in region A is due to a large, pre-existing, population of relativistic electrons in this region. This existing population could be the remnants of a radio galaxy that have been reaccelerated by the same shock that created the relic in region B. If the remnants of the radio galaxy were reaccelerated then their original structure and properties would be disturbed and they may attain the characteristic alignment in the magnetic field as well as gradient in spectral index that is expected for a relic. The unusual properties of this radio relic may reveal a link between radio galaxies and radio relics.
Whilst the flux-distribution of this radio relic is unusual, the linear morphology of the emission is very similar to the Toothbrush relic that is associated with the galaxy cluster 1RXS J0603.3+4214 (see van Weeren et al. 2012). Hydrodynamical N-body simulations of that radio relic by Brüggen, van Weeren, Röttgering (2012) revealed that a linear shock could be reproduced with a three-cluster merger consisting of two equal-sized clusters and a third much smaller cluster. For this relic in the Bullet cluster, the linear shape does not necessitate the existence of a third cluster, because the X-ray image shows that the shock front is likely a segment of a larger-scale surface brightness contour with a large local radius of curvature, which does not deviate much from the general axial symmetry of the cluster.
Relics have steep spectral indices in the range to , but relics that are observed to be elongated, such as this proposed relic, have a mean spectral index of (Feretti et al. 2012). From our measurements of the spectral index, we determine the expected Mach number of the shock that produced the relic (Blandford & Eichler 1987) as
| (1) |
where is the average power law index of the energy spectrum of emitting electrons, including the ageing effect that gives “” in the equation (Ginzburg & Syrovatskii 1964), and is related to the integrated spectral index by . For regions A and B we derive Mach numbers of and , respectively. The Mach number for region B is in good agreement with the X-ray derived Mach number for the same region as derived in Section 3.3, consistent with the radio emission being the result of first order Fermi acceleration on the ICM shock.
We have been unable to measure the polarisation properties of region B, but within region A, we find that the 1.4 GHz fractional polarisation is lower than the 10-30% typically observed in relics (see e.g. Ferrari et al. 2008). However, similarly to other relics we find that the observed fractional polarisation changes significantly as a function of frequency (see Figure 4), with the fractional polarised intensity increasing with frequency (see e.g. Pizzo et al. 2011 and van Weeren et al. 2012). At 1.7 GHz, our detection of polarised emission is at low significance; at this frequency the fractional polarisation is but at 2.7 GHz the fraction is . By comparison, van Weeren et al. (2012) found that in the brightest region of the Toothbrush relic the fractional polarisation at 4.9 GHz is 15–30% but at 1.4 GHz it is below 1%, they suggested the depolarisation is caused by the ICM. For several radio relics, the de-rotated polarisation angles are aligned towards the cluster centre (see e.g. van Weeren et al. 2010). We are only able to measure the polarisation angle in region A of the relic, where the polarised intensity is highest, and find that the polarisation angle is approximately aligned with the axis of the cluster merger (E-W). Given that the rotation measure of the relic peaks at rad/m2, corresponding to a rotation of the polarisation angle by 14 degrees anticlockwise, this indicates that the B-vector is aligned approximately parallel to the shock surface as expected for a shock front compressing a random magnetic field (see Figure 3). This alignment is best in the northern region of the relic where the polarised emission is brightest. South of this the B-vector begins to deviate from the expected angle but this could be due to RM variations across the relic that we have not measured. We are unable to distinguish the rotation measure of the relic from the Galactic rotation measure contribution in this direction ( rad/m2; Oppermann et al. 2012), but, in this region, the error in the Galactic rotation measure is especially high due to the low density of measurements at declinations less than -40∘ in the study by Oppermann et al. (2012).
Only a handful of other examples of X-ray shocks at the positions of relics exist. Macario et al. (2011) detect surface brightness and temperature discontinuities in A754. Giacintucci et al. (2008) and Bourdin et al. (2013) detect an X-ray brightness edge and temperature jump in Abell 521. Ogrean et al. (2013b) detect shocks near the two relics in 1RXS J0603.3+4214 (none of which, however, have both unambiguous temperature and surface brightness jumps). Akamatsu & Kawahara (2013) found temperature (but not surface brightness) discontinuities in CIZA 2242.8+5301 (the Sausage relic) and the south eastern relic in Abell 3667. Finoguenov et al. (2010) and Akamatsu et al. (2012) detected both temperature and surface brightness discontinuities at the location of the north western relic in Abell 3667. Finally, for the Coma cluster relic, Ogrean & Brüggen (2013c) detect a temperature (but only a hint of density) discontinuity using XMM. Using Suzaku for the same relic, Akamatsu et al. (2013b) reported both the density and temperature jumps consistent with XMM, while Simionescu et al. (2013) reported a steeper decline of the surface brightness, which made it impossible to detect the pre-relic emission and derive its temperature. (At 2 Mpc from the cluster center, the Coma relic is more difficult to study in X-rays than others.) These X-ray results, albeit at different levels of confidence, support the idea that X-ray shocks influence radio relics in the cluster peripheral regions.
4.1 Source of seed electrons for reacceleration in peripheral relics?
These new observations pose a clear question: what is the difference between the eastern and the previously known western shock in the Bullet cluster? Both shocks have similar, rather low X-ray derived Mach numbers, for the western shock (Markevitch 2006) and for region B of our new relic. The western shock occurs in a higher density environment, and the study by Shimwell et al. (2014) showed that the radio halo emission in the Bullet cluster is certainly influenced by this shock, but the radio emission at the shock front is very weak and polarised emission was not detected at all (the spectral index has also remained undetermined in this region due to the faintness of the emission). By comparison, the radio relic emission from region A of the relic is from a region of very low density, yet the emission is very strong, has a distinctive spectral index gradient, and is significantly polarised. Even the weak emission from region B of the relic is significantly brighter than the radio halo emission at the western shock front.
For shocks of similar Mach numbers, the acceleration efficiency should be similar. Therefore, the resulting synchrotron radio brightness should be proportional to the density of the seed electrons that the shock accelerates, thus we may look there for the explanation (ignoring for a moment the possible difference in the magnetic field strength). We recall that region A of our relic looks like an old radio galaxy re-energized (its aged electrons reaccelerated) by a shock passage. While the tail B is coincident with the X-ray shock front, we also noted its possible physical connection to the bulb A (Section 3.1), with the polarized emission extending from the bulb into the tail (Figure 3). This is a strong hint that seed electrons in the tail could have been supplied by that same radio galaxy. In this scenario, the radio galaxy remnant may have polluted a peripheral region of the ICM (regions A+B), which may presently contain a mixture of relativistic and thermal ICM gas but still remain well-defined spatially. The density of the aged relativistic electrons there would be much higher than in the rest of the cluster (and in particular, in the region of the western shock), and a shock passage would generate a synchrotron feature spatially tracing that region. The region containing the old radio galaxy plasma may also have a higher than average magnetic field, further increasing the synchrotron brightness.
Most other peripheral relics do not show such a suggestive connection to a likely old radio galaxy, with notable exceptions including the Coma relic (Giovannini, Feretti, & Stanghellini 1991 and Enßlin & Brüggen 2002) and the northern relic in PLCKG287.0+32.9 (Bonafede et al. 2014), which apparently connects to the lobes of a radio galaxy. However, many relics do show features that are difficult to explain in the simple scenario where the shock (re-)accelerates seed electrons uniformly distributed throughout the ICM, or seed electrons coming directly from the thermal pool. Peripheral relics often have well-defined boundaries and a shape inconsistent with the expected lens-like or “umbrella in projection” shapes with tapered brightness at the ends expected in this scenario. For example, van Weeren et al. (2011) tried to model the Sausage relic with a shock front passing through seed particles distributed proportionally to the ICM density. Quoting their work: “One of the most intriguing properties of the northern relic in CIZA J2242.8+5301 is its very narrow width and rather uniform luminosity along its extent”, which their simulations could not reproduce. If, instead, the shape of the relic traces the underlying region of excess density of seed electrons (remaining from an old radio galaxy lobe), this may more easily explain the radio morphology of the Sausage, Toothbrush, and other, more irregular relics, few of which look like the clean, smooth ICM shock fronts seen in X-rays. In fact, at one end of the Sausage relic, there is a radio galaxy, apparently disconnected from the relic at present, but which could in the past have produced the underlying relativistic material for the relic. In our new relic in the Bullet cluster, we may have been lucky to catch the “smoking gun” — when the radio galaxy still has a relatively compact and dense component, while in other clusters, there may simply no longer be any visual clues of a past radio galaxy because it has been completely disrupted.
A possible problem for this scenario is how such well-defined, megaparsec-sized regions of the thermal / relativisitic gas mixture could survive the merger events. However, consider that clusters have strong radial gradients of the ICM specific entropy. In such a stratified, convectively stable atmosphere, a relatively small (compared to the cluster size) radio galaxy in the periphery can be mixed with the ICM by a merger. Once the merger induced disturbance subsides, the polluted region of the ICM is likely to spread as a pancake, or a sausage, along an equipotential surface that corresponds to its specific entropy. (This process may also stretch the initially random magnetic field preferentially along the same surface). At these off-center distances, such surfaces are approximately the spherical shells. In this picture, the relic region B is older than the region A and already had time to mix and spread, while A is relatively new — that is, A is the smoking gun and B is smoke from the previous shot. The period between the death of the radio galaxy and its complete disruption should be relatively short in a merging cluster. If a shock front passes across the polluted region of the ICM, it will reaccelerate its relativistic particles and create a giant, arc-like relic. It would be very interesting to check this scenario with numerical simulations which, so far, primarily assume a relatively uniform distribution of seed electrons (e.g. Vazza et al. 2012, Skillman et al. 2013 and Pinzke, Oh, & Pfrommer 2013). We also note that large, coherent peripheral relics such as the Sausage and our new relic are quite rare even in merging clusters, which might be explained by the required spatial coincidence of a shock passing across a region of seed-rich plasma in the cluster periphery. Furthermore, this explanation can justify why significantly more powerful than expected relics exist in some low-mass, low-luminosity clusters (e.g. Brown & Rudnick 2009).
The scenario where the radio relics result from a shock front re-energizing the aged radio plasma remaining from a local radio galaxy was proposed before by Ensslin & Gopal-Krishna (2001, hereafter E01) and most recently by Bonafede et al. (2014), using different physical mechanisms. In the “phoenix” model of E01 (see also Enßlin & Brüggen 2002), a cocoon of aged relativistic plasma, no longer emitting at the observable radio frequencies and in pressure equilibrium with the surrounding thermal ICM, is adiabatically compressed by a shock front that propagates in the ICM but skips the cocoon because of much higher sound speed there. This shifts the exponential cutoff of the synchrotron spectrum of the aged electrons to higher frequencies. To explain the observed power-law shape of the relic spectra in the usual radio band, this frequency increase must be large, requiring a large compression factor ( for simple assumptions about the magnetic field compression, e.g., Markevitch et al. 2005). The “phoenix” model takes full advantage of the fact that adiabatic compression factor can be much higher than shock compression for the same increase of pressure; the former is and unlimited, while the latter is limited by factor 4. Still, to explain the observed spectrum of the Coma relic, E01 considered a shock with a factor 40 pressure jump, corresponding to a rather high , which is much higher than the recent X-ray results for Coma (e.g Ogrean & Brüggen 2013c derive a pressure jump of at most a factor of 5) and in general not observed in any cluster so far. For our shock at the position of the Bullet relic, the pressure jump is at most a factor 15 (, see Section 3.3); furthermore, a distinct cocoon at the position of the shock would create a noticeable X-ray cavity and make it difficult to observe a characteristic sharp X-ray brightness edge shown in Figure 7.
A more attractive mechanism is shock reacceleration of the fossil electrons mixed with the ICM (e.g., Ensslin et al. 1998; Markevitch et al. 2005; Kang & Ryu 2011; Kang, Ryu, & Jones 2012; Pinzke, Oh, & Pfrommer 2013). It is efficient even for relatively low Mach numbers typically seen in clusters, and it naturally produces power-law synchrotron spectra (with slopes consistent with the X-ray shock Mach number for well-observed and well-modeled shocks — i.e., those with clear geometry and both the temperature and density jumps measured in X-ray, e.g., Giacintucci et al. 2008; Macario et al. 2011; Bourdin et al. 2013). So far, simulations of relic formation by reacceleration inject the fossil electrons through a series of shocks in the cluster (Pinzke, Oh, & Pfrommer 2013) but Bonafede et al. (2014) noted a connection of the relic in PLCKG287.0+32.9 with lobes of a radio galaxy and suggested that that galaxy might be the source of fossil plasma for reacceleration. Our scenario for the Bullet cluster relic is similar; we extend it by speculating how such regions of the polluted ICM may naturally assume the geometric shape of the observed relics.
Comparing the two Bullet cluster shocks in greater detail will assist in our understanding of the relationships between radio relics, radio halos and radio sources. Unfortunately, the present generation of X-ray telescopes are unlikely to provide significantly more information as we are already exploiting 500 ks of Chandra data. One possibility that may become available is to use high resolution Sunyeav Zel’dovich (Sunyaev & Zel’dovich 1972) observations to search for pressure substructures at the position of the shocks (e.g. Planck Collaboration et al. 2013).
5 Conclusions
We have analysed both radio and X-ray observations of the Bullet cluster and in the peripheral region of the cluster, we find a powerful radio relic. We have found a sharp edge in the X-ray surface brightness at the region of the radio relic which is a signature of a likely shock from in the ICM. Our observations support the theory that shocks in the peripheral regions of galaxy clusters can create radio relics. From our study our main conclusions are the following:
-
•
The location, spectral and polarimetric properties of the elongated radio emission to the east of the Bullet cluster are consistent with the properties expected for a radio relic.
-
•
The relic 1.4 GHz power of W/Hz makes this one of the most powerful radio relics known.
-
•
The morphology of the Bullet cluster relic is reminiscent of the “toothbrush-relic” associated with the galaxy cluster 1RXS J0603.3+4214 (see van Weeren et al. 2012).
-
•
The X-ray image shows an ICM density edge exactly tracing the tail region of the relic, which suggests that there is a shock front at that location. If this is indeed a shock, its Mach number derived from the X-rays is in agreement with the radio spectral index under the assumption of first order Fermi shock acceleration.
-
•
The relic consists of the tail, coincident with the X-ray shock, and an anomalously bright “bulb” region that appears to be physically connected to the tail. The bulb may be a remnant of a radio galaxy that has supplied seed electrons for shock acceleration in the relic. Such a scenario may be applicable to other peripheral relics, where such a“smoking gun” is not obvious due to a greater age of the structure or a stronger cluster disturbance. This would explain certain peculiar features of the peripheral relics.
6 Acknowledgements
The Australia Telescope Compact Array is part of the Australia Telescope National Facility which is funded by the Commonwealth of Australia for operation as a National Facility managed by CSIRO. B.M.G. acknowledges the support of Australian Laureate Fellowship FL100100114 from the Australian Research Council. M.J.-H. acknowledges support from the Marsden Fund. M.J.-H. acknowledges support from the Marsden Fund. We thank Douglas Clowe for kindly providing the R-band image and we thank the anonymous referee for comments.
References
- Akamatsu et al. (2012) Akamatsu H., de Plaa J., Kaastra J., Ishisaki Y., Ohashi T., Kawaharada M., Nakazawa K., 2012, PASJ, 64, 49
- Akamatsu & Kawahara (2013) Akamatsu H., Kawahara H., 2013, PASJ, 65, 16
- Akamatsu et al. (2013b) Akamatsu H., Inoue S., Sato T., Matsusita K., Ishisaki Y., Sarazin C. L., 2013, PASJ, 65, 89
- AMI Consortium: Franzen et al. (2011) AMI Consortium: Franzen T. M. O et al., 2011, MNRAS, 415, 2699
- Blandford & Eichler (1987) Blandford R., Eichler D., 1987, Phys Rep, 154, 1
- Brüggen et al. (2012) Brüggen M., Bykov A., Ryu D., Röttgering H., 2012, Space Sci Rev, 166, 187
- Brüggen, van Weeren, Röttgering (2012) Brüggen M., van Weeren R. J., Röttgering H. J. A., 2012, MNRAS, 425, L76
- Brunetti & Jones (2014) Brunetti G., Jones T. W., 2014, Int J Modern Phys D, 23, 30007
- Brown & Rudnick (2009) Brown S., Rudnick L., 2009, AJ, 137, 3158
- Bourdin et al. (2013) Bourdin H., Mazzotta P., Markevitch M., Giacintucci S., Brunetti G., 2013, ApJ, 764, 82
- Bonafede et al. (2014) Bonafede A., Intema H. T., Brüggen M., Girardi M., Nonino M., Kantharia N., van Weeren R. J., Röttgering H. J. A., 2014, ApJ, 785, 1
- Cavaliere & Fusco-Femiano (1978) Cavaliere A., Fusco-Femiano R., 1978, A&A, 70, 677
- Clowe et al. (2006) Clowe D., Bradač M., Gonzalez A. H., Markevitch M., Randall S. W., Jones C., Zaritsky D., 2006, ApJ, 648, L109
- Ensslin et al. (1998) Ensslin T. A., Biermann P. L., Klein U., Kohle S., 1998, A&A, 332, 395
- Enßlin & Gopal-Krishna (2001) Enßlin T. A., Gopal-Krishna, 2001, A&A, 366, 26
- Enßlin & Brüggen (2002) Enßlin T. A., Brüggen M., 2002, MNRAS, 331, 1011
- Feretti et al. (2012) Feretti L., Giovannini G., Govoni F., Murgia M., 2012, A&A Rev, 20, 54
- Ferrari et al. (2008) Ferrari C., Govoni F., Schindler S., Bykov A. M., Rephaeli Y., 2008, Space Sci Rev, 134, 93
- Finoguenov et al. (2010) Finoguenov A., Sarazin C. L., Nakazawa K., Wik D. R., Clarke T. E., 2010, ApJ, 715, 1143
- Giacintucci et al. (2008) Giacintucci S., et al., 2008, A&A, 486, 347
- Ginzburg & Syrovatskii (1964) Ginzburg, V. L., & Syrovatskii, S. I. 1964, The Origin of Cosmic Rays (Pergamon)
- Johansson et al. (2012) Johansson D., et al., 2012, A&A, 543, A62
- Skillman et al. (2013) Skillman S. W., Xu H., Hallman E. J., O’Shea B. W., Burns J. O., Li H., Collins D. C., Norman M. L., 2013, ApJ, 765, 21
- Giovannini, Feretti, & Stanghellini (1991) Giovannini G., Feretti L., Stanghellini C., 1991, A&A, 252, 528
- Hickox & Markevitch (2006) Hickox R. C., Markevitch M., 2006, ApJ, 645, 95
- Hong et al. (2014) Hong S. E., Ryu D., Kang H., Cen R., 2014, ApJ, 785, 133
- Kang & Ryu (2011) Kang H., Ryu D., 2011, Ap&SS, 336, 263
- Kang, Ryu, & Jones (2012) Kang H., Ryu D., Jones T. W., 2012, ApJ, 756, 97
- Liang et al. (2000) Liang H., Hunstead R. W., Birkinshaw M., Andreani P., 2000, ApJ, 544, 686
- Liang et al. (2001) Liang H., Ekers R. D., Hunstead R. W., Falco E. E., Shaver P., 2001, MNRAS, 328, L21
- Macario et al. (2011) Macario G., Markevitch M., Giacintucci S., Brunetti G., Venturi T., Murray S. S., 2011, ApJ, 728, 82
- Markevitch et al. (2000) Markevitch M., et al., 2000, ApJ, 541, 542
- Markevitch et al. (2002) Markevitch M., et al., 2002, ApJ, 567, L27
- Markevitch et al. (2005) Markevitch M., Govoni F., Brunetti G., Jerius D., 2005, ApJ, 627, 733
- Markevitch (2006) Markevitch M., 2006, Proceedings of the The X-ray Universe 2005, 604, 723
- Markevitch & Vikhlinin (2007) Markevitch M., Vikhlinin A., 2007, Phys Rep, 443, 1
- Matthews, Morgan, & Schmidt (1964) Matthews T. A., Morgan W. W., Schmidt M., 1964, ApJ, 140, 35
- Nuza et al. (2012) Nuza S. E., Hoeft M., van Weeren R. J., Gottlöber S., Yepes G., 2012, MNRAS, 420, 2006
- Ogrean et al. (2013a) Ogrean G., Brüggen M., Simionescu A., Röttgering H., van Weeren R. J., Croston J. H., Hoeft M., 2013, Astron Nachrichten, 334, 342
- Ogrean et al. (2013b) Ogrean G. A., Brüggen M., van Weeren R. J., Röttgering H., Croston J. H., Hoeft M., 2013, MNRAS, 1414
- Ogrean & Brüggen (2013c) Ogrean G. A., Brüggen M., 2013, MNRAS, 1491
- Oppermann et al. (2012) Oppermann N., et al., 2012, A&A, 542, A93
- Pizzo et al. (2011) Pizzo R. F., de Bruyn A. G., Bernardi G., Brentjens M. A., 2011, A&A, 525, A104
- Reynolds (1994) Reynolds J.E., 1994, A revised flux scale for the AT Compact Array AT Memo 39.3/040 http://www.atnf.csiro.au/observers/memos/ .
- Owers et al. (2009) Owers M. S., Nulsen P. E. J., Couch W. J., Markevitch M., 2009, ApJ, 704, 1349
- Owers et al. (2011) Owers M. S., Randall S. W., Nulsen P. E. J., Couch W. J., David L. P., Kempner J. C., 2011, ApJ, 728, 27
- Simionescu et al. (2013) Simionescu A., et al., 2013, ApJ, 775, 4
- Planck Collaboration et al. (2013) Planck Collaboration, et al., 2013, A&A, 554, A140
- Pinzke, Oh, & Pfrommer (2013) Pinzke A., Oh S. P., Pfrommer C., 2013, MNRAS, 435, 1061
- Press & Schechter (1974) Press W. H., Schechter P., 1974, ApJ, 187, 425
- Roettiger, Burns, & Stone (1999) Roettiger K., Burns J. O., Stone J. M., 1999, ApJ, 518, 603
- Russell et al. (2010) Russell H. R., Sanders J. S., Fabian A. C., Baum S. A., Donahue M., Edge A. C., McNamara B. R., O’Dea C. P., 2010, MNRAS, 406, 1721
- Russell et al. (2012) Russell H. R., et al., 2012, MNRAS, 423, 236
- Shimwell et al. (2014) Shimwell T. W., Brown S., Feain I. J., Feretti L., Gaensler B. M., Lage C., 2014, MNRAS, 440, 2901
- Sunyaev & Zel’dovich (1972) Sunyaev R. A., Zel’dovich Y. B., 1972, Comments on Astrophys and Space Phys, 4, 173
- Tucker, Tananbaum, & Remillard (1995) Tucker W. H., Tananbaum H., Remillard R. A., 1995, ApJ, 444, 532
- Tucker et al. (1998) Tucker W., et al., 1998, ApJ, 496, L5
- Vazza et al. (2012) Vazza F., Brüggen M., van Weeren R., Bonafede A., Dolag K., Brunetti G., 2012, MNRAS, 421, 1868
- van Weeren et al. (2010) van Weeren R. J., Röttgering H. J. A., Brüggen M., Hoeft M., 2010, Sci, 330, 347
- van Weeren et al. (2011) van Weeren R. J., Brüggen M., Röttgering H. J. A., Hoeft M., 2011, MNRAS, 418, 230
- van Weeren et al. (2012) van Weeren R. J., Röttgering H. J. A., Intema H. T., Rudnick L., Brüggen M., Hoeft M., Oonk J. B. R., 2012, A&A, 546, A124
- Venturi et al. (2013) Venturi T., Giacintucci S., Dallacasa D., Cassano R., Brunetti G., Macario G., Athreya R., 2013, A&A, 551, A24