The Blackhole-Dark Matter Halo Connection
Abstract
We explore the connection between the central supermassive blackholes (SMBH) in galaxies and the dark matter halo through the relation between the masses of the SMBHs and the maximum circular velocities of the host galaxies, as well as the relationship between stellar velocity dispersion of the spheroidal component and the circular velocity. Our assumption here is that the circular velocity is a proxy for the mass of the dark matter halo. We rely on a heterogeneous sample containing galaxies of all types. The only requirement is that the galaxy has a direct measurement of the mass of its SMBH and a direct measurement of its circular velocity and its velocity dispersion. Previous studies have analyzed the connection between the SMBH and dark matter halo through the relationship between the circular velocity and the bulge velocity dispersion, with the assumption that the bulge velocity dispersion stands in for the mass of the SMBH, via the well-established SMBH mass-bulge velocity dispersion relation. Using intermediate relations may be misleading when one is studying them to decipher the active ingredients of galaxy formation and evolution. We believe that our approach will provide a more direct probe of the SMBH and the dark matter halo connection. We find that the correlation between the mass of supermassive blackholes and the circular velocities of the host galaxies is extremely weak, leading us to state the dark matter halo may not play a major role in regulating the blackhole growth in the present Universe.
1 Introduction
Data has been accumulating over the last several years on an increasing number of galaxies in terms of measurements of the bulge velocity dispersion , mass of the central supermassive blackhole (SMBH) , and the circular velocity, , of the host galaxy (McConnell & Ma 2013; Hu 2009; Graham 2008; Hu 2008; Ho 2007; Courteau et al. 2007; Pizella et al. 2005; Baes et al. 2003; Ferrarese 2002; Tremaine et al. 2002; Onken et al 2004; Peterson et al. 2004; Nelson et al. 2004; Merrit and Ferrarese 2001; Bedregal et al. 2006; Bernardi et al. 2002; Kronawitter et al. 2000; Palunas et al. 2000; Prugniel et al 2001; Verheijen et al. 2001). With the increase in the number of the galaxies for which , , and have been measured, it is becoming possible to ask, and attempt to answer, questions about the processes that govern the formation of galaxies and their central SMBHs, and the symbiotic relationship between an SMBH and its host galaxy. One way to approach these issues is to compare observed correlations, or lack thereof, between , , and with theoretical predictions obtained from models of galaxy/SMBH formation (e.g., Di Matteo et al. 2008; Di Matteo et al. 2003; Haehnelt & Kauffmann 2000; Kauffmann & Haehnelt 2000).
The observed relation is now on a firm basis (Beifiori et al. 2012; Gultenkin et al. 2009; Hu 2009; Graham 2008; Hu 2008; Tremaine et al. 2002; Ferrarese & Merritt 2000; Gebhardt et al. 2000) and it points to a common history between the SMBH and the spheroidal component of galaxies. Moreover, it was recently found that and are correlated (Courteau et al. 2007; Baes et al. 2003, Ferrarese 2002). However, Ho (2007) by a using a sample of 792 galaxies have shown that the relation has a very large scatter, and it depends on galaxy morphology.
Ferrares (2002) investigated the possibility of the masses of the supermassive blackhole being correlated with the total gravitational mass of the host galaxy or the mass of the dark matter halo. The author found a tight correlation between and for a sample of 36 galaxy, and by using the well-known relation, and connecting the mass of the dark matter halo with the circular velocity of the galaxy, report a correlation between the mass of the supermassive blackhole and the circular velocity of the host galaxy. Baes et al. (2003) reported a relation between and . The rationale behind this correlation is that both quantities depend on the mass of the dark matter halo. A heavier halo will result in a deeper potential well that will give rise to a higher , and at the same time lead to a higher . Zasov et al. (2005), on the other hand, found a very weak correlation between and . However, the values in both Baez et al. (2003) and Zasov et al. (2005), as well as in Ferrarese (2002), were obtained from the relation. Ho et al. (2008) report a correlation between and for a sample of active galaxies, where the SMBH masses were measured using the virial method (Kaspi et al. 2000; Greene & Ho 2005). More recently, Kormendy et al. (2011) used dynamical measurements to find that relation is very weak in a sample of 25 spiral galaxies. The same result is confirmed in Beifiori et al. (2012) who used a large sample, 105 galaxies, but the used ’s are a mix of dynamical measurements from Gultekin et al. (2009a) and upper limits from Beifiori et al. (2009), with the upper limits taken as surrogate of black mass. More recently, Sun et al. (2013) analyzed the relation for 22 galaxies with determined from H I observations, and came up with a broad relation with large instrinsic scatter.
Given the controversy surrounding the relation and its strength, using relations to find blackholes masses will only introduce additional scatter and makes it more difficult to reach firm conclusions for or against a genuine relation. Most of the previous studies that have investigated the relation between and the circular velocity did so indirectly since they ”measured” the SMBH masses through the relation for galaxies with measured and . The danger in the indirect approach is that one is at the risk of masking, or leading to, a correlation between through the and , and it necessarily ignores bulge-less spirals with SMBHs, further masking the true connection between the SMBH and the dark matter halo.
The aim of this paper is to present a direct study of the nature of the relation for 53 galaxies with dynamically measured . This is the largest sample to date of galaxies that have these two properties available. We also present, as a by-product of our study, the relation based on 89 galaxies. We are revisiting the question of the relation with a slightly ”cleaner” sample of blackhole masses. It is our hope here that by using dynamical ’s we will be able to probe directly the intrinsic relations between a SMBH and the dark matter halo of the host galaxy.
2 Description of the Sample
Our main objective is to build a sample of galaxies that have dynamical and measurements. In order to make sure that we are not missing any objects we collected a large sample of 376 galaxies of all types for which measurements of , , and/or exist. This large sample was culled from papers that present measurements of SMBH masses (McConnell & Ma 2013; Gultenkin et al. 2009a; Pastorini et al 2007; de Fransesco et al. 2006; Ferrarese & Ford 2005; Onken et al. 2004; Peterson et al. 2004; Nelson et al. 2004; Gebhardt et al. 2000; Kaspi et al. 2000; Richstone 1998), papers that study the relation (Hu 2009; Gultekin et al. 2009a, Graham 2008; Hu 2008; Tremaine et al. 2002; Gebhardt et al. 2000; Ferrarese & Merritt 2000), and papers that deal with the and/or relationships (Kormendy et al. 2011; Courteau et al. 2007; Ho 2007; Pizella et al. 2005; Baes et al. 2003; Ferrarese 2002).
We found 342 galaxies with measurements, 269 galaxies with , and 125 galaxies with . We reject 35 out of the 125 blackhole masses since they are determined via reverberation mapping, which is caliberated to the relation (Onken et al. 2004; Peterson et al. 2004). The intersections between these subsets resulted in 53 galaxies that have dynamical and , 89 galaxies with both dynamical and , and 251 galaxies that have both and .
When error bars on a quantity for a particular galaxy are not available we assign an error by multiplying that quantity by the average percent error derived for that quantity from all galaxies that have errors. Out of 342 galaxies that have values, 332 have errors listed, and 251 out of 269 galaxies have errors on . The average percent error on is % and on is %. All available SMBH dynamical mass measurements have error bars quoted in the literature. The errors bars on are not symmetric. We calculate the average of the interval and assign this error to the data point when peforming the fits.
We list in Table 1 our final sample of 89 galaxies with dynamically-determined SMBH masses, stellar velocity dispersions, and circular velocities (53 out of 89). All of the values are from HyperLeda1 (Paturel et a. 2003) except for IC 2560 (Garcia-Rissman et al. 2005) and Cygnus A (Graham 2008), and MW (Baes et al. 2003; Ferrarese 2002). Most of the blackhole masses are from Hu (2009) and McConnell & Ma (2013) except for NGC 1300; NGC 2748; NGC 2778; NGC 4342; NGC 4374; NGC 4945; NGC 7582 (Graham 2008), NGC 4303 (Pastorini 2007), NGC 4486 Kormendy et al. (1996), NGC 4594 (Kormendy et al. 1988). The distances in Table 1 are from the above-mentioned papers. We include in Table 1 references to the original papers and the methods used to measure the blackhole masses.
We use circular velocities from optical rotation curves whenever available: NGC 2787, NGC 1023, NGC 3115, NGC 3384, and NGC 4649 (Neistein et al. 1999); NGC 1399, NGC 3379, NGC 4374, NGC 4486, and NGC 4486B (Kronawitter et al. 2000), and NGC 5846 (Pizzella et al. 2005). We use circular velocities derived from H I line widths as listed in Courteau et al. (2007) for: MW, NGC 224, and NGC 4258 (Ferrarese et al. 2002); NGC 2974 (Pizzella et al. 2005); and NGC 3031, NGC 3227, NGC 4303, and NGC 4594 (Prugniel et al. 2001). We use at face value the circular velocities in HyperLeda for the remaining 34 galaxies. They are also based on H I line widths, which brings the number of galaxies in our sample with derived from H I line widths to 42. We note here that the results that we arrive at below do not depend on the origin of the circular velocities.
3 Analysis and Discussion
Studying the correlations involves fitting straight lines in log-log space: . The results of the fitting have been known to depend in part on the details of the linear regression analysis (Tremaine et al. 2002). For the sake of definiteness, we limit ourselves to the prescription of Press et al. (1992) for data with symmetric error bars on both variables. The errors on and are fitting errors when differs by unity from its mininum value. A shortcoming of this approach is that it does not take into account the presence of intrinsic dispersion in the data. We follow the quick fix offered by Tremaine et al. (2002): we add in quadrature a parameter to the error of the y-coordinates (Gebhardt et al. 2000). This parameter is a measure of the intrinsic dispersion. Its value is adjusted by hand to lead a reduced chi-squared of unity. This prescription (Tremaine et al. 2002) is essentially implemented in FITEXY and, its more advanced variant MPFITEXY (Markwardt 2009; Williams et al. 2010), which is what we use in this paper.
3.1 A Relation?
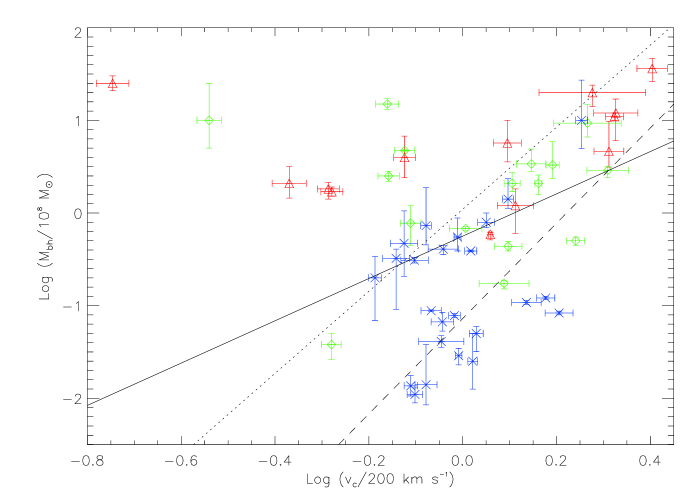
We plot in Fig. 1 against for 53 galaxies, made up of 13 ellipticals, 16 lenticulars, and 24 spirals. (Table 1). It is clear that 3 galaxies whose km s-1 don’t fall in the region where the other data points cluster. These 3 galaxies are IC 1459 (E3), NGC 5252 (S0), and NGC 3608 (E2). We do not include them in our subsequent analysis when we fit:
| (1) |
to the data points in Fig. 1.
A casual inspection of Fig. 1 shows that the correlation between the and , if there is any, is very weak. Taken separately, galaxies belonging to the same morphological type form essentially scatter plots and at best barely show a hint of a correlation. A visual inspection in Fig. 1 that does not distinguish between the galaxy types can be misleading. An apparent correlation will appear to be present if one is not careful. The spirals, represented as blue crosses, have on average lower blackhole masses and velocities than the ellipticals and the lenticulars. Placed on the same plot, this offset between spiral and E/S0 galaxies makes one to believe that there is a correlation.
To be more quantitative, we use the procedure outlined above to obtain:
| (2) |
with an intrinsic scatter of 0.75 dex. The intrinsic scatter is very large and so is the error on the slope. This leads to conclude that there is no correlation between the mass of supermassive blackhole and the circular velocity of the host galaxy. This result is broadly consistent with those of Sun et al. (2013), Beifiori et al. (2012), and Kormendy et al. 2011.
Previous authors have studied the relation between and and their conclusions are varied. Baes et al. (2003) reported a slope of for a sample of 40 galaxies. However, Baes et al. (2003) determined the masses of the blackholes indirectly by using the well-established relation of Tremaine et al. (2002). They combined their relation with the relation of Tremaine et al. (2002) to derive a relation. Ho (2007) using a sample of 792 galaxies has shown that the relation has appreciable variation depending on host galaxy properties. Ho (2007) cautions against replacing the bulge, i.e. stellar velocity , with the halo, , in attempts to use to derive blackhole masses based on a relation. The slope arrived at by Baes et al. (2003) is in agreement with the predictions of cosmological simulations (Di Matteo et al. 2003), but it is an artefact of combining the relation with the less accurate relation. Zasov et al. (2005) found significant scatter in the plots and concluded that the relation between is very weak. Their sample of 41 galaxies suffered contamination from galaxies, 20 in number, whose blackhole masses were determined indirectly from the relation. Sabra et al. (2008) reported a slope of based on a small sample of only 16 galaxies.
Bandara et al. (2009) reported a correlation between and , the total gravitational mass of the host galaxy. The total mass was determined from gravitational lensing observations, and their blackhole masses were determined indirectly through the relation (Gultenkin al. 2009a). However, when they calculate through the relation (Graham et al. 2001; 2007), where is the Sersic index, they find no signficant correlation between and .
We derive here the expected relation from the Bandara et al. (2009) relation:
| (3) |
We use eq. (5) in Ferrarse (2002), in which the author assumes that is equal to the virial velocity and uses relations from Bullock et al. (2001) between the mass of the dark matter halo and the circular velocity, We further assume that the total gravitational mass is equal to the mass of the dark matter halo to get:
| (4) |
Combining eqs. (3) and (4) above we obtain the following:
| (5) |
Eq. (5) is semi-observational in the sense that it depends on an observational relation eq. (3) that connects the mass of the blakchole to the total gravitational mass of the galaxy, and on the theoretical relation eq. (4) that connects the mass of the dark matter halo to the circular velocity of the galaxy.
We also derive a theoretical counter-part to Eq. (5) by using
| (6) |
reported in di Matteo et al. (2003) from cosmological simulations, combined with the theoretical prescription of Ferrarese (2002) derived from Bullock et al. (2001), eq. (4) above, to obtain:
| (7) |
We overplot eqs. (5) and (7) in Fig. 1. Most of the 46 galaxies fall between these two relations. The 6 galaxies, the three left-most of which we do not include in the fits, that are to the left are all early-types. The slopes in eqs. (5) and (7) are similar, but the intercepts are different. This difference could be due to the assumptions made in deriving the two equations. In deriving equation (5) we assumed that mass of the dark matter halo is equal to the total gravitational mass of the galaxy. This assumption affects the intercept of the resulting relation. For example, if the mass of the dark matter halo is 90% of the total gravitiatonal mass, a reasonable assumption to make, then the intercept in eq. (5) would increase by 0.07, not enough to make the intercepts comparable. On the other hand, the reason of the difference could be even more fundamental and has to do with the nature of the simulations from which eq. (6) is derived (di Matteo et al. 2003)
3.2 Relation:
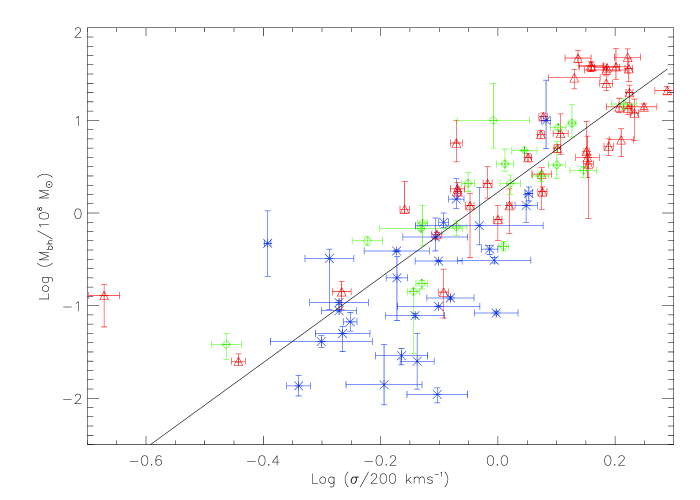
We plot in Fig. 2 versus for the 89 galaxies from Table 1. The data can be fit by a straight line:
| (8) |
We estimate the intrinsic dispersion to be dex. The slope and normalization derived here agree, within the errors, with those of Gultenkin et al. (2009), Hu (2009), Graham (2008), Tremaine et al. (2002), and Merritt & Ferrarese (2001), however, it is shallower than that reported by Beifiori et al. (2012) and McConnell & Ma (2013). The relation is also in agreement with theoretical models (Di Matteo et al. 2003; Di Matteo et al. 2007).
The amount of intrinsic scatter in our is less than that for the above. This is in contrast to the values reported in Volonteri et al. (2011) in which the authors argue that the comparable intrinsic scatter in the and the relations indicates that there is a trend of some sort between and . Our sample, consisting of 89 galaxies, is larger than the one used in Gultekin et al. (2009a), 49 galaxies, and Volonteri et al. (2011), 25 galaxies used by Kormendy et al. (2011). In contrast, to Fig. 1, galaxies in Fig. 2 of all morphological types are spread out over roughly the same region.
3.3 Indirect ?
The large scatter in the plot (Fig. 1) is contrary to what was found in some earlier studies (Ferrarese 2002; Baes et al. 2003). Baes et al. (2003) have calculated the blackhole masses indirectly by relying on the relation and then plotted against . They used the relation of Tremaine et al. (2002) with their relation to derive a relation. It is important to keep in mind that Baes et al. (2003) did not fit and . Our result here corroborates recent work by Beifiori et al. (2012) and Kormendy et al. (2011), but using a larger sample of dynamical blackhole masses.
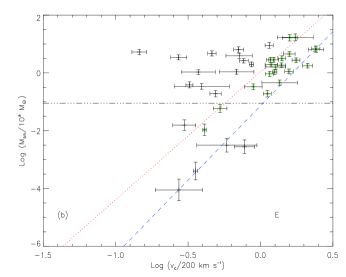
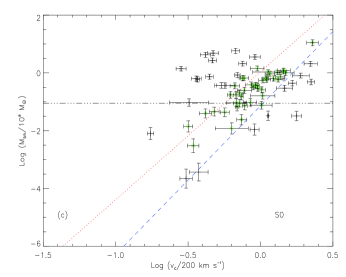
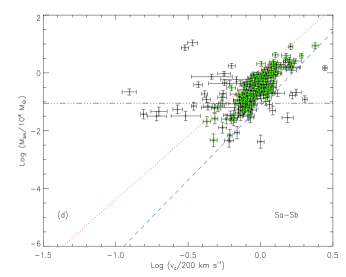
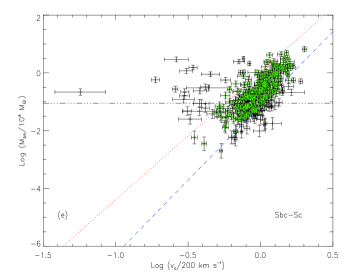
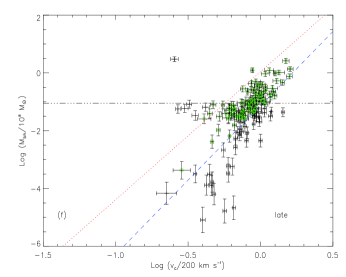
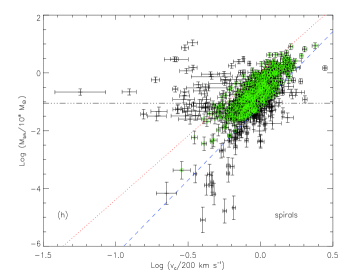
To circumvent biases that could affect analysis relying on small samples, we use the very large sample of Ho (2007) to show that there will be a significant scatter in the plots, even when using a relation, which by itself could introduce a relation which is not necessarily there (cf. our discussion above of Ferrarese (2002) and Baes et al. (2003). Ho (2007) presents and , together with other information, on 792 galaxies to study the relation. Given the ’s in Ho (2007), we use our relation, eq. (8), to calculate the corresponding blackhole masses for all the 792 galaxies. The errors on and the uncertainties on the slope and normalization of the relation are propagated in quadrature together with the intrinsic scatter in at constant to calculate the uncertainties on the derived ’s. We then plot the calculated masses against the corresponding for the 792 objects (Fig. 3). The green circles are ”kinematically normal” galaxies (Ho 2007) with . We also overplot eq. (5), which is based on the observed correlation between and (Bandara et al. 2009), and eq. (7), which is based on the theoretical correlation between and (di Matteo et al. 2003). As a visual aid, the horizontal line marks the blackhole mass obtained from eq. (8) for km s-1.
There is a significant amount of scatter with many galaxies occupying a wide swath with km s-1 and M⊙; roughly the same region bounded by eqs. (5) and (7). Most of the galaxies in this region are ”kinematically normal” (Ho 2007). The majority of galaxies in this region are spirals (Sa to Sc, Fig, 3d-e). Moreover, for any given morphological type, the spirals have the highest percentage of occupying this region. However, the region has quite a large scatter, roughly an order of magnitude, in for a given . This makes using it as a kind of a relation between the mass of central blackhole and the circular velocity of the host galaxy problematic, or at least not as beneficial as the relation, which is used as probe of the co-evolution, in terms of redshift and morphology, of galaxy spheroids and the supermassive blackholes.
Apart from showing that masses of the supermassive blackholes are poorly correlated with the circular velocities of their host galaxies, Fig. 3 uncovers a few interesting points. There are virtually no galaxies that have high circular velocities but low blackhole masses (empty lower right corner), whereas low circular velocity apparently places no constraints on the mass of the blackhole (the vertical scatter with km s-1). The first part is expected: A high circular velocity is related to a more massive halo, and a more massive halo leads to a deeper potential well, and hence more infalling material that eventually accretes onto the central supermassive blackhole.
We address the second part through studying the plot, Fig. 3a, by morphological type (Fig. 3b to 3e). Many elliptical and lenticular galaxies have high blackhole masses, M⊙, but with circular velocities as low as km s-1 and as high as km s-1. They form the horizontal scatter in Figs. 3b & 3c. These galaxies have km s-1. The horizontal scatter shows that the blackhole mass and the circular velocity of the host galaxies are not correlated in any way. However, one must be careful in the interpretation. The circular velocities used here are based on integrated H I velocity profiles, which are less than velocities obtained from optical rotation curves for early type galaxies (see Ho 2007). The discrepancy is almost a factor of 2. This can explain the spread of early type galaxies (morphological index ) to the left in Figs. 3b & 3c, and also in Fig. 3d (Sa & Sb spirals). One the other hand, the points in the lower part of Fig. 3f are very late type, bulgeless galaxies whose stellar velocity dispersion is km s-1 and most of it is contributed by the rotation of the disk.
It seems that the only galaxies that follow some sort of a correlation are the kinematically normal galaxies. However, the reasoning here seems circular. This could be another manifestation of the ”cosmic conspiracy” discussed in Kormendy et al. (2011). The kinematically normal galaxies by definition have with an average . This fact, taken with the relation (eq. 8), means that . If we fit the 616 kinematically normal galaxies in Fig. 3a, we get:
| (9) |
with no intrinsic dispersion, since it was already included in the calculation of the error on the derived . If this intrinsic scatter is not included, then the intrinsic dispersion in eq. (9) is dex. The slope is consistent with that expected from a relation via a : the expected slope is . The intrinsic scatter is significantly less than when fitting using dynamical as in eq. (2). The intrinsic scatter would disappear if we include the intrinsic dispersion of our relation in the errors of the calculated black hole masses. This is expected intrinsic scatter in this case is build in, and it behaves like another source of error since it dominates the measurement errors.
4 Conclusions
This paper highlights the importance of the need to use direct values of the quantities being used to study the relation. We attempted here to use dynamical measurements of blackhole masses since these measurements are ”clean” in the sense that they do not depend on the properties of the host galaxy. Another issue that deserves similar attention is the getting similarily ”clean” measurements of the circular velocities. Circular velocities depend on the where they are being measured in the galaxy, and the conversion between the circular velocity of the galaxy and the circular velocity of the halo is model dependent. In this study to took the pragmatic approach used by previous authors (e.g., Sun et al. 2013; Beifiori et al. 2012; Kormendy et al. 2011) and implicitly assumed that all circular velocities are those of the dark matter halo.
Using this assumption, we found that the correlation between the masses of the supermassive blackholes and the circular velocities is very weak. By extrapolation, we conclude that the correlation between the blackholes and the dark matter halo is also weak in the present-day Universe. Volonteri et al. (2011) argued the these two components of galaxies could have been more correlated in the past. Blackholes and dark matter halos are bound to be correlated somehow. The deep potential wells of massive dark matter halos are needed for the material to accumulated in the center and form a blackhole. The existence of bulgeless spiral galaxies with supermassive blackholes presents a challenge to the no correlation. On the other hand, a correlation presisting to the present would imply the existence of very massive blackholes in the cores of dark matter halos of galaxy clusters (Kormendy et al. 2011).
References
- (1) Atkinson, J. W., et al. 2005, MNRAS, 359, 504
- (2) Baes, M., Buyle, P., Hau, G. K. T., & Dejonghe, H. 2003, MNRAS, 341, L44
- (3) Bandara, K., Crampton, D., & Simard, L. 2009, ApJ, 704, 1135
- (4) Barth, A., et al. 2001, ApJ, 555, 685
- (5) Bedregal, A. G., Salamanca-Aragon, A., & Merrifield, M. R. 2006, MNRAS, 373, 1125
- (6) Beifiori, A., et al. 2009, ApJ, 692, 856
- (7) Beifiori, A., et al. 2012, MNRAS, 419, 2497
- (8) Bender, R., et al. 2005, ApJ, 631, 280
- (9) Bernardi, F. et al. 2002, AJ, 123, 2990
- (10) Bower, G. A., et al. 2001, ApJ, 550, 75
- (11) Bullock, J. S., et al. 2001, MNRAS, 321, 559
- (12) Capetti, A, et al. 2005, A&A, 431, 465
- (13) Cappellari, M., et al. 2002, ApJ, 578, 787
- (14) Cappellari, M., et al. 2007, arxiv:0709.2861v1
- (15) Copin, Y., Cretton, N., & Emsellem, E. 2004, A&A, 415, 889
- (16) Courteau, S., McDonald, M., Widrow, L. M., & Holtzman, J. 2007, ApJ, 655, L21
- (17) Cretton, N., & van den Bosch, F. C. 1999, ApJ, 414, 704
- (18) Dalla Bonta, E., et al. 2009, ApJ, 690, 537
- (19) Davis, T. A., et al. 2013, MNRAS, 429, 534
- (20) Davies, R. L., et al. 2006, ApJ, 646, 754
- (21) de Francesco, G., Capetti, A., & Marconi, A. 2006, A&A, 460, 439
- (22) de Francesco, G., & Capetti, A. 2008, A&A, 479, 355
- (23) Devereux, N., et al. 2003, AJ, 125, 1226
- (24) Di Matteo, T., Croft, R. A. C., Springel, V., & Hernquist, L. 2003, ApJ, 593, 69
- (25) Di Matteo, T., et al. 2008, ApJ, 676, 33
- (26) Ferrarese, L., Ford, H. C., & Jaffe, W. 1998, IAUS, 184, 445
- (27) Ferrarese, L., & Ford, H. C. 1999, ApJ, 515, 583
- (28) Ferrarese, L., & Merritt, D. 2000, ApJ, 539, L9
- (29) Ferrarese, L. 2002, ApJ, 578 , 90
- (30) Ferrarese, L., & Ford, H. C. 2005, SSRv, 116, 523
- (31) Garcia-Rissman, A., et al. 2005, MNRAS, 359, 765
- (32) Gebhardt, K., et al. 2000, ApJ, 539, L13
- (33) Gebhardt, K., et al. 2001, AJ, 122, 2469
- (34) Gebhardt, K., et al. 2003, ApJ, 583, 92
- (35) Ghez, A. M., et al. 2008, ApJ, 689, 1044
- (36) Gould, A. 2013, arXiv1303.0834G
- (37) Graham, A., et al. 2001, ApJ, 563, 11
- (38) Graham, A., & Driver, S. 2007, ApJ, 655, 77
- (39) Graham, A. 2008, PASA, 25, 167
- (40) Greene, J. E., & Ho, L. C. 2005, ApJ, 630, 122
- (41) Greenhill, L. J. 2003, ApJ, 590, L62
- (42) Greenhill, L. J., Moran, J. M., & Herrnstein, J. R. 1997, ApJ, 481, 23
- (43) Gultekin, et al. 2009a, ApJ, 698, 198
- (44) Gultekin, et al. 2009b, ApJ, 695, 1577
- (45) Haehnelt, M., & Kauffmann, G. 2000, MNRAS, 318, L35
- (46) Harms, R. J., et al. 1994, ApJ, 435, 35
- (47) Hernstein, J. R., et al. 1999, Nature, 400, 539
- (48) Hicks, E. K. S., & Malkan, M. S. 2008, ApJS, 174, 31
- (49) Ho, L. C. 2007, ApJ, 668, 94
- (50) Ho, L. C., Darling, J., & Greene, J. E. 2008, ApJ, 681, 128
- (51) Hopkins, P. F., et al. 2007, ApJ, 669, 5
- (52) Houghton, R. C. W., et al. 2006, MNRAS, 367, 2
- (53) Hu, J. 2008, MNRAS, 386, 2242
- (54) Hu, J. 2009, arxiv:0908.2028v1
- (55) Kaspi, S. et al. 2000, ApJ, 533, 631
- (56) Kauffmann, G. & Haehnelt, M. 2000, MNRAS, 311, 567
- (57) Kondratko, P. T., Greenhill, L. J., & Moran, J. M. 2008, ApJ, 678, 87
- (58) Kormendy, J. 1988, ApJ, 335, 40
- (59) Kormendy, J., et al. 1996, AAS, 28, 1423
- (60) Kormendy, J., & Bender, R. 2011, Nature, 469, 377
- (61) Krajnovic, D., et al. 2009, MNRAS, 399, 1839
- (62) Kronawitter, A., Saglia, R. P., Gerhard, O., & Bender, R. 2000, A&AS, 144, 53
- (63) Kuo, C. Y., et al. 2011, ApJ, 727, 20
- (64) Lodato, G., & Bertin, G. et al. 2003, A&A, 408, 1015
- (65) Maciejewski, W., & Binney, J. 2001, MNRAS, 323, 831
- (66) Macchetto, F., et al. 1997, ApJ, 489, 579
- (67) Markwardt, C. B. 2009, ASPC, 411, 251
- (68) McConnell, N. J., et al. 2011, ApJ, 756, 179
- (69) McConnell, N. J., & Ma, C. 2013, ApJ, 764, 184
- (70) Merritt, D., & Ferrarese, L. 2001, ApJ, 547, 140
- (71) Nelson, C. H., et al. 2004, ApJ, 615, 652
- (72) Neistein, E., et al. 1999, AJ, 117, 2666
- (73) Neumayer, N., et al. 2007, ApJ, 671. 1329
- (74) Nowak, N. 2007, MNRAS, 379, 909
- (75) Nowak, N. 2008, MNRAS, 391, 1629
- (76) Onken, C. A., et al. 2004, ApJ, 615, 645
- (77) Onken, C. A., et al. 2007, ApJ, 670, 1050
- (78) Palunas, P., & Williams, T. B. 2000, AJ, 120, 2884
- (79) Pastorini, G., et al. 2007, A&A, 469, 405
- (80) Paturel, G., et al. 2003, A&A, 412, 57
- (81) Peterson, B. M., et al. 2004, ApJ, 613, 682
- (82) Pizzella, A., et al. 2005, ApJ, 631, 785
- (83) Press, W. H., et al. 1992, Numerical Recipes in FORTRAN: The Art of Scientific Computing 2nd ed.; Cambridge: Cambridge University Press
- (84) Prugniel, P., Maubon, G., & Simien, F. 2001, A&A, 366, 68
- (85) Richstone, D., et al. 1998, Nature, 395, 1
- (86) Richstone, D., et al. 2004, arxiv:astro-ph/0403257v1
- (87) Rusli, S. P., et al. 2013, MNRAS, 410, 1223
- (88) Sabra, B. M., et al. 2008, IAUS, 245, 257
- (89) Sarzi, M., et al. 2001, ApJ, 550, 65
- (90) Shapiro, K. L., et al. 2006, MNRAS, 370, 559
- (91) Tadhunter, C., et al. 2003, MNRAS, 342, 861
- (92) Tilak, A., et al. 2008, ApJ, 678, 701
- (93) Tremaine, S., et al. 2002, ApJ, 574, 740
- (94) Williams, M. J., et al. 2010, MNRAS, 409, 1330
- (95) Wold, M., et al. 2006, A&A, 460, 449
- (96) Valluri, M., Merritt, D., & Emsellem, E., 2004, ApJ, 602, 66
- (97) van den Bosch, R. C. E., et al. 2012, Nature, 491, 729
- (98) van der Marel, R. P., & van den Bosch, F. C. 1998, AJ, 116, 2220
- (99) Verheijen, M. A. W., & Sancisi, R., 2001, A&A, 370, 765
- (100) Verolme, E. K., et al. 2002, MNRAS, 335, 517
- (101) Volonteri, M., Natarjan, P., & Gultekin, K. 2011, ApJ, 737, 50
- (102) Yamauchi, A., et al. 2004, PASJ, 56, 605
- (103) Zasov, A. V., Petrochenko, L. N., & Cherepshchuk, A. M. 2005, ARep, 49, 362


| Galaxy | MORPH | D (Mpc) | A | Rf() | |||
|---|---|---|---|---|---|---|---|
| (1) | (2) | (3) | (4) | (5) | (6) | (7) | (8) |
| Circinus | SB | 2.8 | Y | 1-m | |||
| IC 1459 | E3 | 29.2 | Y | 2-s | |||
| IC 2560 | SBb,p | 41.4 | Y | 3-m | |||
| MW | SBbc | 0.008 | Y | 4-p | |||
| NGC 0224 | Sb | 0.76 | Y | 5-s | |||
| NGC 1023 | SB0 | 11.4 | N | 6-s | |||
| NGC 1068 | Sb | 15.3 | Y | 7-m | |||
| NGC 1194 | S0 | 55.5 | Y | 47-m | |||
| NGC 1300 | SBbc | 20.7 | N | 8-g | |||
| NGC 1332 | S0 | 22.7 | N | 49-s | |||
| NGC 1399 | E | 21.1 | N | 9-s | |||
| NGC 2273 | SBa | 26.8 | Y | 47-m | |||
| NGC 2748 | Sc | 24.9 | N | 8-g | |||
| NGC 2787 | SB0/a | 7.5 | Y | 10-g | |||
| NGC 2960 | Sa | 75.3 | Y | 47-m | |||
| NGC 2974 | E4 | 21.5 | Y | 11-s | |||
| NGC 3031 | Sb | 3.9 | Y | 12-g | |||
| NGC 3079 | SB(s)c | 19.1 | Y | 13-m | |||
| NGC 3115 | S0 | 9.7 | N | 14-s | |||
| NGC 3227 | SBa | 17.5 | Y | 15-g,s | |||
| NGC 3245 | S0 | 20.9 | N | 40-g | |||
| NGC 3379 | E1 | 10.3 | N | 16-g,s | |||
| NGC 3384 | S0 | 11.6 | N | 17-s | |||
| NGC 3393 | Sba,p | 51.8 | Y | 18-m | |||
| NGC 3414 | SB0 | 25.2 | N | 11-s | |||
| NGC 3585 | S0 | 21.2 | N | 30-s | |||
| NGC 3608 | E2 | 22.9 | N | 17-s | |||
| NGC 3998 | S0 | 18.3 | Y | 19-g | |||
| NGC 4026 | S0 | 15.6 | N | 30-s | |||
| NGC 4151 | SAB | 13.9 | Y | 20-g,s | |||
| NGC 4258 | SABbc | 7.2 | Y | 21-m | |||
| NGC 4303 | SBbc | 16.1 | Y | 22-g | |||
| NGC 4342 | S0 | 17 | N | 42-s | |||
| NGC 4374 | E | 18.4 | Y | 23-g | |||
| NGC 4388 | SB | 19.8 | Y | 47-m | |||
| NGC 4486 | E | 17.2 | Y | 24-g | |||
| NGC 4486B | E | 15.3 | N | 25-s | |||
| NGC 4526 | S0 | 16.5 | N | 50-g | |||
| NGC 4564 | E3 | 15.9 | N | 17-s | |||
| NGC 4594 | Sa | 9.8 | Y | 26-s | |||
| NGC 4596 | SB0 | 16.7 | N | 10-g | |||
| NGC 4649 | E1 | 17.3 | N | 17-s | |||
| NGC 4736 | Sab | 4.9 | Y | 52-s | |||
| NGC 4826 | Sab | 6.4 | Y | 52-s | |||
| NGC 4945 | SB | 3.8 | Y | 27-m | |||
| NGC 5128 | S0 | 3.5 | Y | 28-g | |||
| NGC 5252 | S0 | 96.8 | Y | 29-g | |||
| NGC 5576 | E3 | 27.1 | N | 30-s | |||
| NGC 5846 | E0 | 24.9 | N | 11-s |
Table 1 (Cont’d): Galaxy Sample
Galaxy
Morph
D (Mpc)
A
Rf()
(1)
(2)
(3)
(4)
(5)
(6)
(7)
(8)
NGC 7052
E4
71.4
N
31-g
NGC 7457
S0
13.2
N
17-s
NGC 7582
SBab
22
Y
32-g
UGC 3789
Sa
48.4
N
47-m
Galaxies with no
A1836
E
157.5
N
34-g
A3565
E
54.4
N
34-g
Cygnus A
E
240
Y
33-g
IC 4296
cD
50.8
Y
34-s,g
NGC 0221
E2
0.81
N
35-s
NGC 0524
S0,c
23.3
N
36-s
NGC 0821
E4
24.1
N
37-s
NGC 1277
S0
73
N
48-s
NGC 1316
SAB
20
N
38-s
NGC 1407
E
29
N
49-s
NGC 1550
E
53
N
49-s
NGC 2549
S0
12.3
N
36-s
NGC 2778
E2
22.9
N
17-s
NGC 3091
E
52.7
N
49-s
NGC 3377
E5
11.2
N
39-s
NGC 3607
SA
19.9
Y
30-s
NGC 4261
E2
31.6
Y
41-g
NGC 4291
E2
26.2
N
17-s
NGC 4459
S0
16.1
N
10-g
NGC 4473
E5
15.3
N
17-s
NGC 4486A
E2
18.3
N
43-s
NGC 4552
E
15.9
Y
11-s
NGC 4621
E5
18.3
N
11-s
NGC 4697
E4
11.7
N
17-s
NGC 4742
E4
15.5
N
44-s
NGC 4751
E/S0
27.7
N
49-s
NGC 5077
E3,c
40.2
Y
45-g
NGC 5328
E
65.9
N
49-s
NGC 5516
E
60.1
N
49-s
NGC 5813
E1
32.2
N
11-s
NGC 5845
E3
25.9
N
17-s
NGC 6086
E
139.1
N
51-s
NGC 6251
E2
107
Y
46-g
NGC 6264
S
145.4
Y
47-m
NGC 6323
Sab
110.5
N
47-m
NGC 6861
E/S0
28.9
N
49-s
NOTES. Col. (2): Morphological classification (NASA/IPAC Extragalactic Database. Col. (3): Distances (see
col. (5) for references). Col. (4): Active Galaxy. Col. (5): Blackhole masses from Hu (2009) McConnell & Ma (2013)
except for NGC 1300, NGC 2778; NGC 4342; NGC 4374; and NGC 4945 (Graham 2008), NGC 4303 (Pastorini 2007),
NGC 4486 Kormendy et al. (1996), and NGC 4594 (Kormendy et al. 1988). (8). Col. (6): Galaxy circular
velocity (see text for references). Col. (7): Central velocity dispersion from HyperLeda. Col. (8):
Original references for blackholes masses. Methods for derivation of blackhole masses in original
references: g=gas dynamics; s=star dynamics; p=stellar proper motion; m=maser. Original references
for blackhole masses: (1) Greenhill et al. (2003); (2) Cappellari et al. (2002); (3) Tilak et al. (2008);
(4) Ghez et al. (2008);
(5) Bender et al. (2005); (6) Bower et al. (2001); (7) Lodato et al. (2003); (8) Atkinson et al. (2005); (9) Houghton et al. (2006); (10) Sarzi et al. (2001); (11) Cappellari et al. (2007); (12) Devereux et al. (2003); (13) Yamauchi et al. (2004); (14) Kormendy et al. (1996); (15) Davis et al. (2006) and Hicks et al. (2008); (16) Gebhardt et al. (2001) and Shapiro et al. (2006); (17) Gebhardt et al. (2003); (18) Kondratko et al. (2008); (19) de Francesco et al. (2006); (20) Onken et al. (2007) and Hicks et al. (2008); (21) Hernstein et al. (1999); (22) Pastorini (2007); (23) Maciejewski et al. (2001); (24) Harms et al. (1994) and Macchetto et al. (1997); (25) Kormendy et al. (1996); (26) Kormendy et al. (1988); (27) Greenhill et al. (1997); (28) Neumayer et al. (2007); (29) Capetti et al (2005); (30) Gultekin et al. (2009b); (31) van der Marel (1998); (32) Wold et al. (2006); (33) Tadhunter et al. (2003); (34) Dalla Bonta et al. (2009);(35) Verolme et al. (2002); (36) Krajnovic et al. (2009); (37) Richstone et al. (2004); (38) Nowak et al. (2008); (39) Copin et al. (2004); (40) Barth et al. (2001); (41) Ferrarese et el. (1998); (43) Nowak et al. (2007); (42) Cretton et al. (1999) and Valluri et al. (2004); (44) Tremaine et al. (2002); (45) de Fransesco et al (2008); (46) Ferrarese et al. (1999); (47) Kuo et al (2011); (48) van den Bosch (2012); (49) Rusli et al. (2011); (50) Davies et al. (2013) and Gould (2013); (51) McConnell et al. (2011). (52) Kormendy & Bender (2011).