Evidence for jet launching close to the black hole in GRB 101219B - a Fermi GRB dominated by thermal emission
Abstract
We present observations by the Fermi Gamma-Ray Space Telescope Gamma-Ray Burst Monitor (GBM) of the nearby () GRB 101219B. This burst is a long GRB, with an associated supernova and with a blackbody (BB) component detected in the early afterglow observed by the Swift X-ray Telescope (XRT). Here we show that the prompt gamma-ray emission has a BB spectrum, making this the second such burst observed by Fermi GBM. The properties of the BB, together with the redshift and our estimate of the radiative efficiency, makes it possible to calculate the absolute values of the properties of the outflow. We obtain an initial Lorentz factor , a photospheric radius cm and a launch radius cm. The latter value is close to the black hole and suggests that the jet has a relatively unobstructed path through the star. There is no smooth connection between the BB components seen by GBM and XRT, ruling out the scenario that the late emission is due to high-latitude effects. In the interpretation that the XRT BB is prompt emission due to late central engine activity, the jet either has to be very wide or have a clumpy structure where the emission originates from a small patch. Other explanations for this component, such as emission from a cocoon surrounding the jet, are also possible.
1 INTRODUCTION
Insight into the physical properties of jets in gamma-ray bursts (GRBs) is dependent on identifying the emission mechanism responsible for the prompt gamma-ray emission. This is an unsolved problem, where no theoretical model has yet managed to explain the full range of observed parameters for the smoothly broken power-law shape of the spectra. In particular, it is well known that synchrotron emission cannot explain the hard low-energy slopes of many bursts (Crider et al., 1997; Preece et al., 1998), while the majority of GRB spectra are significantly wider than expected for the simplest cases of thermal emission from the jet photosphere. From observations with Fermi there is growing evidence that emission from the jet photosphere is important in at least some bursts, although it is usually seen to co-exist with a dominant non-thermal component (Ryde et al., 2010; Guiriec et al., 2011; Axelsson et al., 2012; Guiriec et al., 2013; Burgess et al., 2014b).
Due to the difficulties in discriminating between different emission models, observations of GRB spectra which are close to pure Planck functions are very important. There have previously been a few GRBs with such spectra observed by BATSE (Ryde, 2004) as well as one observed by Fermi GBM (Ghirlanda et al., 2013). For these bursts, however, the redshifts and radiative efficiencies are unknown, leading to uncertainties in the absolute values of outflow parameters derived from the spectral fits. Here we present observations of GRB 101219B, the first GRB with a spectrum that is well described by a Planck function that also has a detected afterglow and a known redshift.
The prompt emission of GRB 101219B was observed by both Swift Burst Alert Telescope (BAT) and Fermi GBM (Cummings et al., 2010; van der Horst, 2010), and the afterglow was detected from X-rays to optical energies by several observatories (Gelbord et al., 2010; Olivares et al., 2010; de Ugarte Postigo et al., 2011). The optical signature of an accompanying Supernova (SN) was also detected (de Ugarte Postigo et al., 2011; Olivares et al., 2011) and the redshift was determined to be 0.55. An analysis of the SN spectrum by Sparre et al. (2011) showed it to be a broad-line type Ic, with properties similar to SN 1998bw, the archetypal GRB-SN (Galama et al., 1998). In addition, the Swift XRT spectra of the early afterglow revealed the presence of a highly significant BB component (Starling et al., 2012). Such a component has also been found in a small number of other GRBs and the origin has been attributed variously to the SN shock breakout, emission from the cocoon surrounding the jet, or late emission from the jet itself (Starling et al., 2012; Sparre & Starling, 2012; Friis & Watson, 2013).
This paper is organized as follows: we present the spectral analysis of the gamma-ray observations in section 2.1, estimate the radiative efficiency from the Swift XRT observations in section 2.2 and derive the outflow parameters in section 2.3. We discuss our results in section 3. Throughout this paper we assume a flat Universe with and . Error bars correspond to 1 sigma unless otherwise stated.
2 OBSERVATIONS AND ANALYSIS
2.1 Gamma-ray spectral analysis
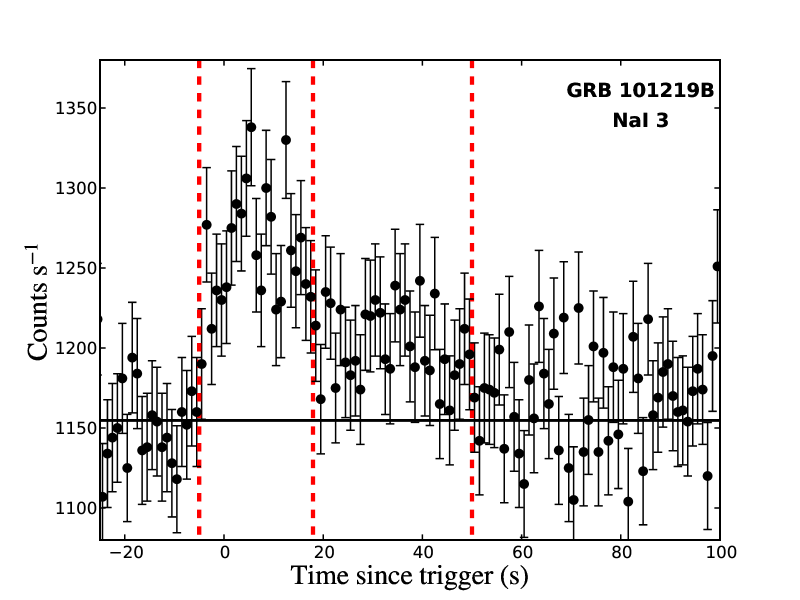
In the analysis of the prompt phase of GRB 101219B we focus on the data from GBM (Meegan et al., 2009), which has a stronger signal as well as a wider energy range than the BAT. We do check the BAT data for consistency though. GRB 101219B is a relatively weak burst with a fluence of in the keV energy band and duration s (von Kienlin et al. 2014). The light curve of the NaI detectors ( keV) is dominated by a single peak, as shown in Fig. 1.
For the spectral analysis we use the NaI 3, 6 and 7 detectors, which all have angles with respect to the burst of . There is no signal in the BGO detectors (200 keV - 40 MeV) or in the Large Area Telescope (LAT, 30 MeV - 300 GeV). The fits were performed using XSPEC v12.8.1 and pgstat statistics. To select time intervals for the spectral analysis we binned the light curve using the Bayesian Blocks technique (as implemented in astroML, VanderPlas et al. 2014), which resulted in two time intervals, shown in Fig. 1.
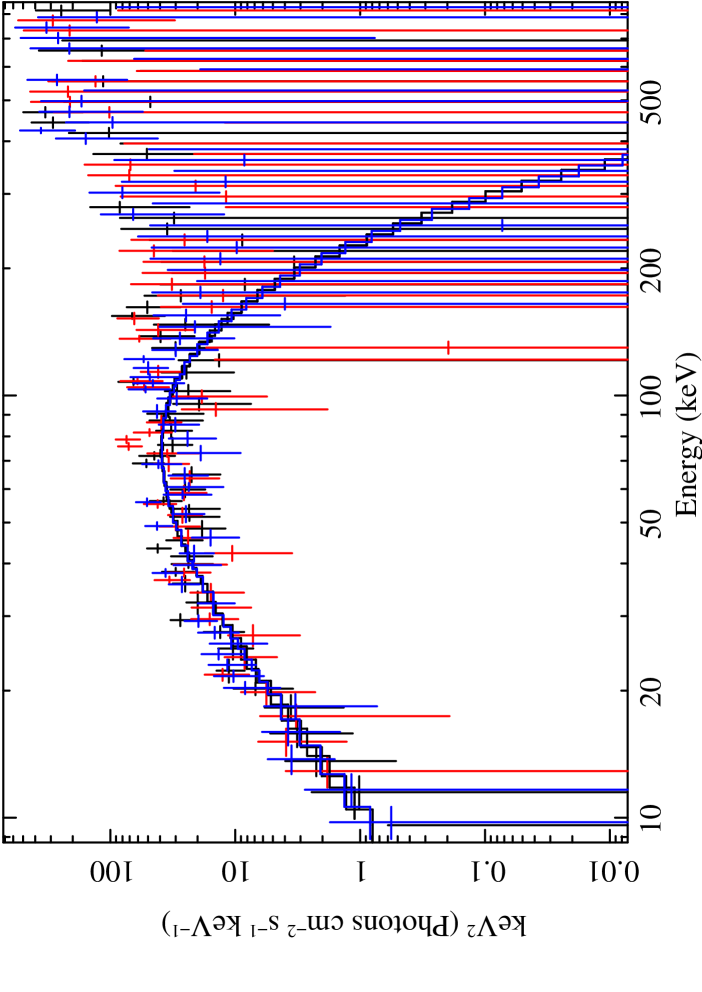
GRBs are typically well described by the so-called Band function (Band et al., 1993), which is a smoothly broken power law characterized by a peak energy () and power-law indices and below and above the peak, respectively. The results from fitting GRB 101219B with a Band function are listed in Table 1. The fits show that is very hard, and in the first and second interval, respectively, and close to the Rayleigh-Jeans value of 1. For comparison, the median value of for long GRBs in the GBM catalog is (Gruber et al., 2014) and synchrotron emission in the slow-cooling regime has (Preece et al. 1998, see also Burgess et al. 2014a). In addition, this burst also has an unusually low ( keV in the first time interval), which is at the lowest 10th percentile of constrained for GBM bursts (Gruber et al., 2014), and even more exceptional when considering the low redshift. Motivated by these unusual spectral properties we attempt to fit the data with a BB model, which we find provides a good fit to the spectra. The fit to the first time interval is shown in Fig. 2 and the best-fit parameters are presented in Table 1. The temperature of the BB is seen to decrease between the two time intervals.
In order to test the hypothesis that the spectrum of this burst, which has rather poor signal-to-noise, could still be consistent with slow-cooling synchrotron emission we use XSPEC to simulate spectra with and and taken from the fit to the first interval. The simulations are based on the background spectrum, response files and exposure time of the real data, and uses Poisson statistics to create synthetic spectra. Fitting these spectra with a Band function gives best-fit values of in only six cases, corresponding to a probability of of obtaining such a hard value of by chance. The hypothesis that can thus be rejected with very high confidence.
Even for the case when the prompt emission is completely dominated by the jet photosphere the observed spectrum is not expected to be a pure Planck function. Geometric effects are expected to broaden the spectrum, with the hardest values of being obtained in the case of a wide jet viewed along the line of sight (Pe’er, 2008; Beloborodov, 2011; Lundman et al., 2013; Deng & Zhang, 2014). In addition, we expect some broadening due to time-evolution of the spectrum during the s time intervals from which the spectra were extracted (it is not possible to obtain good constraints on spectral parameters on a shorter time scale for this burst). A comparison of the Band and BB fits can be used to constrain the amount of broadening in GRB 101219B. While is close to the value expected for a pure BB, is harder than the exponential cutoff of a BB. In line with this, a fit with a cutoff power-law model over-predicts the data at low energies as it needs to compensate for the somewhat harder high-energy slope. The flux derived from the BB fit to the first time interval is approximately of the flux derived from the Band fit, which places an upper limit on the amount of broadening. As already mentioned, some of this will be accounted for by geometric effects and temporal evolution, but a small contribution from non-thermal emission, such as Comptonization of the BB, is also possible.
For consistency we also analyzed the Swift BAT data of the burst. Spectra were created using standard BAT software (HEASOFT 6.15 and BATGRBPRODUCT). The results of the joint spectral fits are fully consistent with those presented above. We note, however, that the BAT spectra on their own are adequately fit with a simple power law ( in the first time interval). This is due to the combination of a weak signal and the limited band pass ( keV), which means that the power law simply provides an average of the spectrum covering the spectral peak.
2.2 Radiative efficiency and jet opening angle
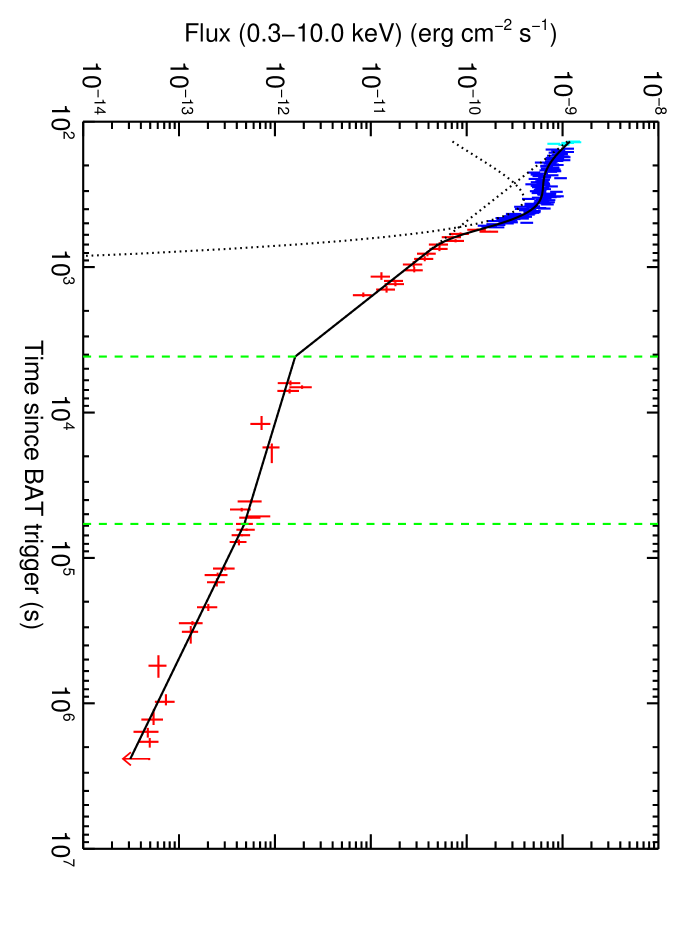
The radiative efficiency is defined as , where is the isotropic energy emitted in gamma rays and is the kinetic energy of the jet. A measurement of is needed in order to calculate the absolute values of fireball parameters from the BB properties (see section 2.3). The value of can be derived from X-ray afterglow observations, as described by Zhang et al. (2007). We obtained the X-ray afterglow light curve and spectra for GRB 101219B from the Swift XRT repository (Evans et al., 2009). Fitting the count rate light curve using the method of Racusin et al. (2009) yields three power-law segments with temporal decay indices of , , with two breaks at ks and ks. These segments can be identified as late prompt emission, a shallow phase with continuous energy injection and the normal decay due to the decelerating fireball. No jet break is detected. A flare around 300-600 s was modeled by a Gaussian. The light curve and the fit are shown in Fig. 3.
We estimate from the normal decay phase, assuming typical values for the fraction of energy in electrons and magnetic fields ( and ) and neglecting Inverse Compton emission. We first determined the intrinsic column density, , by fitting the full spectrum during the normal decay (i.e. after 58 ks) with a power law modified by intrinsic and Galactic absorption (with the Galactic absorption fixed at ). This yields , consistent with the results of Starling et al. (2012). We then fit the model with fixed at this value to the spectrum at 58 ks and use the fit results together with equation (5) in Racusin et al. (2011) to derive . Assuming slow-cooling synchrotron emission with an electron spectral index , the observed spectrum is consistent with being above the synchrotron cooling frequency. We obtain a value of ergs. With ergs (over keV in the rest frame of the burst) this corresponds to a relatively low efficiency of .
This value of is associated with systematic uncertainties from our assumptions, in particular regarding the values of and . Although the values of reported in the literature span many orders of magnitude, we note that our estimate of is only weakly dependent on this parameter. As an example, assuming a much lower value of (the median value found by Santana et al. 2014 for and a constant density medium) gives , i.e. only slightly lower than our estimate above. The dependence on is stronger, but measurements of this parameter have a rather narrow distribution, with of GRBs falling in the range (Santana et al., 2014), in line with theoretical simulations (Sironi & Spitkovsky, 2011). Increasing our value of to 0.3 at the high end of this distribution gives , which gives an estimate of the uncertainty from this parameter.
A limit on a jet break can be obtained from the last time when such a break could be present without being detectable (see Racusin et al. 2009). For GRB 101219B this time is days. Assuming an ambient number density of and and from above, this corresponds to a limit on the jet opening angle of and a collimation corrected energy ergs.
2.3 Fireball parameters
The observed temperature and flux of the BB, together with and , can be used to calculate the properties of the outflow in the standard fireball scenario. Following Pe’er et al. (2007) we calculate the Lorentz factor (), the radius where the fireball starts accelerating (), the saturation radius (, where the acceleration stops) and the radius of the photosphere (). In the calculations we assume that there is no dissipation below the photosphere and that is much larger than the inverse of the opening angle of the jet. The results for the two intervals are presented in Table 1.
The main source of uncertainty in these results is the radiative efficiency, as already discussed above. Another uncertainty is the contribution of non-thermal emission to the gamma-ray spectrum. A very conservative limit on this can be obtained by comparing the fluxes from the Band and BB fits, as described in section 2.1. Taking the difference of these fluxes to be non-thermal emission would reduce the values of and by about a factor of two, while at the same time increasing the values of and by about , as compared to the values presented in Table 1.
| Timea | Band | Band | Band | BB kTc | ||||
|---|---|---|---|---|---|---|---|---|
| (s) | (keV) | (keV) | (cm) | (cm) | ( cm) | |||
| -5–18 | ||||||||
| 18-50 |
Note. —
3 DISCUSSION
As noted in Section 1 there is growing evidence for photospheric emission in the prompt phase of GRBs, but very few examples where the spectra are close to pure BBs. It is clear that special conditions are required in order to obtain such spectra. First, a fairly wide jet viewed close to the line of sight is needed in order to avoid significant geometric broadening. This is in line with the limit on the jet opening angle from section 2.2. However, it is interesting to note that the low-energy slope of GRB 101219B is harder than predicted for a spherically symmetric wind (see section 2.1). A possible explanation for this is that the emission arises from a small patch within a clumpy jet, invalidating the assumption of a steady flow that is spherically symmetric inside . An additional requirement for having a narrow spectrum is the lack of significant dissipation of energy in the jet.
The outflow parameters in Table 1 provide important information about the jet. It is particularly interesting to relate the base of the jet to the size of the presumed compact remnant. In the first time interval cm, which corresponds to ten times the event horizon for a maximally spinning black hole (or a non-spinning one). This mass range is close to the expected values for the generally assumed massive progenitor star, and suggests that the jet is launched from close to the black hole and then has an unobstructed path through the star. The latter requires a highly asymmetric explosion, in line with the observationally and theoretically well-established view that SN explosions are asymmetric. The only other GRB for which absolute values of the outflow parameters have been calculated is the highly energetic GRB 090902B, where Pe’er et al. (2012) found cm, i.e. significantly larger than for GRB 101219B. That the conditions in this burst are different from GRB 101219B is also clear from the fact that the spectral shape is broader, most likely indicating subphotospheric dissipation.
3.1 Connection with the blackbody component in the early afterglow
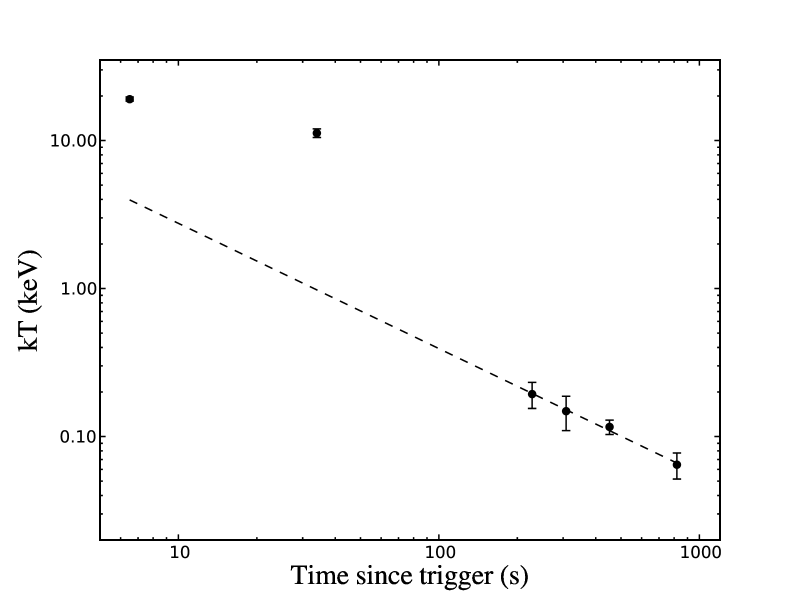
GRB 101219B belongs to a small group of bursts in which a highly significant BB component has been detected in Swift XRT data of the early afterglow (Starling et al., 2012). Specifically, Starling et al. (2012) fit four time intervals between and s after the GBM trigger (around the time of the flare in the light curve, see Fig. 3) using a model comprising a power law and a BB, modified by absorption (see their table 5 for the full fit results). The BB has an initial rest-frame temperature of keV and then decreases with time.
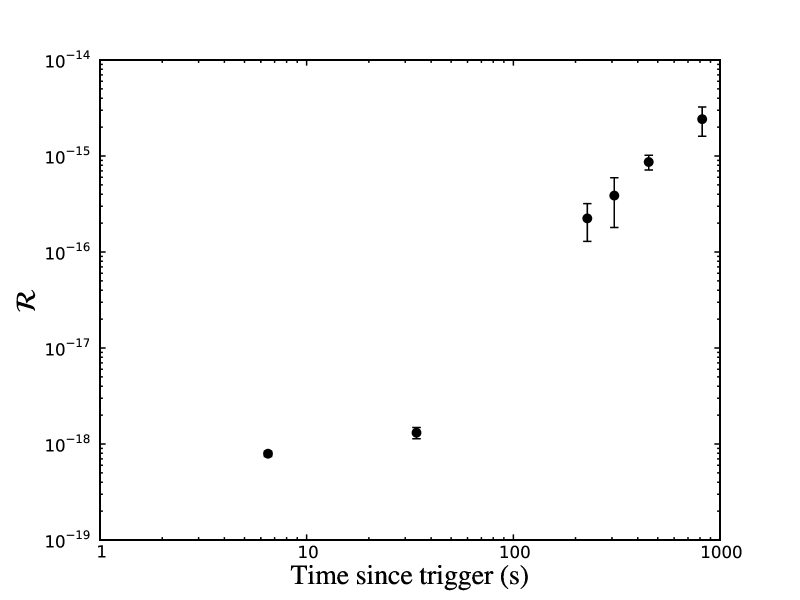
In order to investigate any possible connection between the BB in the prompt emission and the BB in the early afterglow we plot in Fig. 4 the evolution of the BB temperature as a function of time for the two datasets. The temporal evolution of the temperature in the Swift XRT data is well described by a power law (shown by the dashed line, with decay index ), but the extrapolation of this fit to early times is clearly inconsistent with the GBM data. A broken power-law model also fails to connect the two data sets. In Fig. 4 we also plot the parameter , which is related to the effective transverse size of the photosphere. This parameter is also seen to evolve differently during the two phases.
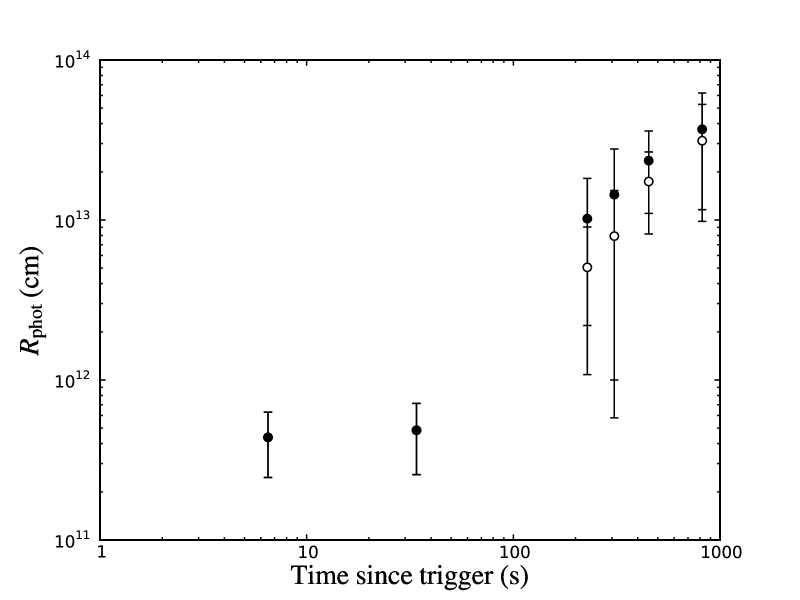
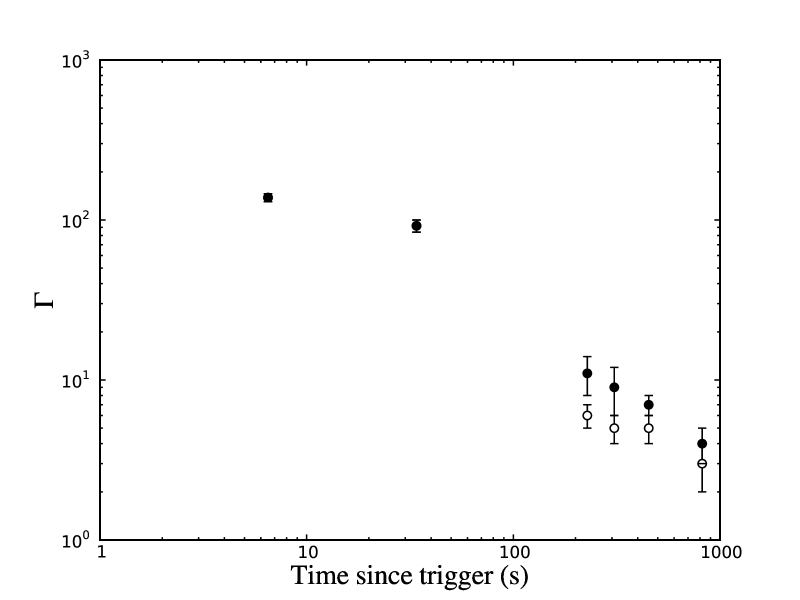
The lack of a smooth connection between the observed properties of the BB in the two data sets, together with the fact that the BB flux actually increases at late times (Starling et al., 2012), rules out the scenario that the late emission is due to high latitude emission from the jet after the central engine has died. We therefore explore the scenario that the late emission is due to late central engine activity, and calculate the outflow parameters from the low-energy BB as described in section 2.3. The resulting values of and are shown in Fig. 4 for two scenarios: (i) all the late emission is prompt emission and (ii) the BB is the prompt emission from the jet, while the power-law component arises in a different region where the jet has started interacting with the circumstellar medium. The two scenarios produce comparable results. We see that at late times the jet has a low in the range . In order for such a slow jet to still produce a narrow BB spectrum the jet has to be very wide (, consistent with the limit of from section 2.2) or, alternatively, the emission could originate from a small patch within a clumpy jet.
As already discussed by Starling et al. (2012), there are also other possibilities for the origin of the low-energy BB. In particular, they find that emission from a cocoon surrounding the jet can explain the main features of the emission, while shock breakout from a SN is disfavored from the large inferred radius ( cm, much larger than the cm expected from the presumed Wolf-Rayet progenitor). While breakout through a thick wind could accommodate the large radius in the SN scenario, the spectrum is in this case expected to be flat in (Svirski & Nakar, 2014), contrary to what is observed for GRB 101219B.
References
- Axelsson et al. (2012) Axelsson, M., Baldini, L., Barbiellini, G., et al. 2012, Astrophys. J., 757, L31
- Band et al. (1993) Band, D., Matteson, J., Ford, L., et al. 1993, Astrophys. J., 413, 281
- Beloborodov (2011) Beloborodov, A. M. 2011, Astrophys. J., 737, 68
- Burgess et al. (2014a) Burgess, J. M., Ryde, F., & Yu, H.-F. 2014a, ArXiv e-prints:1410.7647
- Burgess et al. (2014b) Burgess, J. M., Preece, R. D., Connaughton, V., et al. 2014b, Astrophys. J., 784, 17
- Crider et al. (1997) Crider, A., Liang, E. P., Smith, I. A., et al. 1997, Astrophys. J., 479, L39
- Cummings et al. (2010) Cummings, J. R., Barthelmy, S. D., Baumgartner, W. H., et al. 2010, GRB Coordinates Network, 11475, 1
- de Ugarte Postigo et al. (2011) de Ugarte Postigo, A., Goldoni, P., Milvang-Jensen, B., et al. 2011, GRB Coordinates Network, 11579, 1
- Deng & Zhang (2014) Deng, W., & Zhang, B. 2014, Astrophys. J., 785, 112
- Evans et al. (2009) Evans, P. A., Beardmore, A. P., Page, K. L., et al. 2009, Mon. Not. Roy. Astron. Soc., 397, 1177
- Friis & Watson (2013) Friis, M., & Watson, D. 2013, Astrophys. J., 771, 15
- Galama et al. (1998) Galama, T. J., Vreeswijk, P. M., van Paradijs, J., et al. 1998, Nature, 395, 670
- Gelbord et al. (2010) Gelbord, J. M., Barthelmy, S. D., Burrows, D. N., et al. 2010, GRB Coordinates Network, 11473, 1
- Ghirlanda et al. (2013) Ghirlanda, G., Pescalli, A., & Ghisellini, G. 2013, Mon. Not. Roy. Astron. Soc., 432, 3237
- Gruber et al. (2014) Gruber, D., Goldstein, A., Weller von Ahlefeld, V., et al. 2014, Astrophys. J. Supp., 211, 12
- Guiriec et al. (2011) Guiriec, S., Connaughton, V., Briggs, M. S., et al. 2011, Astrophys. J., 727, L33
- Guiriec et al. (2013) Guiriec, S., Daigne, F., Hascoët, R., et al. 2013, Astrophys. J., 770, 32
- Lundman et al. (2013) Lundman, C., Pe’er, A., & Ryde, F. 2013, Mon. Not. Roy. Astron. Soc., 428, 2430
- Meegan et al. (2009) Meegan, C., Lichti, G., Bhat, P. N., et al. 2009, Astrophys. J., 702, 791
- Olivares et al. (2010) Olivares, E. F., Rossi, A., & Greiner, J. 2010, GRB Coordinates Network, 11478, 1
- Olivares et al. (2011) Olivares, E. F., Schady, P., Kruehler, T., et al. 2011, GRB Coordinates Network, 11578, 1
- Pe’er (2008) Pe’er, A. 2008, Astrophys. J., 682, 463
- Pe’er et al. (2007) Pe’er, A., Ryde, F., Wijers, R. A. M. J., Mészáros, P., & Rees, M. J. 2007, Astrophys. J., 664, L1
- Pe’er et al. (2012) Pe’er, A., Zhang, B.-B., Ryde, F., et al. 2012, Mon. Not. Roy. Astron. Soc., 420, 468
- Preece et al. (1998) Preece, R. D., Briggs, M. S., Mallozzi, R. S., et al. 1998, Astrophys. J., 506, L23
- Racusin et al. (2009) Racusin, J. L., Liang, E. W., Burrows, D. N., et al. 2009, Astrophys. J., 698, 43
- Racusin et al. (2011) Racusin, J. L., Oates, S. R., Schady, P., et al. 2011, Astrophys. J., 738, 138
- Ryde (2004) Ryde, F. 2004, Astrophys. J., 614, 827
- Ryde et al. (2010) Ryde, F., Axelsson, M., Zhang, B. B., et al. 2010, Astrophys. J., 709, L172
- Santana et al. (2014) Santana, R., Barniol Duran, R., & Kumar, P. 2014, Astrophys. J., 785, 29
- Sironi & Spitkovsky (2011) Sironi, L., & Spitkovsky, A. 2011, Astrophys. J., 726, 75
- Sparre & Starling (2012) Sparre, M., & Starling, R. L. C. 2012, Mon. Not. Roy. Astron. Soc., 427, 2965
- Sparre et al. (2011) Sparre, M., Sollerman, J., Fynbo, J. P. U., et al. 2011, Astrophys. J., 735, L24
- Starling et al. (2012) Starling, R. L. C., Page, K. L., Pe’Er, A., Beardmore, A. P., & Osborne, J. P. 2012, Mon. Not. Roy. Astron. Soc., 427, 2950
- Svirski & Nakar (2014) Svirski, G., & Nakar, E. 2014, Astrophys. J., 788, 113
- van der Horst (2010) van der Horst, A. J. 2010, GRB Coordinates Network, 11477, 1
- VanderPlas et al. (2014) VanderPlas, J., Fouesneau, M., & Taylor, J. 2014, AstroML: Machine learning and data mining in astronomy, Astrophysics Source Code Library
- von Kienlin et al. (2014) von Kienlin, A., Meegan, C. A., Paciesas, W. S., et al. 2014, Astrophys. J. Supp., 211, 13
- Zhang et al. (2007) Zhang, B., Liang, E., Page, K. L., et al. 2007, Astrophys. J., 655, 989