Observationally-Motivated Analysis of Simulated Galaxies
Abstract:
The spatial and temporal relationships between stellar age, kinematics, and chemistry are a fundamental tool for uncovering the physics driving galaxy formation and evolution. Observationally, these trends are derived using carefully selected samples isolated via the application of appropriate magnitude, colour, and gravity selection functions of individual stars; conversely, the analysis of chemodynamical simulations of galaxies has traditionally been restricted to the age, metallicity, and kinematics of ‘composite’ stellar particles comprised of open cluster-mass simple stellar populations. As we enter the Gaia era, it is crucial that this approach changes, with simulations confronting data in a manner which better mimics the methodology employed by observers. Here, we use the SynCMD synthetic stellar populations tool to analyse the metallicity distribution function of a Milky Way-like simulated galaxy, employing an apparent magnitude plus gravity selection function similar to that employed by the RAdial Velocity Experiment (RAVE); we compare such an observationally-motivated approach with that traditionally adopted - i.e., spatial cuts alone - in order to illustrate the point that how one analyses a simulation can be, in some cases, just as important as the underlying sub-grid physics employed.
1 Introduction
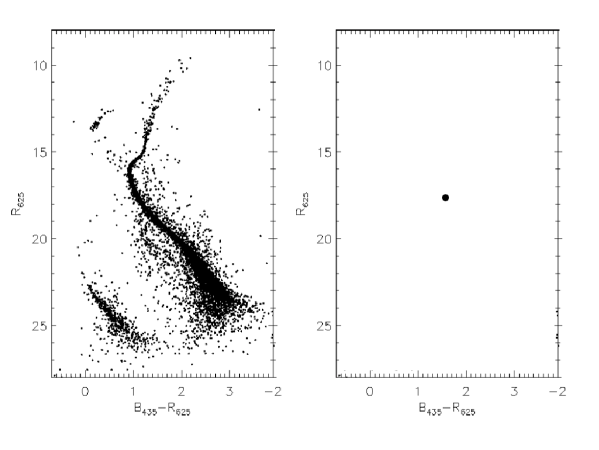
An inherent assumption underpinning the analysis of galaxy simulations is that they provide an analogous framework to that of galaxies in nature, in the sense that the chemo-kinetics of the massive stellar-like particles in simulations can be compared directly with the individual stars in observational samples. Considering that the typical mass of the ‘composite’ stellar particles in cosmological, hydrodynamical, simulations of Milky Way-like galaxies is of order 10 M⊙, rather than the 100±1 M⊙ encountered in nature, it is not unreasonable to question the importance of this mismatch in ‘resolution’; graphically, this ‘mismatch’ can perhaps best be appreciated by referring to Fig 1. Further, observers construct samples of stars based upon their respective and individual colour, apparent magnitude, chemistry, and gravity, while simulators are limited primarily to the integrated luminosities and chemistry of the coeval, open cluster-scale, simple stellar populations used to represent the ‘composite’ stellar particles.
In what follows, we present a pilot study for our long-term programme aimed at developing powerful, and flexible, tools for better transforming simulations into the observer’s plane. Here, we employ the synthetic colour-magnitude diagram package SynCMD [5] to replace composite stellar particles with individual stars in a self-consistent fashion, thereby allowing stellar samples to be drawn by an observer situated within a simulation using apparent magnitude and gravity criteria. The impact of this observationally-motivated selection function upon the inferred metallicity distribution of an analogous ‘solar neighbourhood’, compared with the traditional approach (i.e., selecting composite stellar particles spatially), will be assessed, and our future directions outlined.
2 Methodology
The characteristics of the L Milky Way-analogue analysed for this work (MaGICC-g1536) are detailed in [4]. The simulation was realised with the smoothed particle hydrodynamics code Gasoline [10], employing the MaGICC (Making Galaxies in a Cosmological Context) stellar feedback prescription [3]. To transform the simulation into the observer’s plane, we use the SynCMD (synthetic colour-magnitude diagram tool) developed by [5]. Using the age, metallicity, and initial mass function underpinning stars in simulations, SynCMD decomposes each particle into its individual constituent (or ‘synthetic’) stars (of order ‘synthetic’ stars per ‘composite’ stellar particle, corresponding to 10 individual stars for MaGICC-g1536), by mapping the composite particles onto the Padova isochrones ([1];[2]).
3 Results
For this pilot study, we situate the observer at an analogous ‘solar neighbourhood’, much as we did in [4]. From that vantage point, we ‘view’ the simulated galaxy, first isolating composite stellar particles within =10 kpc of the observer and which avoid the galactic plane (i.e., enforcing a galactic latitude restriction of 20 from the observer’s position). Such galactic plane restrictions mimic the typical constraint imposed upon ground-based, optically-selected, all-sky surveys, such as RAVE [8].
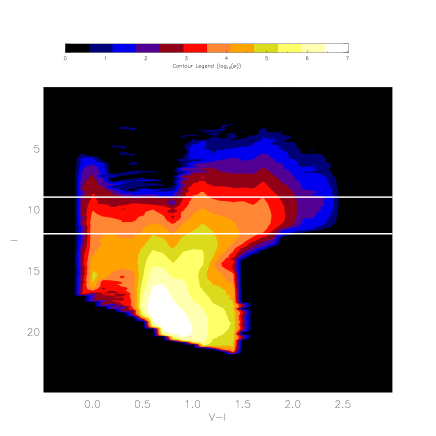
For each composite stellar particle passing the spatial cut, we employ SynCMD to distribute the underlying 10 individual ‘synthetic’ stars, in the appropriate numbers (weighted by the initial mass function), into each ‘bin’ of the associated colour-magnitude diagram (CMD). After taking into account the distance modulus of each such star, the relevant colour-apparent magnitude diagram, from the observer’s vantage point, results. The upper panel of Fig 2 shows the resulting (I,VI) CMD for the aforementioned stars passing the initial spatial cut; colour-coding here is by density of stars populating each CMD bin, as noted in the legend.
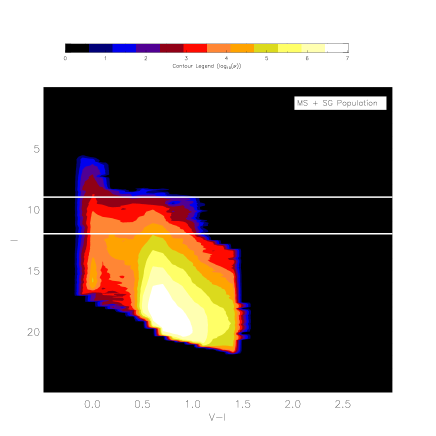
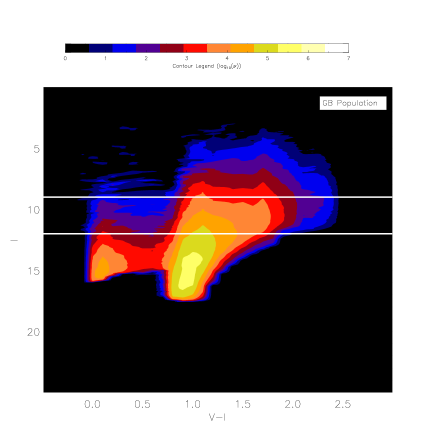
Having transformed our composite stellar particles into individual synthetic stars, each with colours, luminosities, and gravities drawn from the Padova isochrones, we are now in a position to apply observationally-motivated selection criteria to the simulation. For this pilot study, we employ criteria not dissimilar to that of RAVE [8]. We will show the results of three experiments: (i) including all stars with an I-band magnitude in the range 912, regardless of gravity, which is reflected in the white horizontal lines in the upper panel of Fig 2; (ii) including both the aforementioned I-band selection, and a surface gravity cut aimed at isolating main sequence and sub-giant branch (MS+SG) stars (3.5); and (iii) including both the aforementioned I-band selection, and a surface gravity cut aimed at isolating giant branch (GB) stars (3.5). The bottom left and right panels of Fig 2 correspond to the colour-apparent magnitude diagrams associated with (ii) and (iii), respectively.
To assess the impact of our observationally-motivated selection criteria in a quantitative sense, for this pilot study we examine the resulting metallicity distribution function (MDF) for each of the aforementioned SynCMD (i.e., ‘synthetic’) experiments (referred to as (i), (ii), and (iii) in the previous paragraph), and contrast those with the MDF inferred from using only the ‘composite’ stellar particles.
|
|
|---|---|
 |
 |
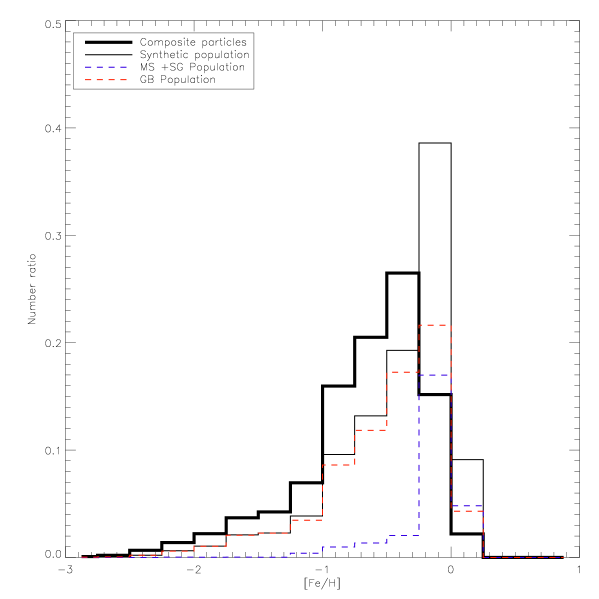
The resulting four MDFs are shown in Fig 3: the thick solid line corresponds to the sub-set of ‘composite’ stellar particles passing the initial spatial cut, while the thin solid line corresponds to the case in which also an I-band cut has been applied. One can immediately appreciate that the distributions, while similar globally, differ in detail; formally, the MDF inferred from the composite simulation particles is significantly less skewed, with significantly lower kurtosis, than the counterpart derived employing a RAVE-like I-band selection cut (skewness=1.2 vs 1.5; kurtosis=1.4 vs 2.5). The differences become even more obvious when further constraining the observational cuts beyond just apparent magnitude, to isolate main sequence plus sub-giant branch (MS+SG) stars (blue-dashed histogram in Fig 3) or giant branch (GB) stars (red-dashed histogram in Fig 3). In those cases, the skewness ranges from 2.2 (MS+SG) to 1.3 (GB), while the kurtosis ranges from 7.1 (MS+SG) to 1.7 (GB). Differences in the mean and variance also range from 0.1 to 0.2 dex, across the four experiments.
In and of themselves, these quoted moments of the MDFs might not be enlightening, but a comparison with the corresponding moments from the broad suite of simulations described by [6] proves interesting. In [6], five variants of the same simulated disk galaxy were presented, employing different initial mass functions, different treatments of radiation pressure from massive stars, different treatments of metal diffusion, and different treatments of the thermal cooling timescale. These five simulations were identical in every other consideration; as Table 2 in [6] shows, the resulting ranges in ‘solar neighbourhood’ MDF skewness and kurtosis vary from 0.9 to 1.8 (skewness), and 0.9 to 3.8 (kurtosis). In other words, the impact of simply how one observes a simulation (i.e., observationally-motivated, as we have done here, or simple spatial cuts, as has been done previously by essentially the entire field) can be as quantitatively important as any of the sub-grid physics treatments within the simulations themselves!
In some sense, the results shown here should not be shocking, and are already appreciated by the observational community. For example, for the bright apparent magnitude cut employed here, the main sequence and sub-giant branch stars all lie within 12 kpc of the simulation observer, while the intrinsically brighter giants probe much greater distances. Without an a posteriori matching volume-limited selection criterion for the two samples (MS+SG vs GB), the different effective distances of the samples mean that different metallicities and ages are encountered due to the interplay between the radial+vertical metallicity gradients and the spatially varying age-metallicity relations.
4 Summary
We have transformed a cosmological hydrodynamical simulation of an L Milky Way-like galaxy from the simulator’s space to the observer’s plane, making use of the synthetic colour-magnitude diagram tool. Having replaced 10 ‘composite’ stellar particles with 10 ‘synthetic’ stars, we have employed various spatial, apparent magnitude, and surface gravity cuts to the individual synthetic stars, and viewed the simulation much as an observer would do in nature. This pilot study was not meant to be exhaustive, but instead, to illustrate that under very common conditions, selecting stars based upon actual observable characteristics, rather than just using massive composite simulated stellar particles, can lead to inferred metallicity distributions which differ by as much as any of the various sub-grid physics treatments employed by simulators. While an enormous literature and community has evolved which is predicated upon understanding the subtleties of these sub-grid physics implementations, we have shown that it is equally as important to simply view the simulation ‘correctly’ as it is to get the sub-grid physics ‘right’. In the next phase of our work, we will also include the effect of foreground reddening, as well as explore the impact of magnitude-limited vs volume-limited sample selection upon not only the MDF, but also various chemistry-chemistry projections, the age-metallicity relation, and metallicity gradient determinations.
References
- [1] G. Bertelli, et al., A&A, 484, 815 (2008)
- [2] G. Bertelli, et al., A&A, 508, 355 (2009)
- [3] C. B. Brook, et al., MNRAS, 424, 1275 (2012)
- [4] B. K. Gibson, et al. A&A, 554, A47 (2013)
- [5] S. Pasetto, et al., A&A, 545, 14 (2012)
- [6] K. Pilkington, et al. MNRAS, 425, 969 (2012)
- [7] E. E. Salpeter, et al., ApJ, 121, 161 (1955)
- [8] M. Steinmetz, et al., AJ, 132, 1645 (2006)
- [9] R. R. Strickler, et al., ApJ, 699, 40 (2009)
- [10] J. W. Wadsley, et al., New Astronomy, 9, 137 (2004)