The Massive Star Population in M101. III. Spectra and Photometry of the Luminous and Variable Stars11affiliation: Based on observations with the Multiple Mirror Telescope, a joint facility of the Smithsonian Institution and the University of Arizona and on observations obtained with the Large Binocular Telescope (LBT), an international collaboration among institutions in the United States, Italy and Germany. LBT Corporation partners are: The University of Arizona on behalf of the Arizona university system; Istituto Nazionale di Astrofisica, Italy; LBT Beteiligungsgesellschaft, Germany, representing the Max-Planck Society, the Astrophysical Institute Potsdam, and Heidelberg University; The Ohio State University, and The Research Corporation, on behalf of The University of Notre Dame, University of Minnesota and University of Virginia.
Abstract
We discuss moderate resolution spectra, multicolor photometry, and light curves of thirty-one of the most luminous stars and variables in the giant spiral M101. The majority are intermediate A to F-type supergiants. We present new photometry and light curves for three known “irregular blue variables” V2, V4 and V9) and identify a new candidate. Their spectra and variability confirm that they are LBV candidates and V9 may be in an LBV-like maximum light state or eruption.
1 Introduction
Recent supernova surveys have lead to the identification of an increasing number of non-terminal optical transients with a wide range of properties. Some of these optical transients appear to be similar to the giant eruptions of the Car variables (Humphreys et al., 1999; Van Dyk, 2005; Van Dyk & Matheson, 2012), while others are more akin to the variability of normal Luminous Blue Variables (LBVs). A very small fraction of the optical transients originate from lower luminosity, heavily obscured progenitors that may be extreme asymptotic giant branch (AGB) stars or in a post red supergiant stage of evolution (Thompson et al., 2009; Khan et al., 2010; Bond, 2011). The continued monitoring of these optical transients has led to the realization that in some cases the apparent terminal explosion is preceded by smaller eruptions, e.g. SN2005gl (Gal-Yam et al., 2007; Gal-Yam & Leonard, 2009), SN2006jc (Pastorello et al., 2007) and most recently the peculiar SN2009ip (Mauerhan et al., 2013; Pastorello et al., 2013; Fraser et al., 2013; Margutti et al., 2013). Consequently, the connection between LBVs, giant eruptions, and true supernovae has come into question. But very little is known about the origin of these giant eruptions, their progenitors and their evolutionary state. An improved census of the most massive, evolved stars including the LBVs, and the hypergiants that occupy the upper HR Diagram is necessary to better characterize the properties of the possible progenitors. For these reasons, we have begun a survey of the evolved massive star populations in several nearby galaxies (Humphreys et al., 2013; Grammer & Humphreys, 2013; Humphreys et al., 2014).
This paper is the third in a series on the massive star content of M101. In the first two papers, we presented the photometric analysis and identification of the luminous and massive star populations, here we present spectroscopy and multi-epoch imaging for the most luminous stars. In the next section, we describe our target selection, observations, and data reduction. In we discuss the stars for which we have spectra and light curves, and in , we present the light curves for those without spectra. We summarize our conclusions in the last section.
2 Data and Observations
Our motivation for this study is to examine the spectra and photometric variability of the most luminous stars in M101. Using their spectra and light curves, we identify LBV candidates, hypergiants, and other luminous stars and emission-line stars.
2.1 Target Selection
Most of our targets were selected from the Hubble Legacy Archive (HLA) aperture photometry of HST/ACS images from proposals GO-9490 (Nov. 2002) and GO-9492 (Jan. 2003) to be brighter than mag. Since the images of M101 are crowded, particularly in the spiral arms, we later performed our own photometry using Dolphot (Dolphin, 2000) to create a catalog of high precision photometry even in crowded regions (Grammer & Humphreys, 2013, hereafter Paper I). In this paper, photometry from Paper I is referred to as the catalog photometry. We cross-identified targets selected from the HLA with the catalog using a tolerance of 0.1 in radial separation. We note that a few of the targets with in the HLA photometry are much fainter in the catalog. The targets with differences in larger than a few tenths of a magnitude are in regions where aperture photometry is inappropriate (e.g. crowded regions). We visually inspected the surrounding region of each unmatched star and found in all cases, that the unmatched targets were located in parts of the galaxy where photometry was likely to be highly compromised.
In addition to the targets selected from HST/ACS photometry, we included blue supergiants and known luminous variables from Sandage & Tammann (1974) and Sandage (1983). The blue supergiants and luminous variables were originally identified on photographic images. Since precise astrometry is required for our study, we used a Sloan Digital Sky Survey (SDSS) image of M101 to identify the blue supergiants and known variables by eye. Many of the Sandage (1983) stars were also in regions of significant crowding which made positive identification difficult. Thus, we were only able to include 7 stars: B4, B53, B65, B162, V2, V4, and V9.
2.2 Spectroscopy
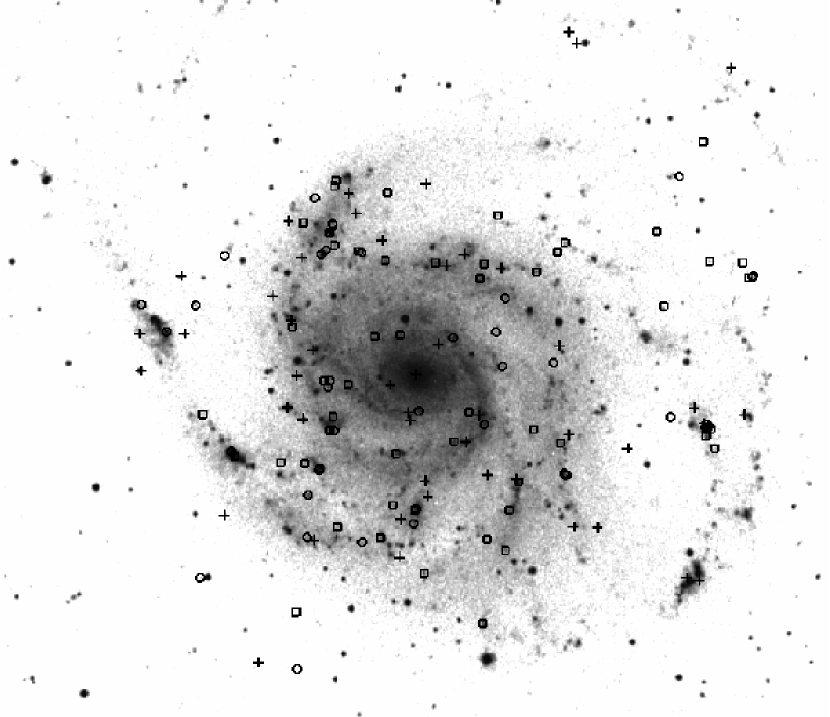
When we were selecting targets for spectroscopy, we did not yet have the light curves from the Large Binocular Telescope (LBT) survey, discussed below §2.3. Since we could not obtain spectra for every star, we prioritized our targets for spectroscopy by roughly estimating their variability using an “absdiff” image. The absdiff image was created by taking the absolute value of the difference between a reference image, described below, and all other images. Then, the subtracted images were convolved with a 2 pixel Guassian filter and summed. In the absdiff image, the “brighter” the source, the more variable it is likely to be. All stars with HLA -band magnitudes brighter than 20.5 mag were then overlaid onto the absdiff image. Priority for spectroscopy was assigned by degree of variability and -band magnitude. Thus the brightest stars with clear indications of variability received the highest priority. We selected 56 of the brightest and most variable stars for spectroscopy with the Hectospec on the Multiple Mirror Telescope (MMT), and 46 of the fainter ones for spectroscopy with the LBT MODS1 spectrograph. The spectrscopic targets are shown in Figure 1.
The MMT observations were obtained in June 2012 with the Hectospec multi-object spectrometer (MOS; Fabricant et al., 1998). The Hectospec111http://www.cfa.harvard.edu/mmti/hectospec.html is a fiber-fed MOS with a 1∘ FOV and 300 fibers; each fiber subtends on the sky. We used the 600 mm-1 grating with the blue tilt centered on 4800Å and the red tilt centered on 7300Å. The 600 mm-1 grating gives a spectral coverage of Å with 0.54Å pixel-1 resolution. The total integrated exposure times were 240 minutes in the blue and 180 minutes in the red. The spectra were reduced using an exported version of the CfA/SAO SPECROAD package for Hectospec data E-SPECROAD222External SPECROAD was developed by Juan Cabanela for use on Linux or MacOS X systems outside of CfA. It is available online at http://iparrizar.mnstate.edu.. The specta were bias subtracted, flat -fielded, wavelength calibrated, and sky subtracted. The IRAF task sensfunc, in the ONEDSPEC package, was used to flux calibrate the spectra with the standard Feige-66.
The 46 stars selected for observation with the LBT were observed in May 2012 and June 2013 using the Multiple Object Dual Spectrograph (MODS) (Pogge et al., 2006). For multi-object spectroscopy MODS uses masks with a 6.5 arcmin FOV, and a dichroic with two gratings, 400 mm-1 and 670 mm-1, to get a full spectral range of 3200Å to 10000Å, and moderate resolution (R 1800). Since the MODS FOV is considerably smaller than Hectospec, four masks were required to cover the disk of M101. Problems with a beta version of the reduction pipeline prevented us from including the LBT spectra here. Analysis of the LBT/MODS spectra will be included in a future paper.
The 31 confirmed members are listed in order of right ascension in Table 1 with object identification, position, photometry, variability and their spectral type. The 19 foreground stars are in Table 2. The S/N in the spectra for six of the targets was too poor to assign a spectral type. The blue and red spectra of all of the targets are available at http://etacar.umn.edu/LuminousStars/M101/ in FITS format. The flux calibrated and smoothed spectra are also available in a subdirectory. Spectra of selected members are discussed in the next section.
2.3 LBT Imaging
M101 has been monitored as part of a variability survey of 27 nearby ( Mpc) galaxies using the twin 8.4m LBT (Kochanek et al., 2008; Gerke, Kochanek & Stanek, 2014). Between March 2008 and January 2013, M101 was observed using the Large Binocular Camera (LBC) in the -band with the red-optimized LBC-Red camera while simultaneously cycling through observations in the filters with the blue-optimized LBC-Blue camera (Giallongo et al., 2008). One of us, J. Gerke, did the basic data reduction steps including overscan correction, bias subtraction, and flat fielding with the IRAF MSCRED package, as well as the subsequent analysis of the images. Although M101 was observed even in sub-optimal conditions, only images with a point spread function (PSF) with a full width half max (FWHM) are analyzed.
For the variability analysis, the ISIS image subtraction package (Lupton, 1998; Alard, 2000) was used to process the multiple LBT images. The image subtraction works by matching a reference image to each exposure and subtracting it to leave only the sources which have time-variable flux. The reference image was created by median combining the four best seeing epochs where an epoch is defined as the images for one night. The astrometric solutions were determined using the IRAF package MSCTPEAK and SDSS stars (Ivezić et al., 2007) in the FOV. For each epoch, the -band image serves as the astrometric reference image for all four filters which ensures identical astrometric solutions between filters. By doing this, any ambiguity associated with cross-matching sources between filters is minimized. The typical astrometric errors are .
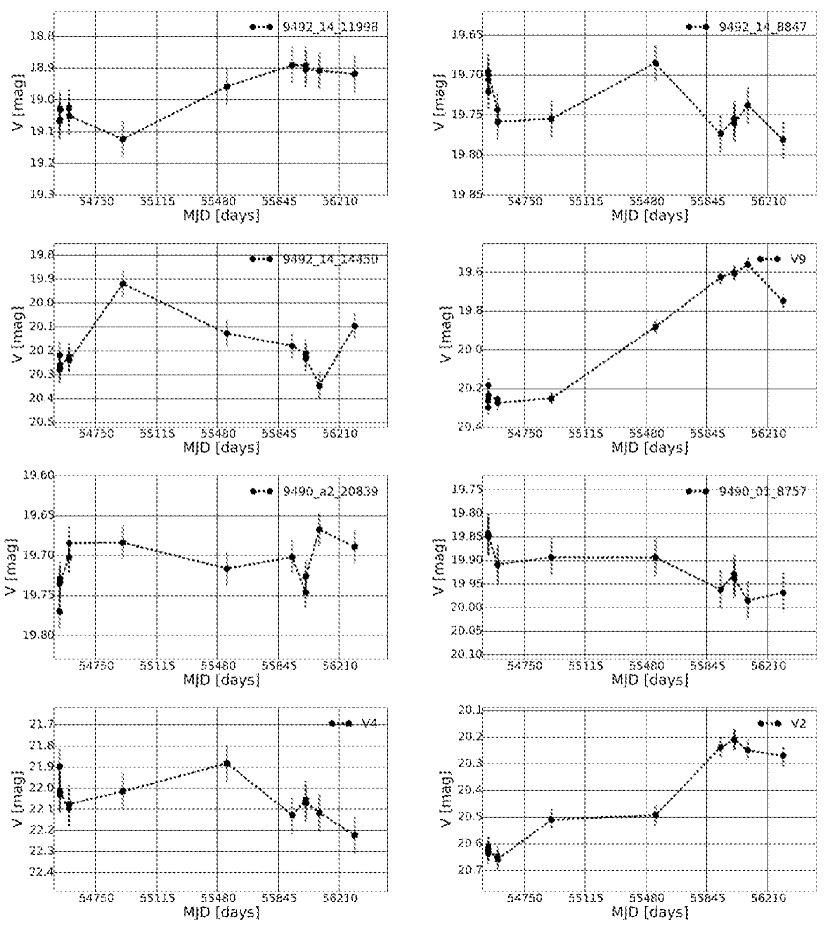
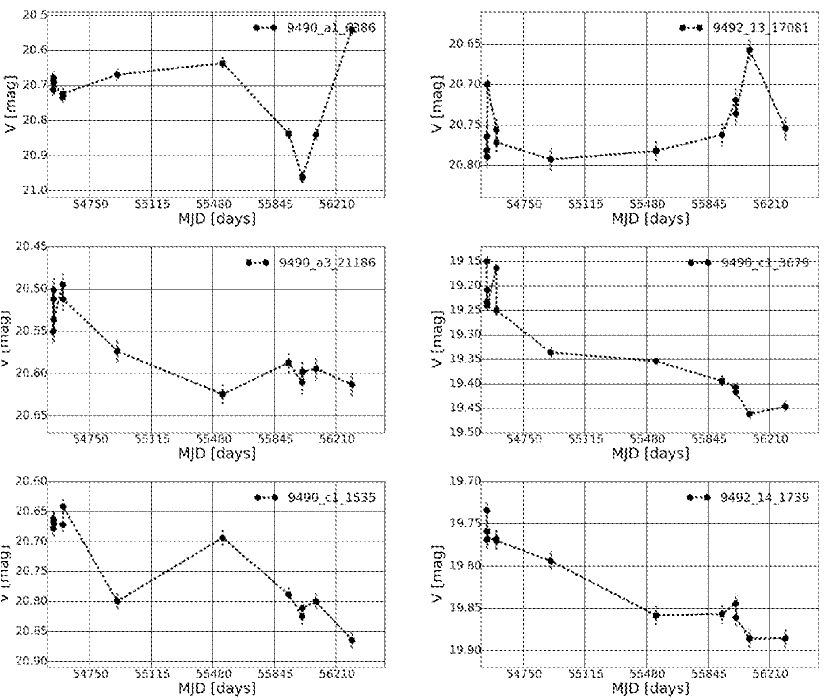
The light curves for the stars with HLA -band magnitudes brighter than 20.5 mag were extracted using ISIS. Instrumental magnitudes for each epoch were converted to magnitudes using photometric calibrations based on SDSS photometry which was transformed from the SDSS filter system to the system using the prescription described by Jordi et al. (2006). The resulting photometry has photometric errors that are magnitudes. For each target, we calculate the root-mean-square (RMS) error, with respect to the median magnitude, as a measure of stellar variability. We identify targets as variable sources for further analysis if their RMS variability is greater than the median photometric error. The -band light curves for spectroscopic targets observed with MMT which met our criterion for variability are shown in Figure 2
3 Classification of the Stars
For discussion, we have grouped the spectra of the confirmed members by their broad spectral characteristics and known variability. In this section we describe the characteristics of four groups: the early-type or hot supergiants, intermediate-type supergiants, emission-line sources, and candidate LBVs. We describe the criteria for membership in each group in the subsections below and discuss the spectra, photometry, and light curves of several interesting or representative stars. Group membership and comments on their spectra and variability are also included in Table 1. For reference, we assume the distance modulus, derived from the tip of the red giant branch, of (m-M)0 = 29.05 0.06(random) 0.12 (systematic) magnitudes (Shappee & Stanek, 2011). The foreground extinction towards M101 is only E = 0.01 (Schlegel et al., 1998) which corresponds to a visual extinction of = 0.03 magnitudes assuming a Galactic extinction law (Cardelli et al., 1989). For those stars with spectral types, we estimate the internal extinction by comparing their observed colors with the intrinsic colors from Flower (1977, 1996, see Table 1). Representative blue spectra from 3900 – 5200Å are shown in Figures 3 to 6, and snapshot images of the confirmed members are in the Appendix.
3.1 The Hot Supergiants
This group includes the luminous O- and B-type supergiants. Many of these stars show strong emission lines, mostly nebular, but with an absorption line spectrum strong enough to allow an estimate of the spectral type. In this section we describe stars with interesting spectral features and/or photometric variability.
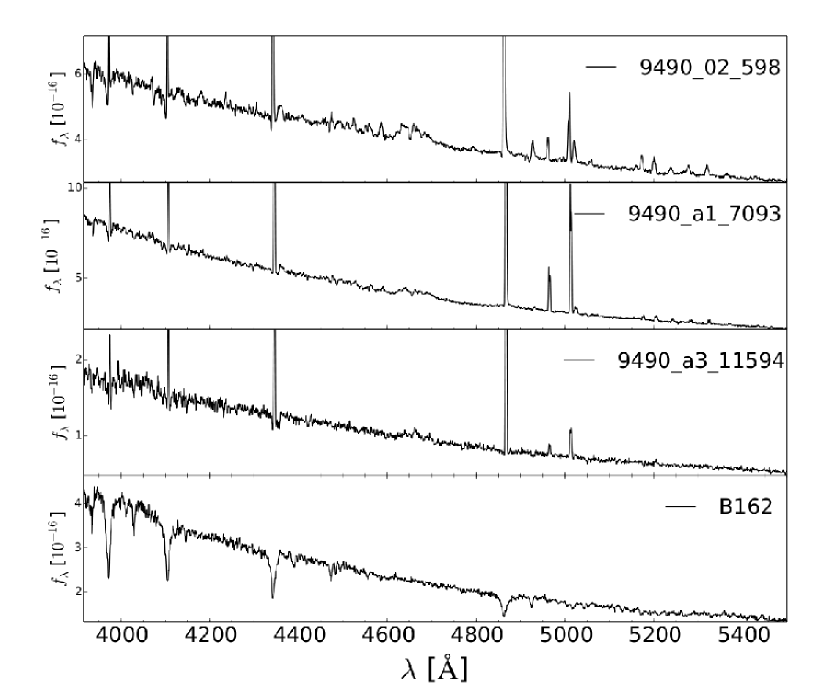
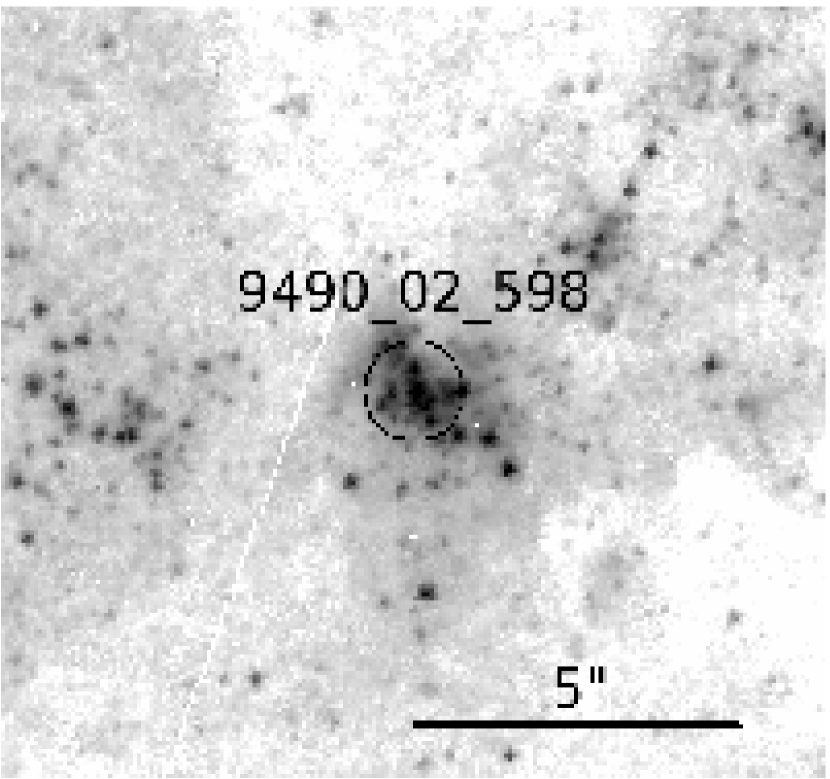
The spectrum of 949002598 (early B: I + WN + ?) shows absorption lines of Si IV 4090 and 4116, Si III 4552, C III 4650, and He I 4026 and 4144 consistent with an early B-type supergiant (Figure 3), although a Ca II K line is also present. The Balmer series, as well as the He I lines of 4471, 4922, 6678 and 7065 are in emission with P-Cygni profiles. He I 5876 has a double or split emission profile not present in any of the other emission lines. Emission lines of Fe II, [Fe II], and the broad WN nitrogen emission features at 4630-4670Å and 5680-5730Å are present. The terminal velocity, determined from P-Cygni profiles, is normally measured from the blue edge of the absorption component. Because the spectra are moderate resolution with low S/N, we can more reliably determine the wind velocity from the absorption minima, see (Humphreys et al., 2014). We find a wind velocity of kms-1 which is on the low end, but in the range for normal early-type supergiants (Crowther et al., 2006; Mokiem et al., 2007).
The catalog photometry for 949002598 is = 20.07 and = 0.30. Based on its early B-type spectrum , we assume an intrinsic color of -0.20 (Flower, 1977, 1996) yielding a fairly high interstellar extinction of Av of 1.6 mag and Mv = -10.5 mag. Inspection of the HST/ACS band image shows that 949002598 may be a point source although it is located in a crowded region (Figure A10). It was not identified as a point source in the LBT images due to poorer spatial resolution, thus we do not have variability information. The spectrum is similar to an LBV in quiescence (Humphreys & Davidson, 1994) but without a light curve we cannot say with any certainty that 949002598 is an LBV candidate. With the Ca II K line it may be composite.
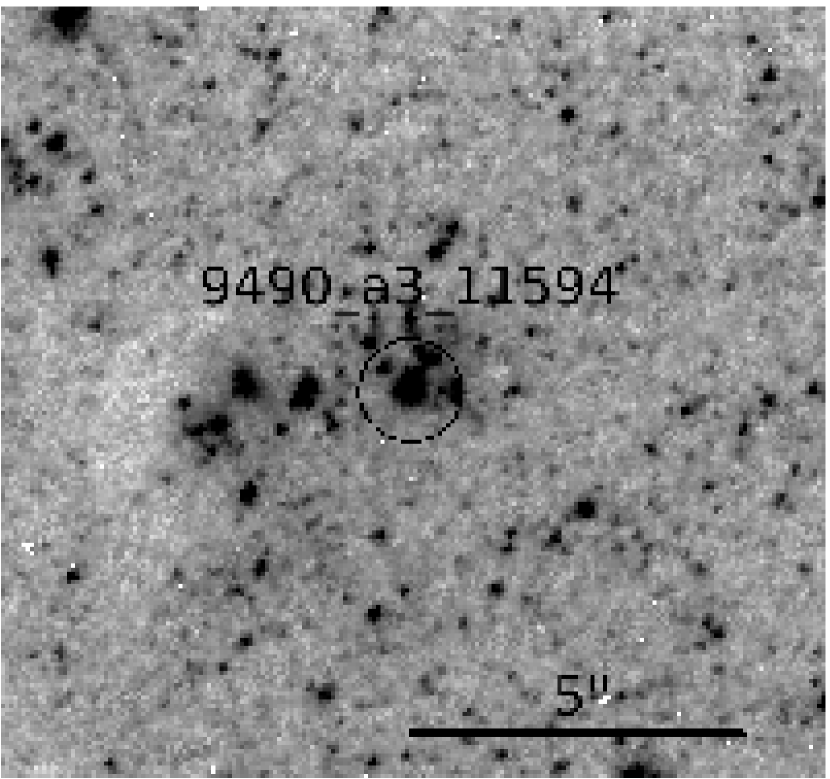
The spectrum of 9490a311594(Early B: I + WN:) is shown in Figure 3. The presence of the C III/O II features at 4068-4076, Si IV at 4089 and 4116 and absorption lines of He I at 4026, and 4144 indicate that it has an early B-type spectrum. It also has a weak WN feature at 4630-4670. The relative strength of the O II 4070-4076 to He I 4026 indicates high luminosity. The emission lines are primarily nebular. We note that H, He I 5876 and the [O III] lines are double, but the [N II], [S II] and H in the red are not. These double emission lines are discussed below.
The catalog photometry for 9490a311594 is = 21.5 and = 0.06, but the HLA and LBT photometry show it 2 magnitudes brighter and 0.3 magnitudes redder than the catalog photometry. 9490a311594 is located in a crowded region (Figure A12), thus the magnitudes obtained from aperture photometry may be significantly altered by the neighboring stars. The multi-epoch photometry for 9490a311594 shows no variability in magnitude or color.
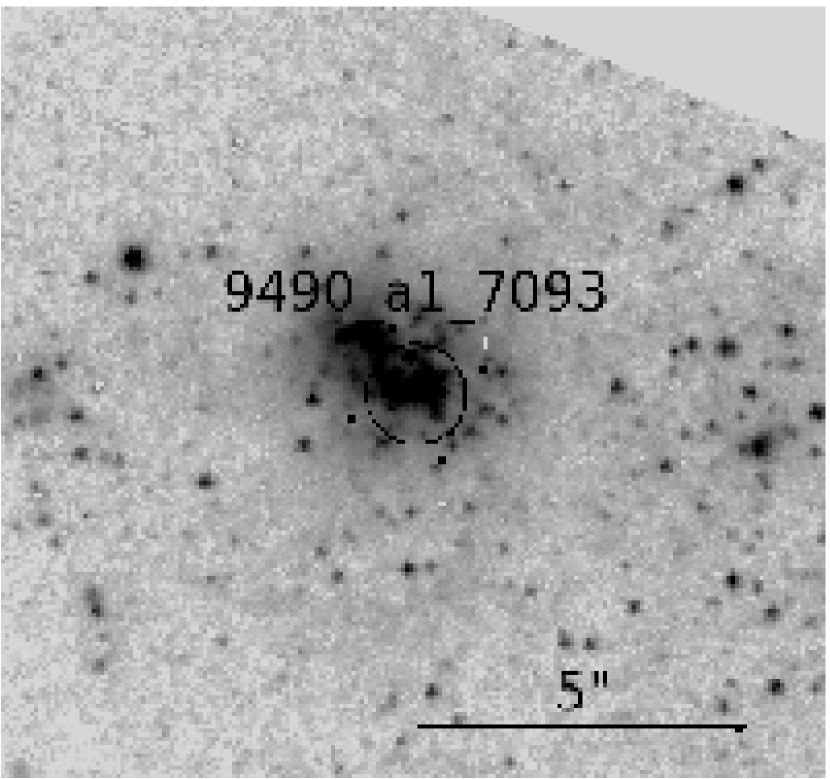
9490a17093 (Mid B: I) has strong Balmer and nebular emission lines (Figure 3). It resembles 949002598 with He I absorption lines 4026, 4144, and 4387 and the C III/O II absorption feature. These lines suggest an early B-type spectrum, but the Mg II 4481 seems too strong. It is in a crowded field so the spectrum may be a blend. We tentatively classify it as a mid-B-type supergiant. Fe II and [Fe II] emission lines are present, as well as the WN nitrogen emission at 4630-4670Å. He I 5876Å, H, the [O III] nebular lines and the Fe II emission lines have double or split emission profiles. However, the nebular [N II] and [S II] lines in the red plus H do not show the split profiles.
The catalog color and magnitude for 9490a17093 are = 0.31 and = 20.20, respectively. 9490a17093 is located in a very crowded region (Figure A28) which the lower resolution of the LBT cannot resolve. Consequently, we do not have information on its variability. Since we were unable to assign a precise spectral type to 9490a17093, we estimate the likely extinction for a mid-B type supergiant, AV = 1.3 mag. This may seem high but 9490a17093 is embedded in a region of intense star formation.
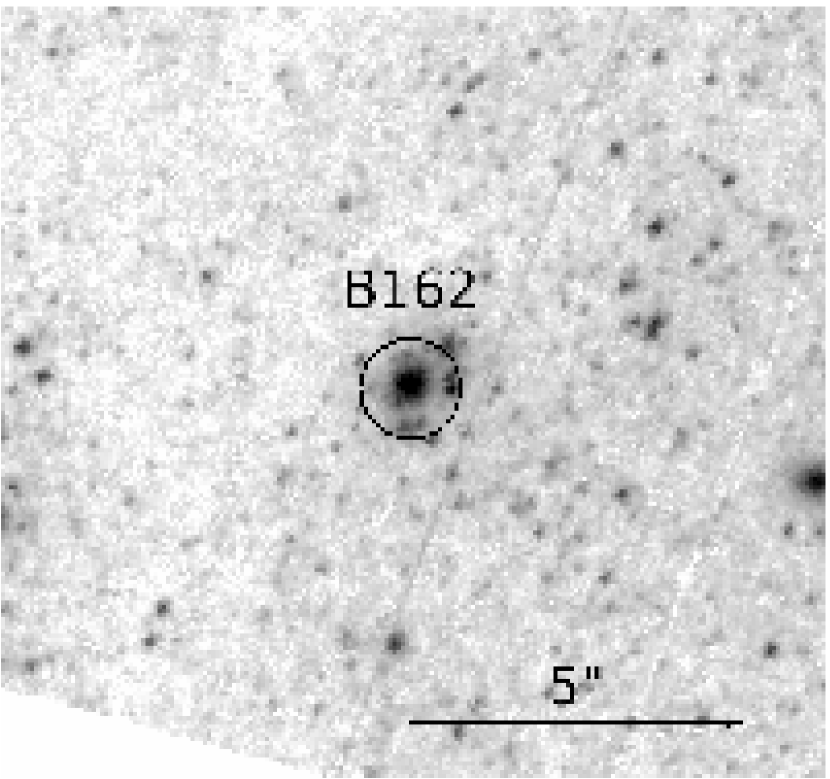
B162 (B8: I) was identified as a blue supergiant in M101 by Sandage (1983). Followup spectroscopy by Humphreys & Aaronson (1987) confirmed its membership, They estimated its spectral type to be late B to early A, and suggested that B162 may be a composite based on the width of the Balmer lines. Our spectrum of B162 (Figure 3) is one of the few without any nebular contamination. Based on the He I 4471 and Mg II 4481 absorption lines, we suggest a spectral type of B8; the ratio of Si III 4552 to He I 4387, as well as the presence of the high luminosity indicator O I 7774, confirms that B162 is a supergiant.
The catalog photometry for B162 indicates it is extremely luminous with a -band magnitude of = 19.52. As a result, B162 is saturated in the LBT images thus preventing us from assessing its variability. Sandage (1983) found no evidence for variability. The observed color for B162 is = 0.09 which is only 0.1 magnitudes redder than expected for its spectral type. Correcting for extinction, its Mv is -9.9 mag and with the bolometric correction for a late B-type supergiant, we estimate the bolometric magnitude for B162 to be = -10.4. The Balmer lines seem too strong however for such a high luminosity star. It may be a composite or blend of more than one star. See Figure A18, where the object appears to be an unresolved small group of 2 - 3 stars.
Three of the stars described in this subsection have double emission profiles in the nebular and hydrogen emission lines. We find that this is the case for several stars in this study. Since the stars are in crowded regions with strong nebular emission, the double features may be due to emission from the two sides of these large H II regions or from more than one emission region along the line of sight. However in the case of 9490a17093 described above, the Fe II emission lines which presumably arise in the stellar wind, also show the split profiles. For this star the velocity separation of the Fe II peaks is 180 km s-1 which corresponds to a possible velocity of expansion of 90 km s-1.
The spectral types, catalog photometry, visual extinction, and other notes regarding the remaining hot or early-type supergiants are given in Table 1.
3.2 The Intermediate-Type Supergiants
The intermediate supergiant group includes the visually most luminous A- to F-type stars. The intermediate or yellow supergiants, often have strong emission due to stellar winds and mass loss, but due to the degree of nebular contamination in most of these spectra, a stellar origin is uncertain in most cases. Here we discuss some representative and interesting stars in this group.
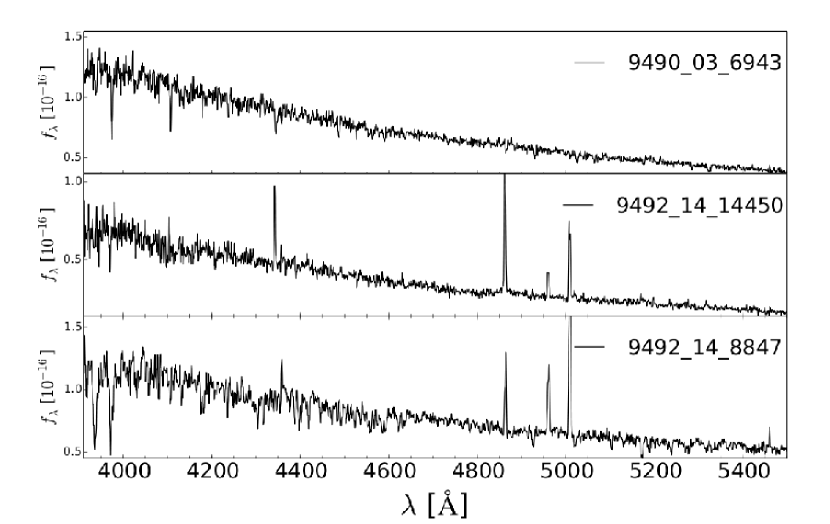
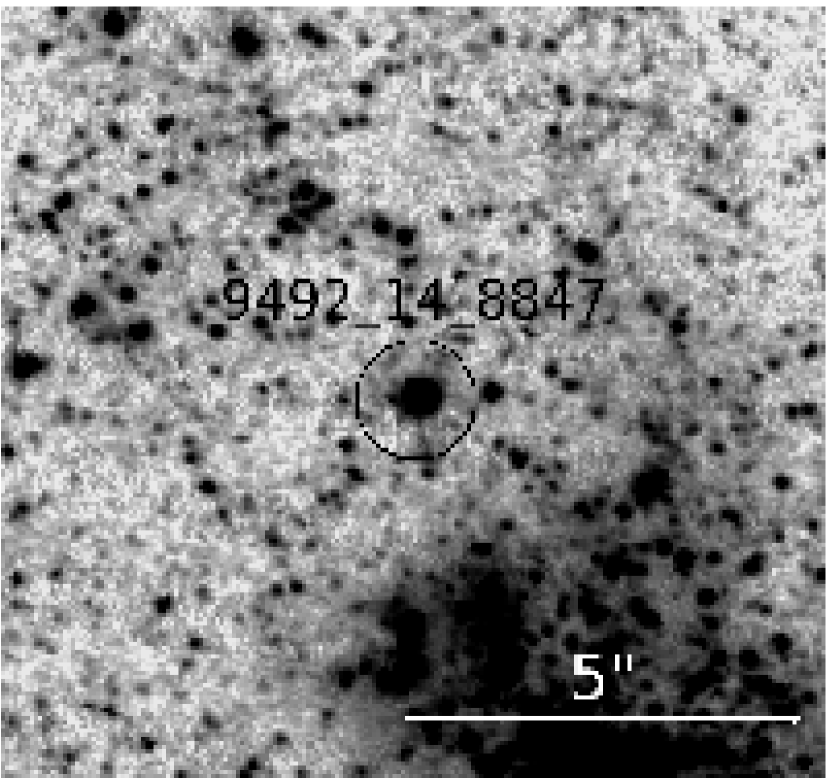
The spectrum of 9492148847 (F5 I), in Figure 4, shows strong Ca II H and K lines and the luminosity sensitive Fe II/Ti II blends at 4172-4179. The presence of a weak G-band indicates a spectral type later than F2. We estimate 9492148847 to be approximately F5 based on the absorption lines of Ca I 4226, Fe I 4046 and 4383 lines, and Mn I 4032. We were not able to use the Balmer lines in the classification due to strong nebular contamination.
The -band light curve for 9492148847 (Figure 2) shows only minor variability on the order of 0.1 magnitudes in amplitude. The catalog photometry for 9492148847 is = 19.69 and = 0.38. The observed color is only marginally redder than expected, Av = 0.2 and Mv is -9.5 mag. Adopting the bolometric correction for an F5 supergiant (BC = 0.18; Flower, 1977, 1996), its bolometric luminosity of 9492148847 is = -9.3. Furthermore, the HST/ACS image shows that 9492148847 is on the periphery of a star-forming region (Figure A2) but appears to be a single point source. Thus, we conclude that 9492148847 is an intermediate supergiant which occupies the same part of the HR diagram as the yellow supergiants in M31 and M33 (Humphreys et al., 2014).
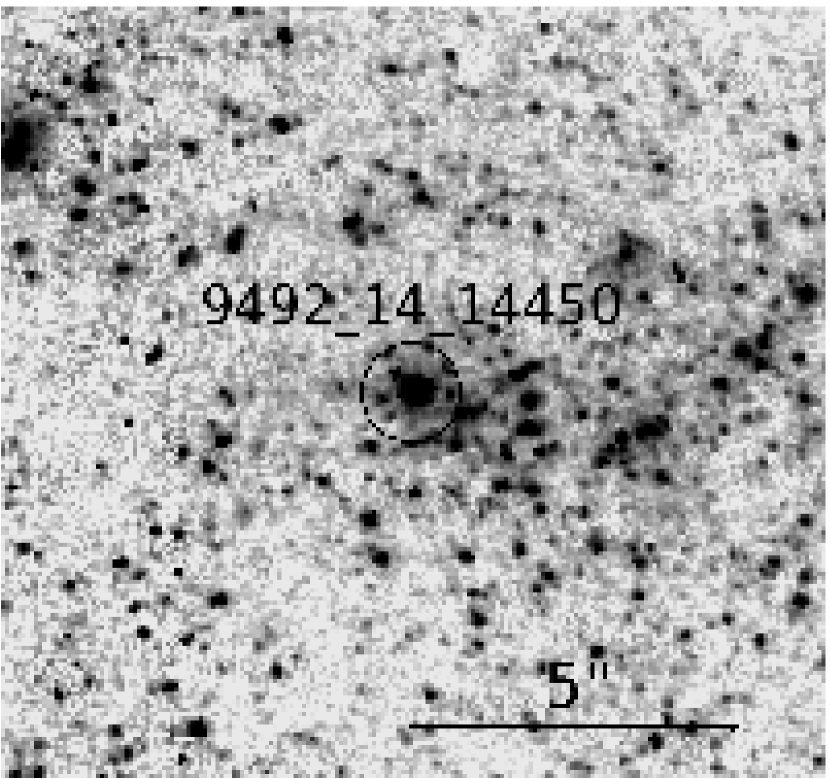
The low S/N spectrum of 94921414450 (Early A I) in Figure 4 shows emission lines of Fe II and [Fe II] and strong H and H emission with broad wings asymmetric to the red, indicative of Thompson scattering and the presence of a stellar wind. The relative strength of He I 4471 and Mg II 4481, suggest an early A spectral type. The [O III] lines and He I 5876 are double, and 5876 also has a P Cyg profile. While H and H are not clearly double-peaked, they are both asymmetric to the red.
Based on the catalog photometry, 94921414450 had an apparent magnitude of = 19.74 and an observed color of = 0.34 in January 2003. The multi-epoch photometry from the LBT shows variability on the order of 0.4 magnitudes (Figure 2) with a maximum of = 19.95 in March 2009 (MJD 54912). 94921414450 is located in a very crowded, star forming region (Figure A3), and based on its observed color has relatively high interstellar extinction, Av = 0.9 mag, assuming an A2 spectral type. Mv is -10.2 mag and Mbol is -10.3. Thus 94921414450 has several characteristics of a stellar wind and given its high luminosity based on its catalog photometry, it qualifies as a warm hypergiant star possibly similar to those in M31 and M33 (Humphreys et al., 2013).
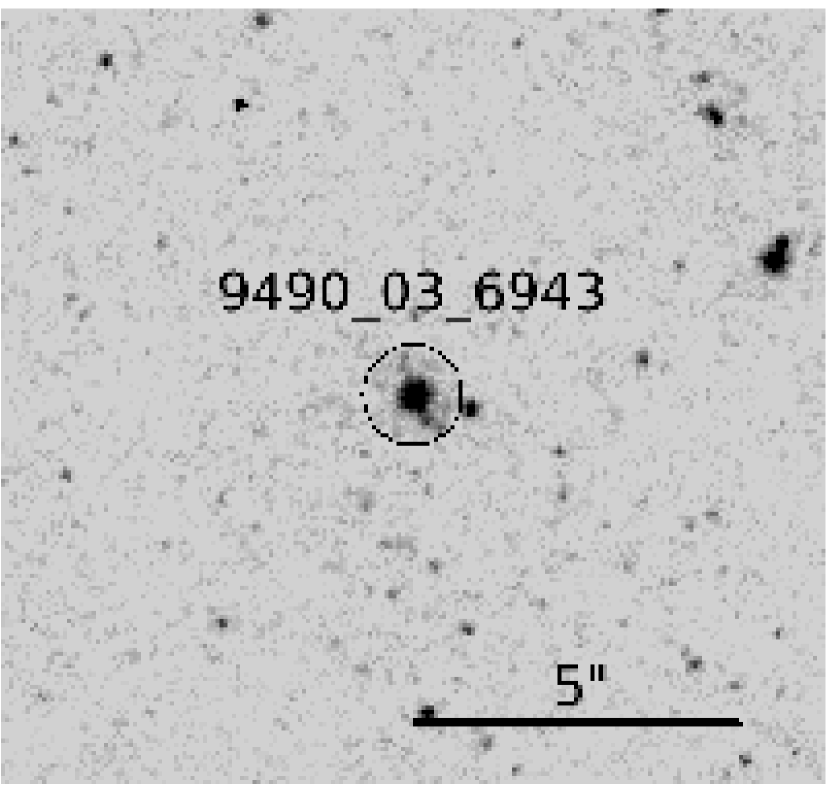
9490036943 has an early to mid-A-type spectrum.. It is one of the few targets with no nebular contamination (Figure 4). Its strong H emission line with very broad wings and P Cygni absorption is thus circumstellar. It is relatively isolated (Figure A15) and appears to be a single star.The catalog photometry is not contaminated and gives rather low visual extinction for a mid A spectral type ( A2-A5) and Mv = -9.0.
The catalog photometry, visual extinction, spectral types, and any other notes regarding the remaining intermediate-type supergiants are given in Table 1.
3.3 Emission-Line Sources
The emission-line stars have a blue continuum and strong emission lines. The distinction between targets in this group and the hot supergiants is the lack of absorption features permitting the estimation of a spectral type. There are only three stars in this group and one appears to be an H II region.
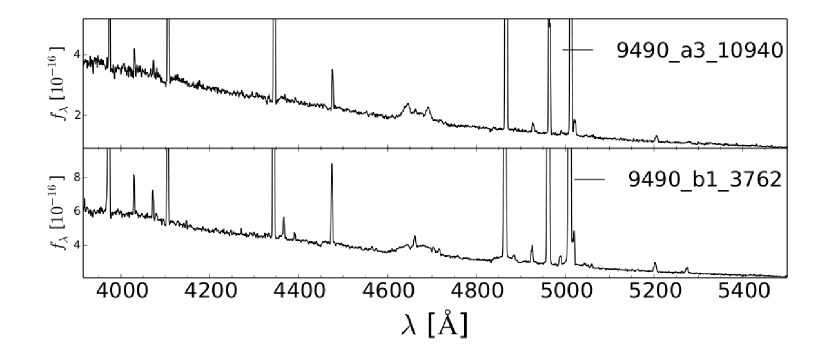
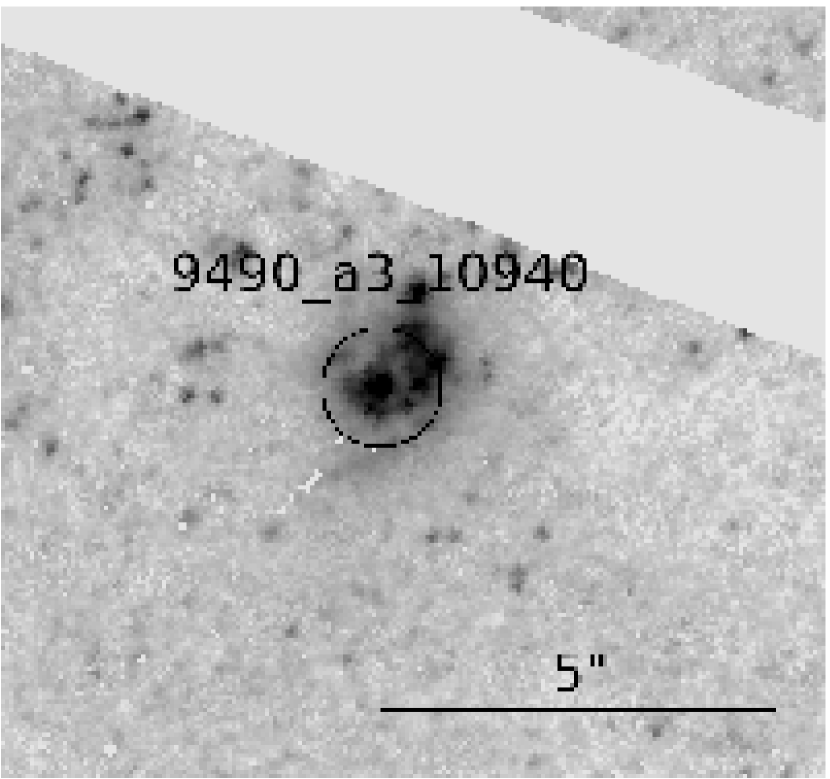
The spectrum of 9490a310940(Of/WN) is dominated by strong H and He I emission as well as the broad N III and N II emission features seen in WN stars (Figure 5). Some of the weaker emission lines include He II 4686, O II 4070-4076, and Fe II. Based on its spectral features, 9490a310940 is an Of/WN star. The catalog magnitude for 9490a310940 is which is much fainter than our cutoff of based on HLA photometry. Inspection of the -band ACS image (Figure A7) shows that 9490a310940 is in a crowded region and the HLA aperture photometry is contaminated by nearby stars. The observed color is which is approximately 0.2 magnitudes redder than we would expect for a star as hot as 9490a310940. Though we do not have a precise spectral type for 9490a310940, adopting -0.3 mag, which is typical for hot O-type stars, the extinction towards 9490a310940 is roughly 0.7-0.8 magnitudes and Mv is -8.3 mag. Correcting for extinction and adopting a bolometric correction of -3.0, we estimate the bolometric luminosity to be M.
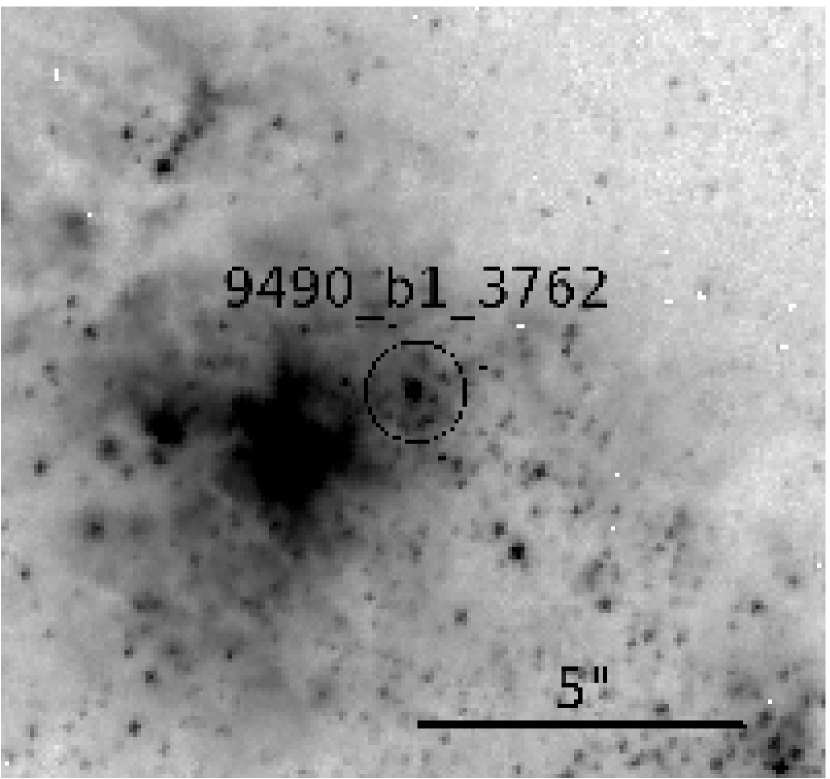
9490b13762 is in the giant star-forming complex NGC 5461 (Figure A30) and many of the emission features in its spectrum (Figure 5) are nebular. Despite the strong nebular contamination, the H and H line profiles have very broad wings suggesting a strong stellar wind. We also identify He I, C III 4647-4652, and C IV 4658 weak absorption lines indicating an underlying hot star.Emission lines of [S II] Fe II, [Fe II], and [Fe III] and broad WN nitrogen emission region from from 4620 - 4720Å are present. As in several other stars, H, the [O III] lines and He I 5876 have split emission profiles.
The catalog photometry for 9490b13762 gives = 22.13 and = 0.23. The emission lines from the highly-ionized species we see in the spectrum can only be produced by the radiation from an OB-type star with 0. Since the observed color is much redder than we expect for an OB-type star, it is likely that 9490b13762 is highly reddened or a blend of objects. Since it is in such a highly crowded region (Figure A30) we cannot determine its variability from the LBT images.
The low S/N spectrum of B4 (Sandage, 1983) has the emission line spectrum of an H II region. H, He I 5876, and the [O III] lines show split or double profiles.
3.4 Candidate LBVs
A census of variable stars in M101 was first conducted by Sandage & Tammann (1974) who identified nine irregular blue variables (V1 - V9). Subsequent photometric studies confirmed the variable nature of V1 and V2, and added a tenth star (V10; Sandage, 1983). Fifty-year historical light curves for the candidate LBVs V1, V2, and V10 are presented in Sandage (1983). V3 through V9 are known to be variable, and are considered to be candiate LBVs, but lack historical light curves. Here we present the light curves and spectra for V2, V4, and V9. We have also identified an additional candidate LBV, 94921411998.
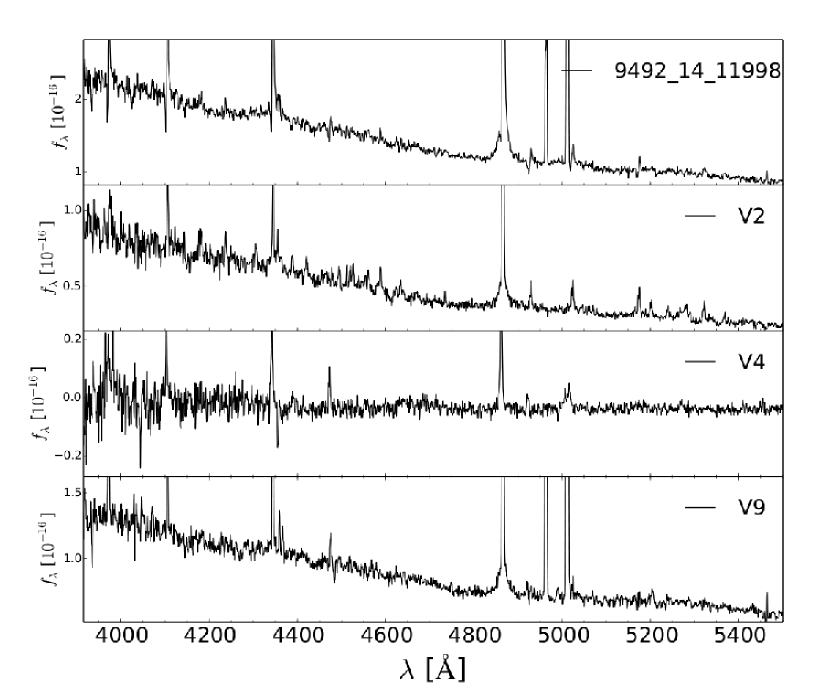
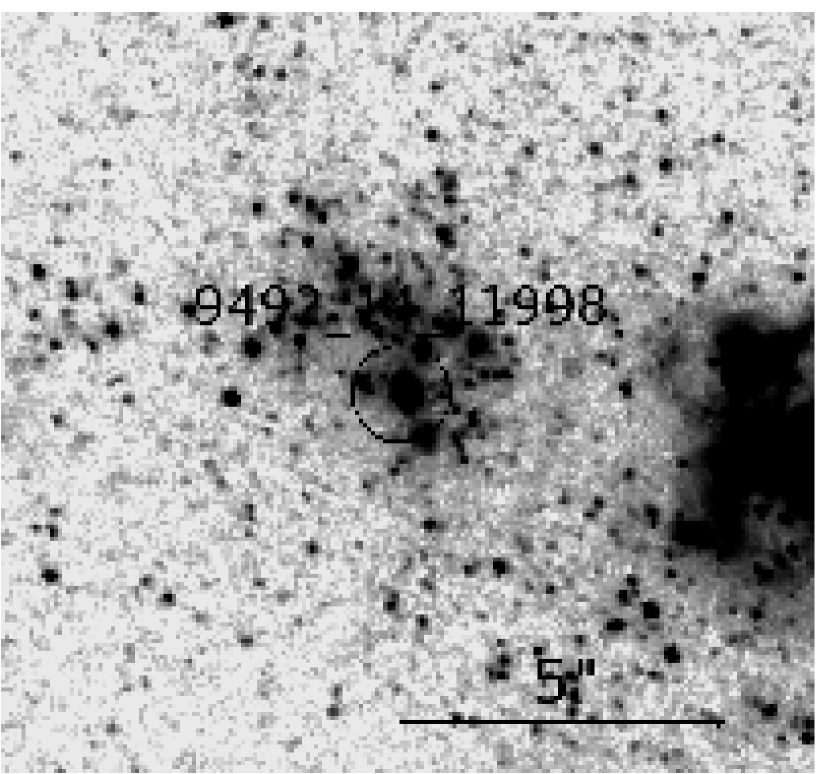
The spectrum of 94921411998 shown in Figure 6 is dominated by Balmer and He I emission lines with strong P-Cygni profiles. The line profiles of H and H have very broad wings and are asymmetric to the red, a feature characteristic of Thompson scattering. We estimate a wind velocity of km s-1 from the P Cygni absorption component in the hydrogen and He I emission lines. This is somewhat higher than the wind velocities of the M31 and M33 LBVs measured the same way (Humphreys et al., 2014), but on the low end for normal OB supergiants (Crowther et al., 2006; Mokiem et al., 2007). Weak Fe II emission is also present. We also identify absorption lines of He I at 4009,4026,4121 and 4144Å, and Si II at 4128-31Å typical of an early B2-B3-type supergiant
The -band light curve for 94921411998 in Figure 2 shows that the star has steadily increased in brightness by approximately 0.2 magnitudes over the last 4 years. The spectrum for 94921411998 was obtained at its current visual maximum of 18.9 mag. The catalog photometry, which was observed in January 2003, indicates that 94921411998 had a significantly fainter apparent magnitude ( = 19.40) than its present value. Its observed color in 2003 was = 0.19 and based on our LBT photometry, it has not changed.
If we assume an intrinsic color of corresponding to a mid-B-type supergiant (Flower, 1977, 1996) and a Galactic extinction curve, the visual extinction is magnitudes. Correcting the HST/ACS visual magnitude for this extinction, 94921411998 has an absolute visual magnitude of magnitudes. Adopting the bolometric correction (BC) for a mid-B supergiant (BC -1.05; Flower, 1977, 1996), 94921411998 has a high bolometric luminosity of = -11.6, but inspection of the HST/ACS image (Figure A1) shows that it is in a crowded region and the photometry is likely contaminated by neighboring stars. Despite the photometric uncertainties introduced by crowding, the spectral features of 94921411998 are similar to an LBV in quiescence. Continued monitoring will be necessary to determine whether or not 94921411998 is an LBV.
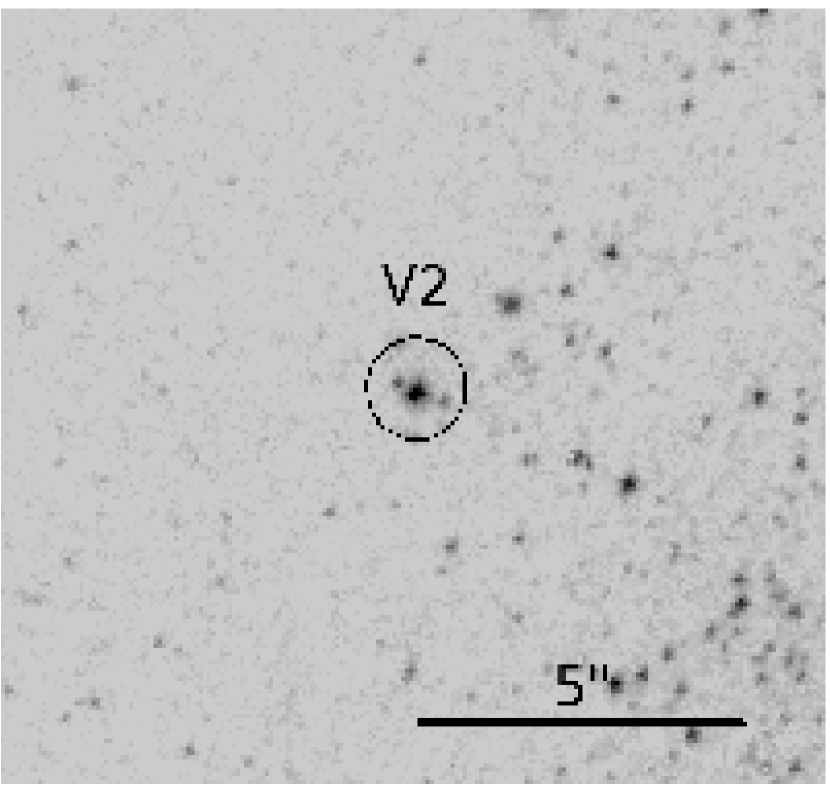
V2 is one of the three previously identified LBV candidates in M101 (Sandage, 1983). Humphreys & Aaronson (1987) describe its spectrum as having H, H, [O II] 3727, and Fe II in emission. Our higher S/N spectrum confirms the described features and reveals broad-winged H and H emission lines, as well as [N II], and [S II] in emission in the red. H and the Fe II emission lines redward of H have split-emission-line profiles. These characteristics along with the fact that there is no [O III] 4959 and 5007 in emission suggests that the [N II], and [S II] lines may originate in the circumstellar environment rather than a nearby H II region. Furthermore, the HST/ACS -band image (Figure A29) shows that V2 is a single star and there is no indication of an H II region within the fiber.
The 50-year historical light curve for V2 is shown in Sandage (1983). Over the 50 years it was monitored, V2 faded from in 1910 to in 1960. Our 4.5-year -band light curve (Figure 2) indicates that V2 is increasing in brightness from = 20.6 in 2008 to = 20.25 in 2013. The current spectrum shows V2 to be a hot star and, therefore, in quiescence if it is an LBV.
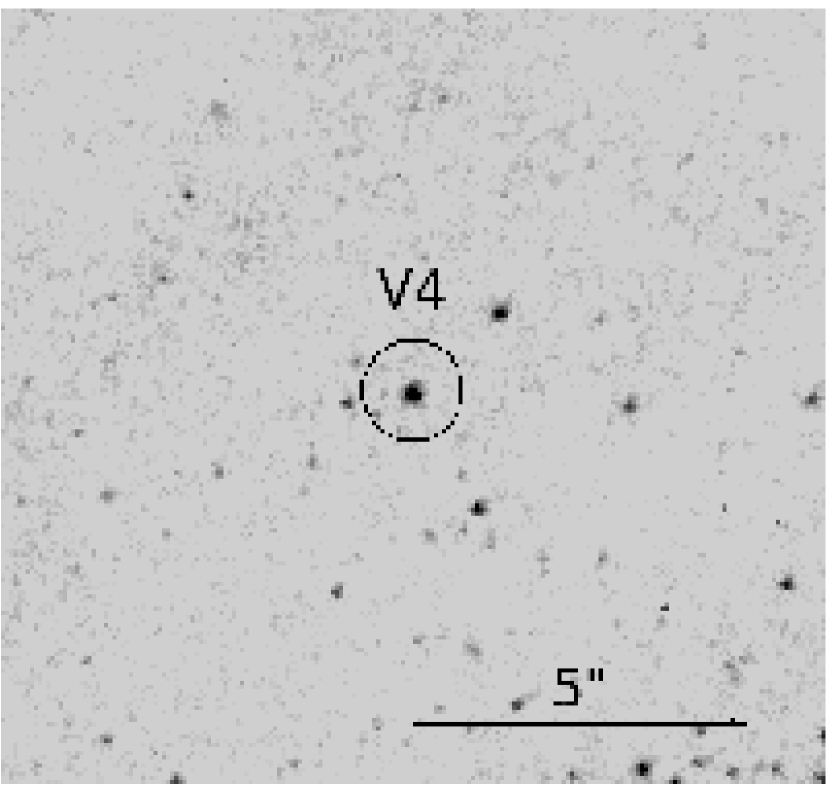
The spectrum of V4 is shown in Figure 6 and is fairly noisy despite smoothing. It is dominated by strong H, He I, [N II], and [S II] emission lines. The spectrum of V4 also shows Fe II emission throughout, although the lines are not particularly strong.
Although V4 was originally identified as a variable star in M101, (Sandage & Tammann, 1974), there is no historical light curve. The LBT light curve for V4 displays variability with an amplitude of approximately 0.4 magnitudes in the -band (Figure 2) with a maximum magnitude of = 21.9. The catalog photometry from observations obtained in 2003 show V4 to be at = 22.0. Sandage & Tammann (1974) list the visual minimum and maximum for V4 to be = 22.2 and = 19.9, respectively. Assuming their photometry to be accurate, V4 is currently at its visual minimum and the oscillations we see are likely the low-amplitude variations commonly superposed on the longer time scale LBV minima and maxima.
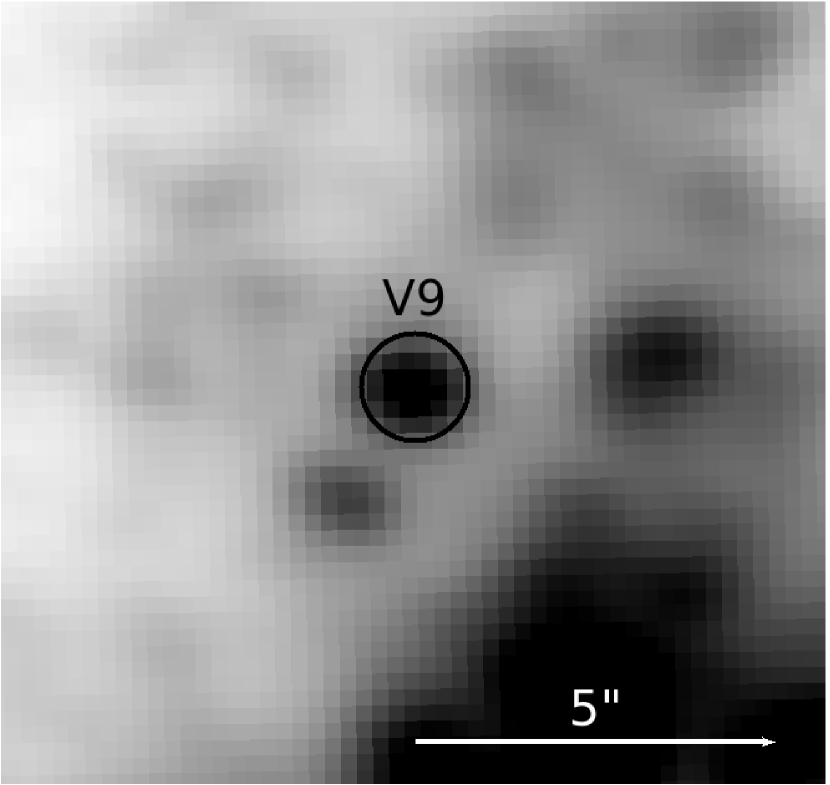
The spectrum of V9 in Figure 6 shows strong Balmer emission. The H and H lines have broad, asymmetric wings indicating a strong stellar wind. We do not see any indication of P-Cygni profiles, however, this could be due to the large amount of nebular contamination filling in the absorption lines. Absorption lines of Fe II, Mg II 4481, and the Ca II K-line are present. The luminosity sensitive O I 7774 in intermediate type stars is also present. V9 is located on the periphery of a large star-forming complex which is not within the HST/ACS footprint. However, we have examined the LBT images (Figure A4) and although the complex is not resolved, V9 is located far enough away that its spectrum and photometry should not be seriously contaminated, and it is unlikely that the spectrum is a blend
The LBT -band light curve for V9 indicates that the star has increased in visual brightness by approximately 0.8 magnitudes over the last 4 years from = 20.2 in 2008 to = 19.6 in 2012. The most recent data suggest V9 may be fading again. Similar to V4, V9 was originally identified as a variable star in M101 (Sandage & Tammann, 1974) with similar minima and maxima: = 20.3 (1950) and = 19.5 (1927/1947). When the Hectospec spectrum was observed, V9 was near its visual maximim based on the LBT light curve (Figure 2). Although dominated by a strong continuum and Balmer emission, its spectrum suggests that the underlying star was an early A-type supergiant and therefore may be an LBV in its optically thick wind or visual maximum state. Given its spectrum and variability history, it is very likely that V9 is an LBV.
4 The Variables Without Spectra
In this section, we discuss the light curves for the targets without spectra that met our criterion for variability. We separate the variables by their photometry into three groups: hot or early-type (OB), intermediate (AF), and cool (GM) stars. Assuming zero reddening, the selection criteria for our groups corresponds to , , and , respectively. Based on the our estimates of AV for our spectroscopically confirmed members (Table 1), the majority of the stars are likely to be at least somewhat reddened. Therefore, we have relaxed our selection criteria to: hot [], intermediate [], and cool []. When available, we used the HST/ACS catalog photometry to assign the stars to the three groups. For targets that were not recovered in the catalog, we used the LBT photometry, although the LBT colors are unlikely to be precise in crowded regions.
We have LBT spectra for many of the stars in this section. When the improved reduction pipeline is complete, we will discuss the spectra along with their light curves in a future paper.
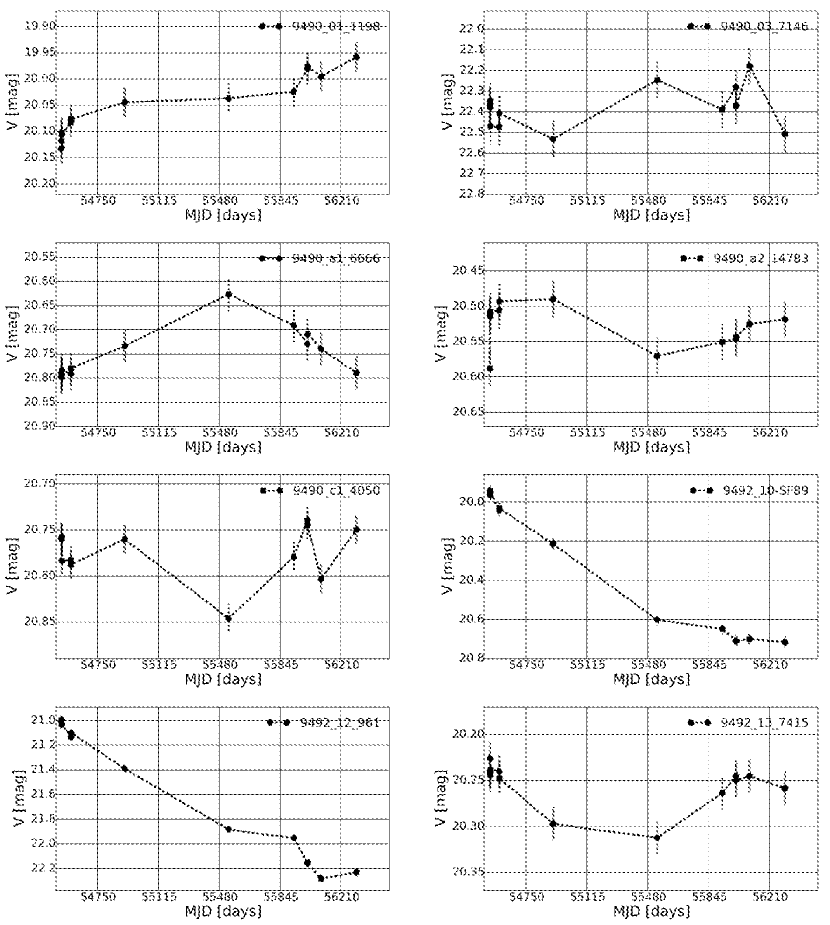
4.1 Early-Type Variables
Figure 7 shows the -band light curves for the eight early-type variables. The majority have photometric variability on the order of a few tenths of a magnitude. Two of the stars, 949210SF89 and 949212961, show changes in -band that are 1 magnitude. In both cases, the stars are fading. In 2003, they had -band magnitudes of = 21.22 and = 20.94, respectively, measured from the HST/ACS images. In March 2008, the LBT -band magnitudes did not differ by more than a tenth of a magnitude compared to 2003. Though we do not have data between 2003 and 2008, the similarities suggest that their decline in brightness may be a recent development or alternatively the stars may be semi-periodic. Given their photometric colors and variability, 949210SF89 and 949212961 may also be LBVs. Spectral analysis and photometric monitoring will be necessary for confirmation.
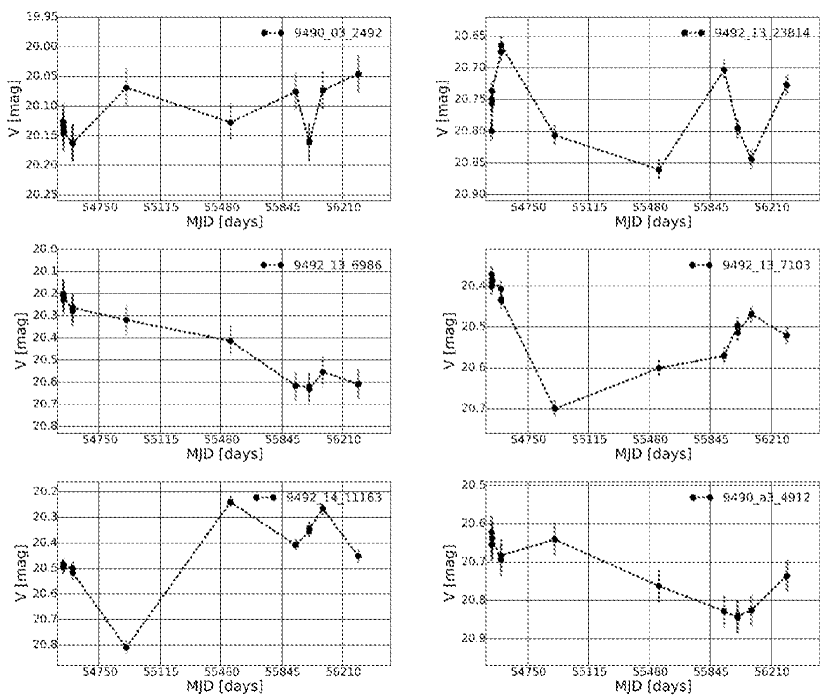
4.2 Intermediate-Type Variables
The -band light curves for the six variables with are shown in Figure 8. Our color criteria for the intermediate group could include supergiant Cepheids. To ensure that we have not re-identified any known Cepheids, we have cross-referenced the astrometry of the intermediate variables with the Shappee & Stanek (2011) catalog of M101 Cepheids and removed any matches.
The intermediate-type variables have photometric properties that overlap with the intermediate type supergiants and with LBVs at maximum light (Humphreys & Davidson, 1994). It is typical for A to F supergiants to exhibit variability on the order magnitudes known as Cygni variability (van Genderen & Sterken, 2002). LBVs can also exhibit Cygni variability, during an extended maximum, but with a higher amplitude ( magnitudes; van Genderen et al., 1997b, a). The variables presented here primarily exhibit Cygni variability typical of intermediate-type supergiants. However, 9492136986 and 94921311163 show larger amplitude variability on the order of 0.5 magnitudes. Furthermore, 94921311163 was brighter by 0.5 magnitudes in January 2003 from the HST/ACS catalog photometry compared with the March 2008 LBT -band magnitude. Without a spectrum, we cannot say with any certainty that these stars are not typical intermediate-type supergiants, however, their variability suggests they could be LBVs. Followup observations will be necessary for confirmation.
4.3 Cool Variables
Finally, we present the -band light curves (Figure 9) for the six stars which meet our variability criterion and have . This group very likely includes red supergiants and foreground K and M dwarfs. The stars in this group exhibit variability in the -band that is magnitudes in amplitude which is typical of K and M supergiants (Meynet et al., 2011, and references therein), but based on the analysis of Grammer & Humphreys (2013), it is likely that a large fraction of the cool variables are foreground. We present the light curves here, but defer the analysis to a future paper which will include the spectra.
5 Summary and Future Work
In this third paper on our survey of the massive star population in M101, we present the results of spectral classification and multicolor photometry of 50 of the visually brightest stars in the field and confirm that 31 are members of M101. It is not surprising that the majority are intermediate-type supergiants with A to F-type spectra since we selected the targets based on their visual apparent magnitude and variability. We present new photometry and light curves for three candidate LBVs, V2, V4 and V9 and identify a new candidate, 94921411998. Their spectra and variability confirm that they are LBV candidates and V9 may be in an LBV-like maximum light state or eruption. Followup spectra and continued photometric monitoring of these candidates will be necessary for confirmation and to determine the nature of their observed variability. We also discuss the light curves of 20 variables that lack spectroscopy. Four of these stars with large amplitude variability may be LBV candidates.
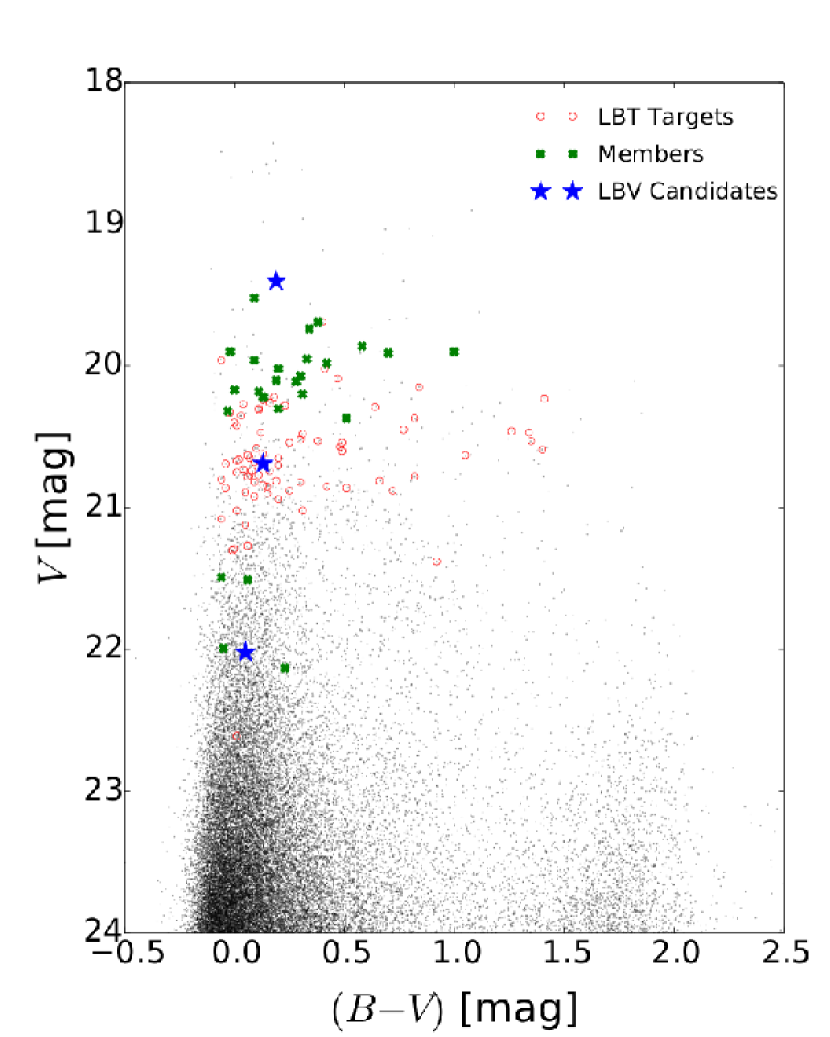
Figure 10 shows the observed color-magnitude diagram from Paper I with the confirmed members identified. The LBV candidates and the targets observe with the LBT are identified separately and the non-members have been removed.
Forty-six additional stars have been observed with the LBT/MODS. When the LBT/MODS reduction pipeline is completed, the addition of these stars including many of the variables will allow a more complete sampling of the upper HR Diagram in M101.
Appendix A Snaphot images
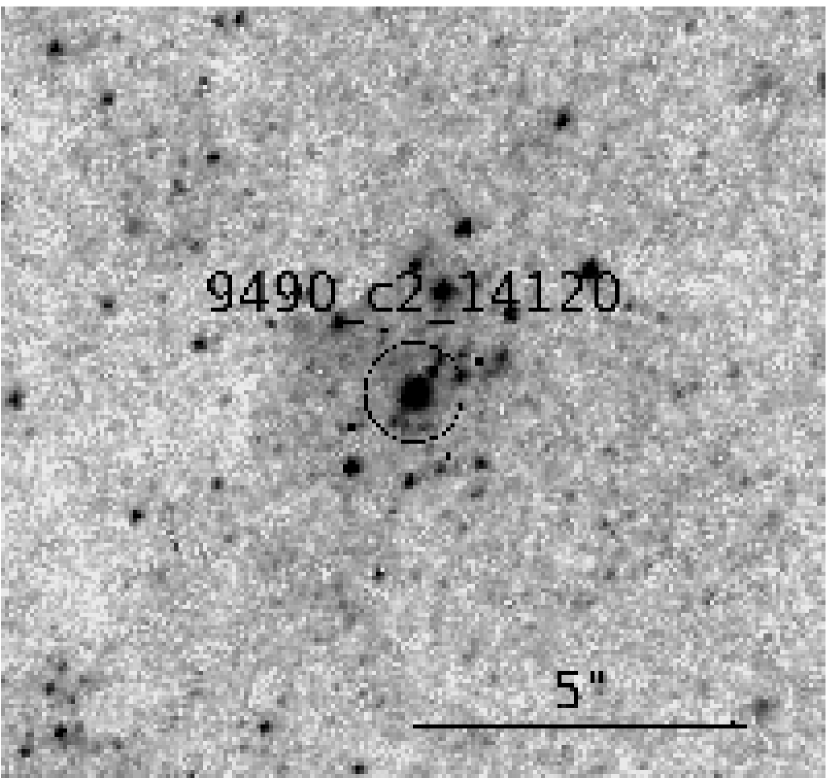
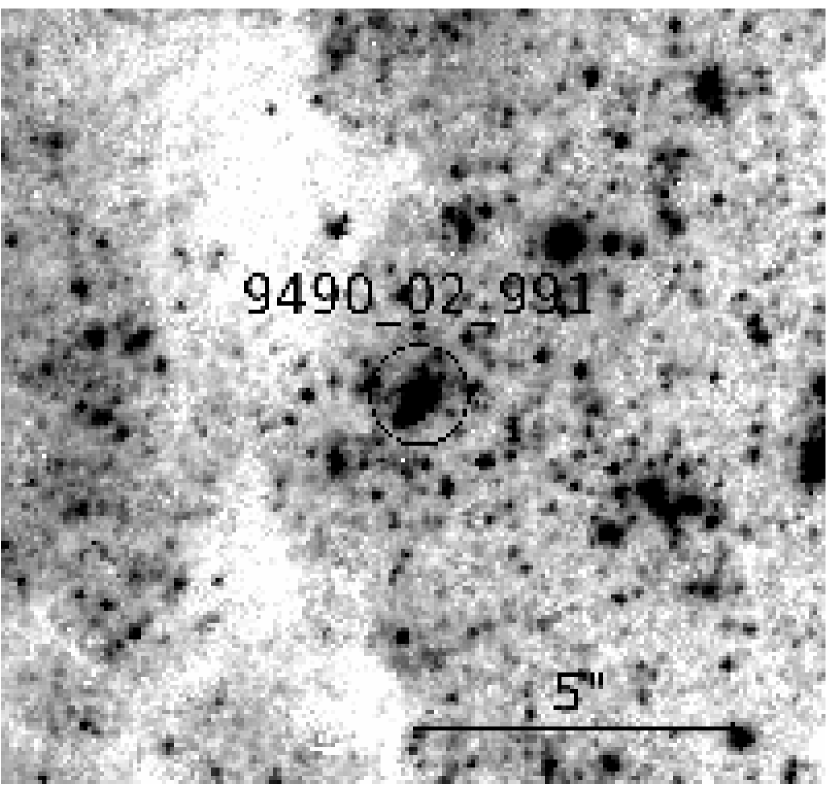
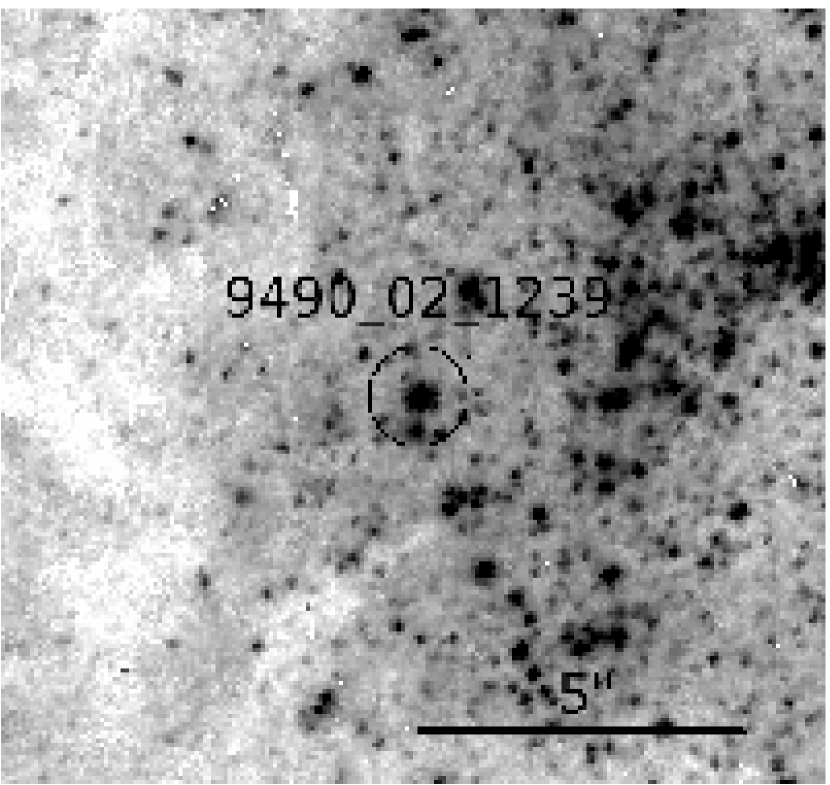
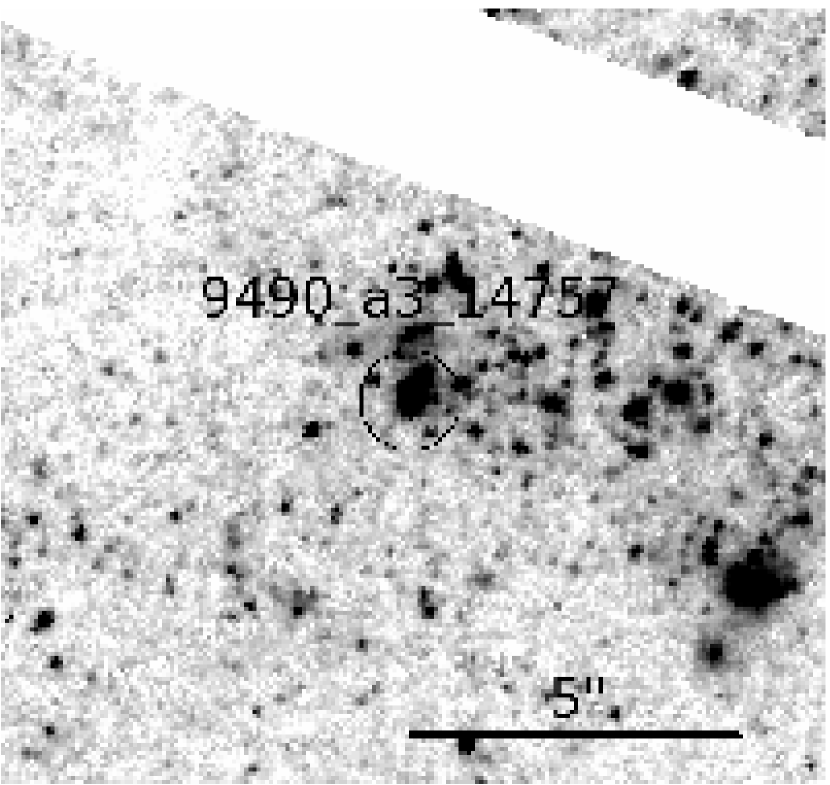
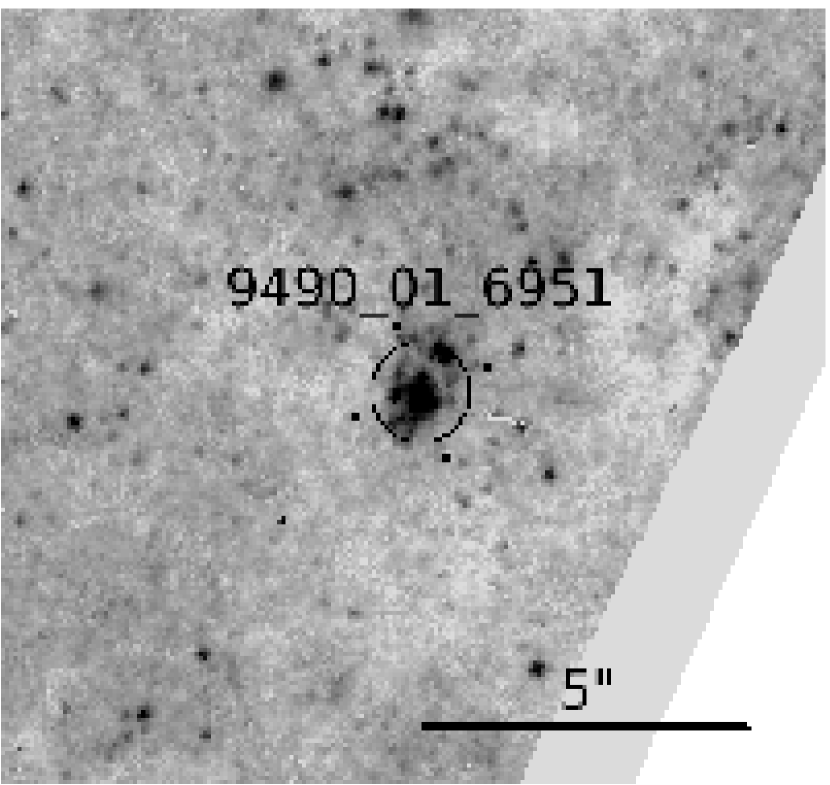
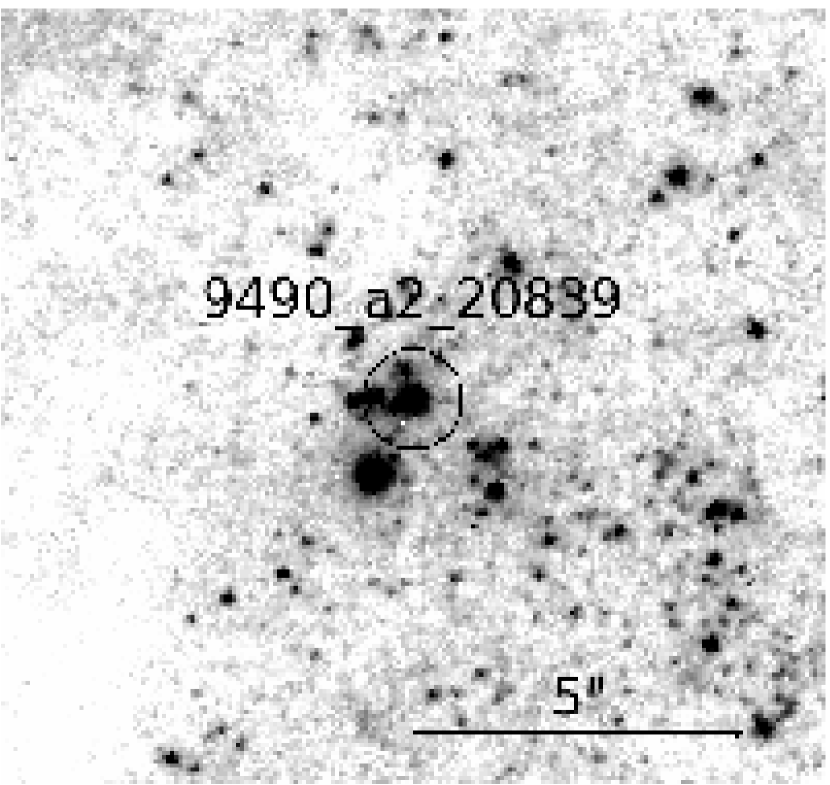
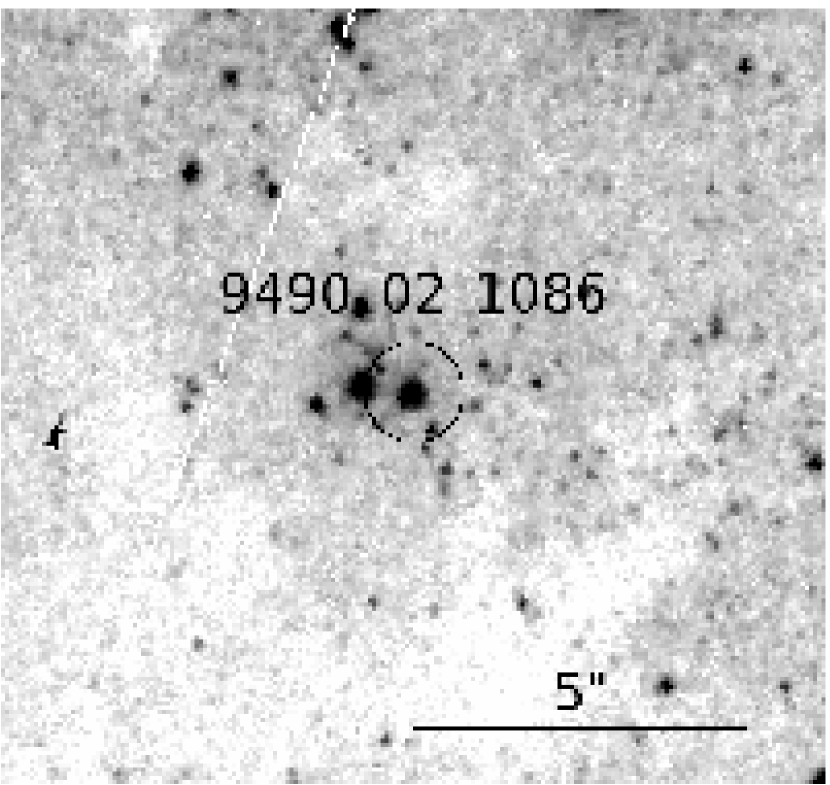
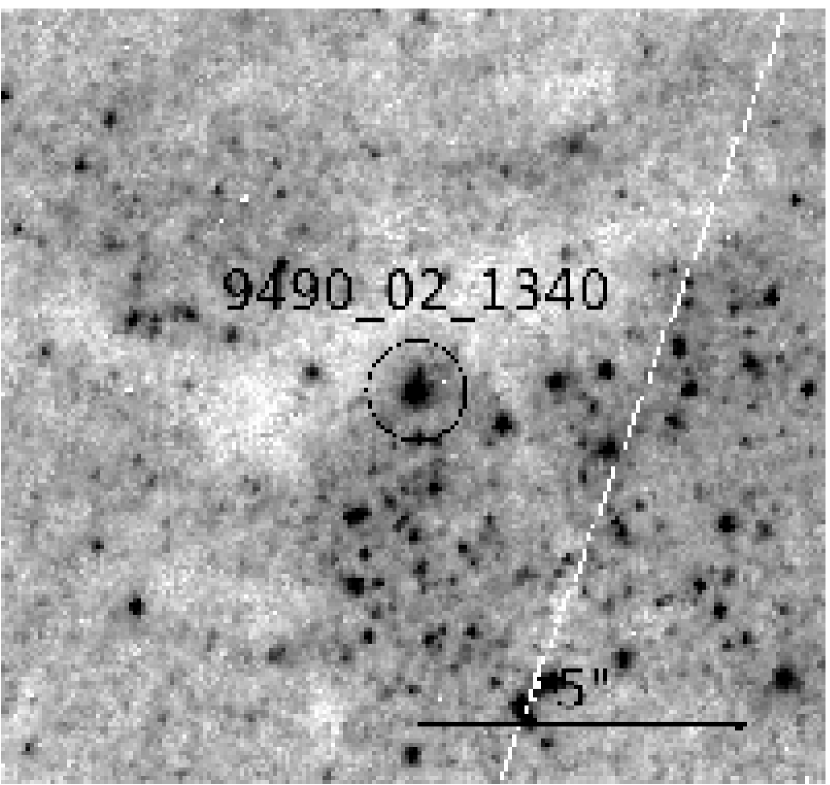
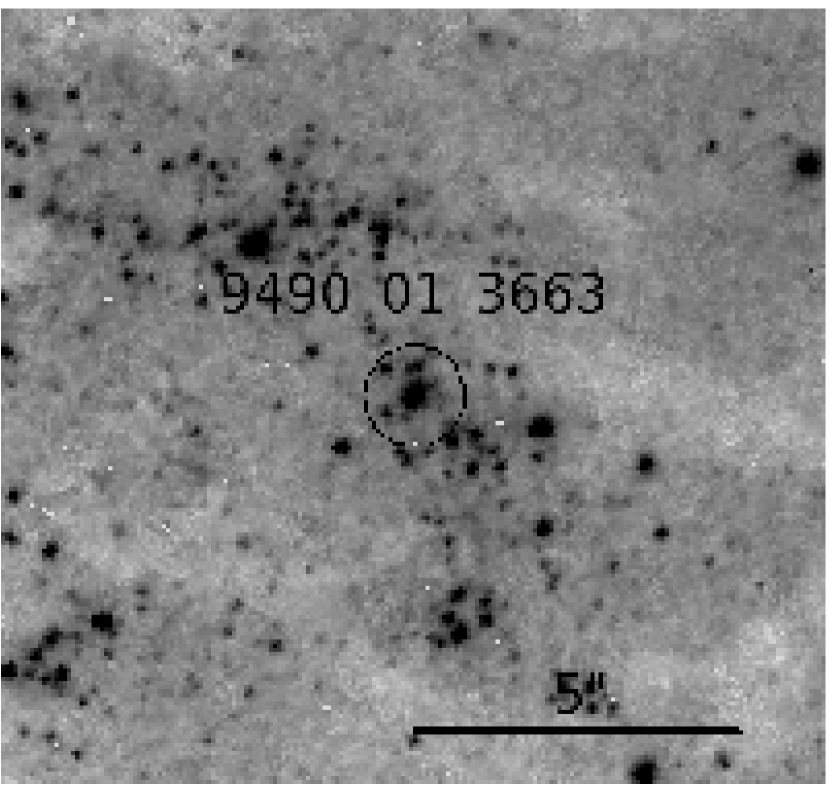
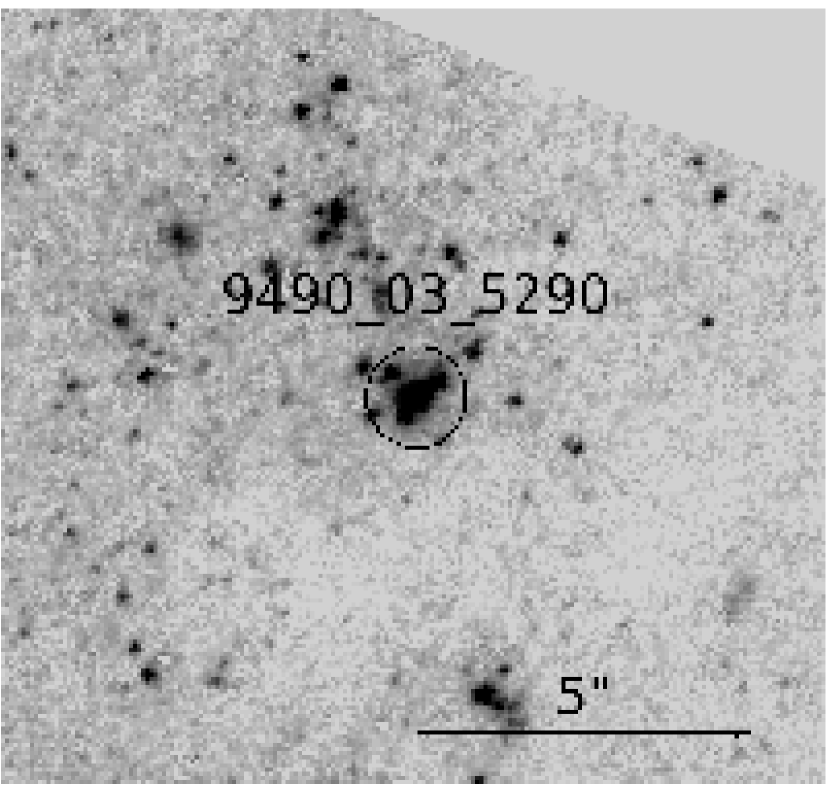
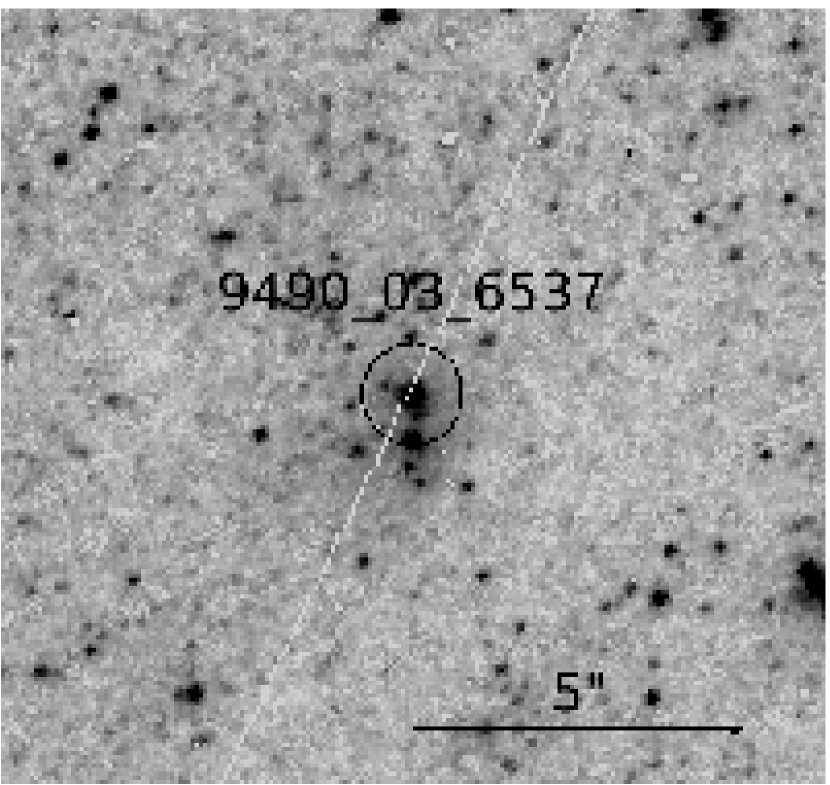
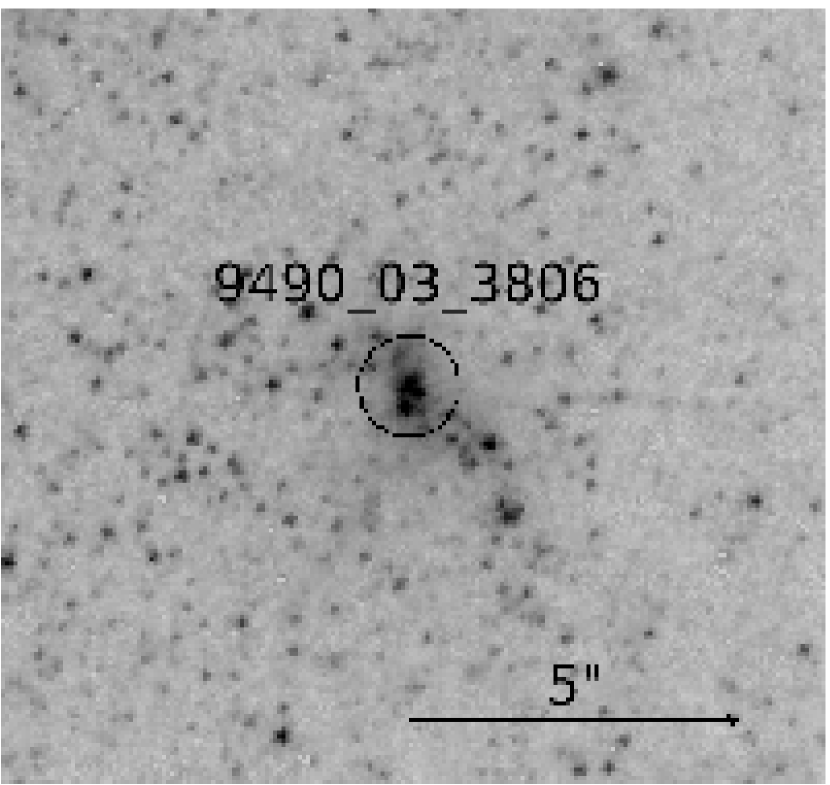
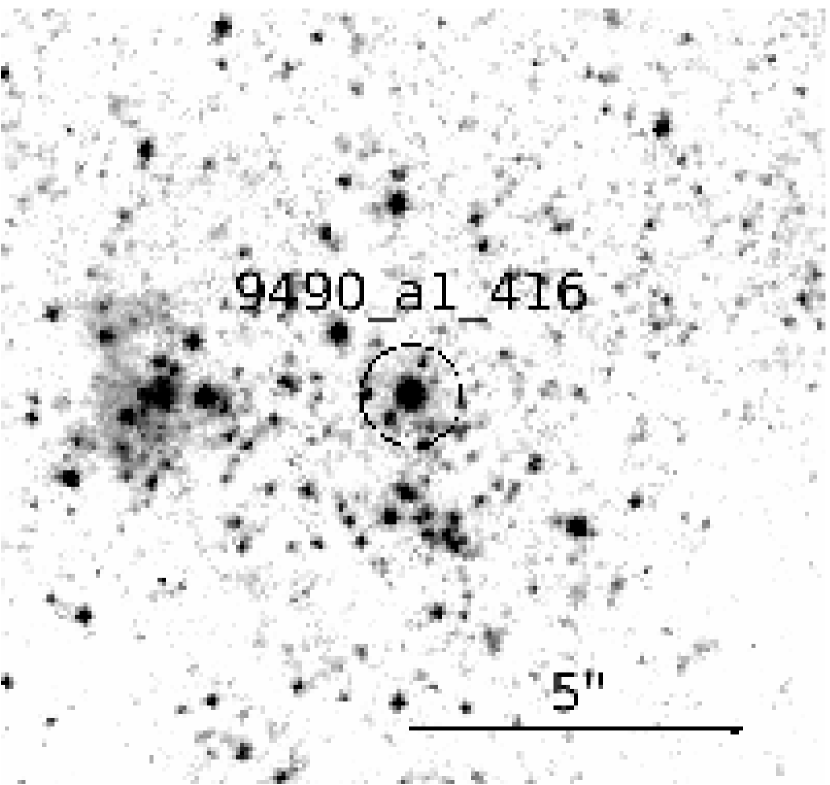
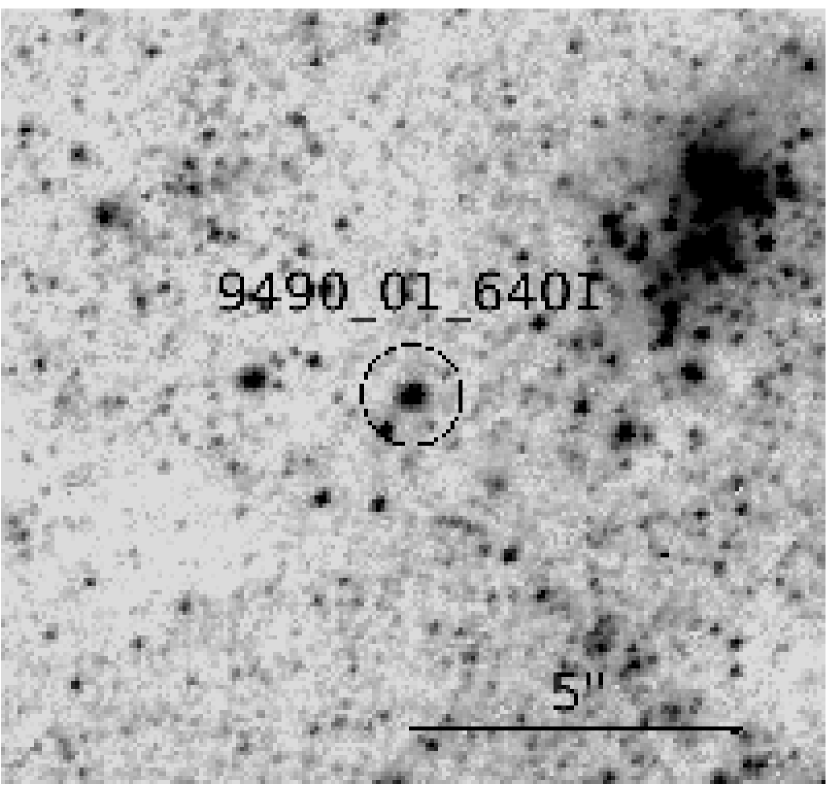
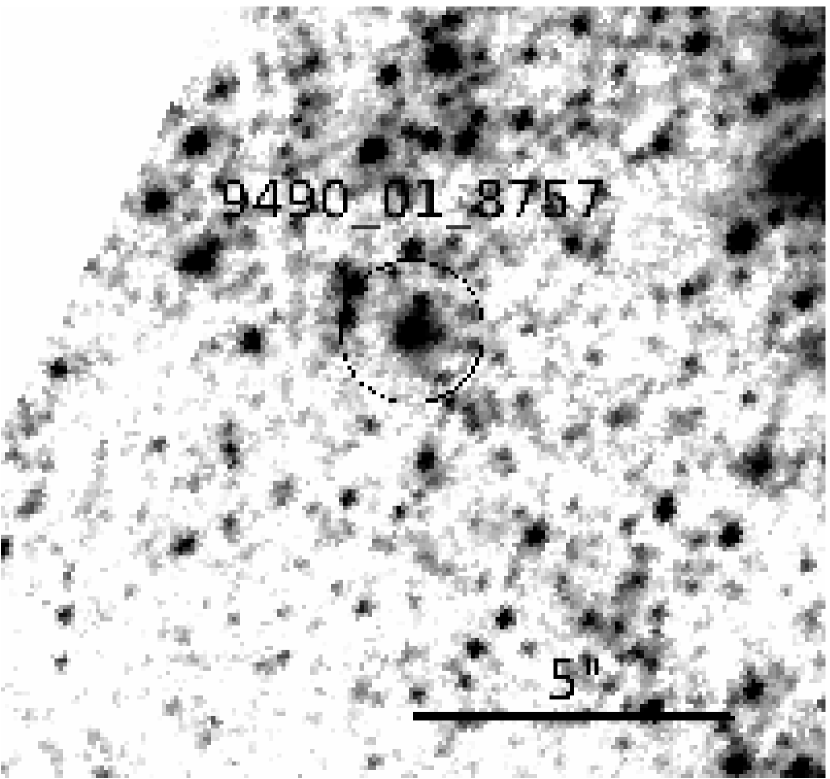
Snaphot images of 30 of the confirmed members from the HST/ACS F555W frame are shown here with a 15 diameter circle equal to the Hectospec aperture. At the distance of M101, this is 47 pc. The images are displayed in the same order as the stars in Table 1. There is no image for B4. The snapshots are displayed here in pairs to save space. In the published on-line paper thay will be separate and interested readers will be able to click on each for an enlarged view.


References
- Alard (2000) Alard, C. 2000, A&AS, 144, 363
- Bond (2011) Bond, H. E. 2011, ApJ, 737, 17
- Cardelli et al. (1989) Cardelli, J. A., Clayton, G. C., & Mathis, J. S. 1989, ApJ, 345, 245
- Crowther et al. (2006) Crowther, P. A., Lennon, D. J., & Walborn, N. R. 2006, A&A, 446, 279
- Dolphin (2000) Dolphin, A. E. 2000, PASP, 112, 1383
- Fabricant et al. (1998) Fabricant, D. G., Fata, R. G., & Epps, H. W. 1998, in Society of Photo-Optical Instrumentation Engineers (SPIE) Conference Series, Vol. 3355, Optical Astronomical Instrumentation, ed. S. D’Odorico, 232–241
- Flower (1977) Flower, P. J. 1977, A&A, 54, 31
- Flower (1996) Flower, P. J. 1996, ApJ, 469, 355
- Fraser et al. (2013) Fraser, M., et al. 2013, MNRAS, 433, 1312
- Gal-Yam & Leonard (2009) Gal-Yam, A. & Leonard, D. C. 2009, Nature, 458, 865
- Gal-Yam et al. (2007) Gal-Yam, A., et al. 2007, ApJ, 656, 37
- Gerke, Kochanek & Stanek (2014) Gerke, J. R., Kochanek, C. S. & Stanek, K. Z. 2014, MNRAS, submitted
- Giallongo et al. (2008) Giallongo, E., et al. 2008, A&A, 482, 349
- Grammer & Humphreys (2013) Grammer, S., & Humphreys, R. M. 2013, AJ, 146, 114
- Humphreys & Aaronson (1987) Humphreys, R. M., & Aaronson, M. 1987, AJ, 94, 1156
- Humphreys & Davidson (1994) Humphreys, R. M., & Davidson, K. 1994, PASP, 106, 1025
- Humphreys et al. (2013) Humphreys, R. M., Davidson, K., Grammer, S., Kneeland, N., Martin, J. C., Weis, K., & Burggraf, B. 2013, ApJ, 773, 46
- Humphreys et al. (1999) Humphreys, R. M., Davidson, K., & Smith, N. 1999, PASP, 111, 1124
- Humphreys et al. (2014) Humphreys, R. M., Weis, K., Davidson, K., Bomans, D. J., & Burggraf, B. 2014, ApJ, 790, 48
- Ivezić et al. (2007) Ivezić, Ž., et al. 2007, AJ, 134, 973
- Jordi et al. (2006) Jordi, K., Grebel, E. K., & Ammon, K. 2006, A&A, 460, 339
- Khan et al. (2010) Khan, R., Stanek, K. Z., Prieto, J. L., Kochanek, C. S., Thompson, T. A., & Beacom, J. F. 2010, ApJ, 715, 1094
- Kochanek et al. (2008) Kochanek, C. S., Beacom, J. F., Kistler, M. D., Prieto, J. L., Stanek, K. Z., Thompson, T. A., & Yüksel, H. 2008, ApJ, 684, 1336
- Lupton (1998) Lupton, W. 1998, in Society of Photo-Optical Instrumentation Engineers (SPIE) Conference Series, Vol. 3351, Telescope Control Systems III, ed. H. Lewis, 210–221
- Margutti et al. (2013) Margutti, R., et al. 2013, ArXiv e-prints
- Mauerhan et al. (2013) Mauerhan, J. C., et al. 2013, MNRAS, 430, 1801
- Meynet et al. (2011) Meynet, G., Georgy, C., Hirschi, R., Maeder, A., Massey, P., Przybilla, N., & Nieva, M.-F. 2011, Bulletin de la Societe Royale des Sciences de Liege, 80, 266
- Mokiem et al. (2007) Mokiem, M. R., et al. 2007, A&A, 465, 1003
- Pastorello et al. (2007) Pastorello, A., et al. 2007, Nature, 447, 829
- Pastorello et al. (2013) Pastorello, A., et al. 2013, ApJ, 767, 1
- Pogge et al. (2006) Pogge, R. W., et al. 2006, in Society of Photo-Optical Instrumentation Engineers (SPIE) Conference Series, Vol. 6269, Society of Photo-Optical Instrumentation Engineers (SPIE) Conference Series
- Sandage (1983) Sandage, A. 1983, AJ, 88, 1569
- Sandage & Tammann (1974) Sandage, A., & Tammann, G. A. 1974, ApJ, 194, 223
- Schlegel et al. (1998) Schlegel, D. J., Finkbeiner, D. P., & Davis, M. 1998, ApJ, 500, 525
- Shappee & Stanek (2011) Shappee, B. J., & Stanek, K. Z. 2011, ApJ, 733, 124
- Thompson et al. (2009) Thompson, T. A., Prieto, J. L., Stanek, K. Z., Kistler, M. D., Beacom, J. F., & Kochanek, C. S. 2009, ApJ, 705, 1364
- Van Dyk (2005) Van Dyk, S. D. 2005, in Astronomical Society of the Pacific Conference Series, Vol. 332, The Fate of the Most Massive Stars, ed. R. Humphreys & K. Stanek, 47
- Van Dyk & Matheson (2012) Van Dyk, S. D., & Matheson, T. 2012, in Astrophysics and Space Science Library, Vol. 384, Eta Carinae and the Supernova Impostors, ed. K. Davidson & R. M. Humphreys, 249
- van Genderen et al. (1997a) van Genderen, A. M., de Groot, M., & Sterken, C. 1997a, A&AS, 124, 517
- van Genderen & Sterken (2002) van Genderen, A. M., & Sterken, C. 2002, A&A, 386, 926
- van Genderen et al. (1997b) van Genderen, A. M., Sterken, C., & de Groot, M. 1997b, A&A, 318, 81
| Catalog ID | Star ID | Group | Variability | AV | Comments | ||||
|---|---|---|---|---|---|---|---|---|---|
| J140220.98+542004.38 | 94921411998 | 14:02:20.98 | 54:20:04.38 | 19.40 | 0.19 | LBV Cand. | P-Cyg H, He I; Fe II em.; see text, Figure 6 | ||
| J140227.30+541952.50 | 9492148847 | 14:02:27.30 | 54:19:52.50 | 19.69 | 0.38 | Im. SG | 0.2 | F5 I, see text, Figure 4 | |
| — | B4 | 14:02:27.89 | 54:16:18.43 | — | — | Em. Line | — | — | Em. Line; H II region, see textccDouble or split emission lines. |
| J140228.83+542014.03 | 94921414450 | 14:02:28.83 | 54:20:14.03 | 19.74 | 0.34 | Im. SG | 0.9 | Early A I; see textccDouble or split emission lines., Figure 4 | |
| — | V9 | 14:02:29.92 | 54:16:19.91 | — | — | LBV Cand. | — | See text, Figure 6 | |
| J140248.46+541935.80 | 9490c214120 | 14:02:48.46 | 54:19:35.80 | 20.10 | 0.19 | Im. SG | — | Late A I | |
| J140256.71+541834.09 | 949002152 | 14:02:56.71 | 54:18:34.09 | 20.30 | 0.20 | Im. SG | — | 0.2 | A5-F0 I |
| J140259.37+542323.89 | 9490a310940 | 14:02:59.37 | 54:23:23.89 | 21.49 | -0.06 | Em. Line | — | Of/WN; see text, Figure 5 | |
| J140301.84+541949.62 | 949002991 | 14:03:01.84 | 54:19:49.62 | 20.17 | 0.00 | Hot SG | — | 0.5 | early B-type, weak WN |
| J140302.61+542001.39 | 9490021239 | 14:03:02.61 | 54:20:01.28 | 20.02 | 0.20 | Im. SG | — | 0 | Early A I |
| J140304.70+541925.00 | 949002598 | 14:03:04.70 | 54:19:25.00 | 20.07 | 0.30 | Hot SG | — | 1.6 | early B I; see textccDouble or split emission lines., Figure 3 |
| J140305.13+542342.14 | 9490a314757 | 14:03:05.13 | 54:23:42.14 | 20.32 | -0.03 | Hot SG | — | 0.3 | early B + WN, double emission profiles |
| J140307.95+542326.81 | 9490a311594 | 14:03:07.95 | 54:23:26.81 | 21.51 | 0.06 | Hot SG | — | 0.8 | early B I; see textccDouble or split emission lines., Figure 3 |
| J140309.19+542138.77 | 9490016951 | 14:03:09.19 | 54:21:38.77 | 19.96 | 0.09 | Hot SG | — | 0.3 | late B:; weak WN feature; composite. spectrum |
| J140311.06+541830.96 | 9490a220839 | 14:03:11.06 | 54:18:30.96 | 19.95 | 0.33 | Im. SG | 0.7 | A5 I | |
| J140311.32+542518.55 | 9490036943 | 14:03:11.32 | 54:25:18.55 | 20.18 | 0.11 | Im. SG | — | 0.2 | early - mid AaaThe residual [O I] night sky lines in the red appear to have P Cygni profiles due to poor sky subtraction., see text, Figure 4 |
| J140313.44+541954.44 | 9490021086 | 14:03:13.44 | 54:19:54.44 | 19.90 | -0.02 | Hot SG | — | 0.1 | late B, H em, H double. |
| J140313.74+542004.56 | 9490021340 | 14:03:13.74 | 54:20:04.56 | 20.11 | 0.28 | Im. SG | — | 0.3 | F0-F2 I; H em. |
| J140314.80+541737.93 | B162 | 14:03:14.80 | 54:17:37.93 | 19.52 | 0.09 | Hot SG | — | 0.4 | B8 I; see text, Figure 3 |
| J140314.98+541645.26 | V4 | 14:03:14.98 | 54:16:45.26 | 22.02 | 0.05 | LBV Cand. | — | See text, Figure 6 | |
| J140316.64+542042.04 | 9490013663 | 14:03:16.64 | 54:20:42.04 | 21.99 | -0.05 | Hot SG | — | 0.1 | B5 I, H double |
| J140322.26+542437.69 | 9490035290 | 14:03:22.27 | 54:24:37.62 | 19.98 | 0.42 | Im. SG | — | 0.9 | A8 I |
| J140323.43+542504.84 | 9490036537 | 14:03:23.44 | 54:25:04.76 | 20.37 | 0.51 | Im. SG | — | 1.2 | Late A I |
| J140326.37+542411.63 | 9490033806 | 14:03:26.37 | 54:24:11.63 | 20.22 | 0.13 | Hot SG | — | Early B IccDouble or split emission lines.; weak WN feature | |
| J140328.35+541707.58 | 9490a1416 | 14:03:28.35 | 54:17:07.58 | 19.90 | 1.00 | Im. SG | — | F: I | |
| J140328.86+542128.94 | 9490a16401 | 14:03:28.86 | 54:21:28.94 | 19.91 | 0.70 | Im. SG | — | Late A I | |
| J140330.73+542335.77 | 9490031487 | 14:03:30.73 | 54:23:35.66 | 19.86 | 0.58 | Im. SG | — | A5 I | |
| — | 9490018757 | 14:03:32.28 | 54:22:09.19 | — | — | Im. SG | — | Late F IbbThe nebular [N II] and [S II] lines appear to have have P Cygni profiles due to poor background/sky substraction. | |
| J140332.78+542009.89 | 9490a17093 | 14:03:32.78 | 54:20:09.89 | 20.20 | 0.31 | Hot SG | — | Mid B: I; see textccDouble or split emission lines., Figure 3 | |
| J140332.88+542425.99 | V2 | 14:03:32.88 | 54:24:25.99 | 20.69 | 0.13 | LBV Cand. | — | See textccDouble or split emission lines., Figure 6 | |
| J140341.18+541905.30 | 9490b13762 | 14:03:41.18 | 54:19:05.30 | 22.13 | 0.23 | Em. Line | — | — | Strong WN feature, see textccDouble or split emission lines. |
| Catalog ID | Star ID | Variability | Spectral Type | ||||
|---|---|---|---|---|---|---|---|
| — | 9492125654 | 14:02:23.33 | 54:28:01.68 | — | — | M4 V | |
| — | 9490c212822 | 14:02:39.23 | 54:19:16.83 | — | — | K7 V | |
| J140243.90+541727.85 | B53 | 14:02:43.90 | 54:17:27.85 | 21.30 | 0.58 | — | F0-F2 III |
| J140247.62+541728.90 | 9490c21281 | 14:02:47.62 | 54:17:28.90 | 19.87 | 0.43 | — | Late-A |
| J140247.76+542833.56 | 94920925840 | 14:02:47.76 | 54:28:33.56 | 19.91 | 0.57 | F8 III/V | |
| — | 94920927729 | 14:02:48.88 | 54:28:48.76 | — | — | M2 V | |
| J140250.09+542138.09 | 9490022795 | 14:02:50.09 | 54:21:38.05 | 20.11 | 0.76 | G8 V | |
| J140301.20+541839.71 | B65 | 14:03:01.20 | 54:18:39.71 | 18.96 | 0.31 | — | Late A III |
| J140310.60+541809.18 | 9490a217826 | 14:03:10.60 | 54:18:09.18 | 22.45 | 0.47 | — | A3 V (WD) |
| J140312.62+542056.72 | 9490014552 | 14:03:12.62 | 54:20:56.72 | 19.56 | 0.34 | — | F2 III |
| J140318.13+542400.97 | 9490033062 | 14:03:18.13 | 54:24:00.97 | 19.04 | 0.69 | — | G5 V |
| — | 9490014409 | 14:03:31.38 | 54:20:53.67 | — | — | — | G4 V |
| J140335.25+542242.89 | 9490c13304 | 14:03:35.25 | 54:22:42.89 | 22.10 | 1.60 | M5 V | |
| — | 9490b221 | 14:03:36.93 | 54:14:18.72 | — | — | — | F8 V |
| J140342.55+541740.49 | 9490a11828 | 14:03:42.55 | 54:17:40.49 | 19.03 | 0.79 | F8 V | |
| — | 9490c11056 | 14:03:49.06 | 54:21:49.73 | — | — | M2 V | |
| — | 9490c13679 | 14:03:49.62 | 54:23:08.74 | — | — | M0 V | |
| — | 9490b111450 | 14:03:55.82 | 54:20:58.20 | — | — | — | M4 V |
| J140356.08+542149.39 | 9490c11033 | 14:03:56.08 | 54:21:49.32 | 19.08 | 0.90 | G8 V |
Note. — Spectroscopic targets observed with Hectospec on the MMT. Units of right ascension are hours, minutes, and seconds; units of declination are degrees, minutes, and seconds. Sources are sorted by increasing RA. The HST/ACS magnitudes, for recovered sources, are provided.
| Catalog ID | Star ID | Variability | LBT/MODS Field | ||||
|---|---|---|---|---|---|---|---|
| J140219.79+542315.29 | 9492137415 | 14:02:19.79 | 54:23:15.29 | 20.26 | 0.16 | ||
| J140219.85+542313.67 | 9492137103 | 14:02:19.85 | 54:23:13.67 | 20.37 | 0.82 | ||
| J140220.43+542313.06 | 9492136986 | 14:02:20.43 | 54:23:13.06 | 20.48 | 0.31 | Field 4 | |
| J140221.34+542333.72 | 94921311152 | 14:02:21.34 | 54:23:33.72 | 20.63 | 1.05 | Field 4 | |
| J140225.55+541917.18 | 9492141816 | 14:02:25.55 | 54:19:17.18 | 20.85 | 0.15 | — | Field 4 |
| J140226.24+541944.04 | 9492146605 | 14:02:26.24 | 54:19:44.04 | 20.68 | 0.09 | — | Field 4 |
| J140226.53+542335.74 | 94921311533 | 14:02:26.53 | 54:23:35.74 | 20.23 | 1.41 | Field 4 | |
| J140226.64+541948.25 | 9492147655 | 14:02:26.64 | 54:19:48.25 | 20.74 | 0.08 | — | |
| J140226.75+541945.84 | 9492147028 | 14:02:26.75 | 54:19:45.84 | 20.54 | 0.49 | — | |
| J140226.97+541951.38 | 9492148521 | 14:02:26.97 | 54:19:51.38 | 20.78 | 0.06 | — | |
| J140227.03+541947.64 | 9492147490 | 14:02:27.03 | 54:19:47.64 | 21.02 | 0.01 | — | |
| J140227.68+542619.32 | 949212961 | 14:02:27.68 | 54:26:19.32 | 20.94 | 0.20 | Field 4 | |
| J140231.47+542531.44 | 94921323814 | 14:02:31.47 | 54:25:31.44 | 20.78 | 0.82 | ||
| J140232.51+542001.39 | 94921411163 | 14:02:32.51 | 54:20:01.39 | 20.09 | 0.47 | ||
| J140234.99+542416.67 | 94921317081 | 14:02:34.99 | 54:24:16.67 | 20.53 | 1.35 | Field 4 | |
| — | 9492141739 | 14:02:39.24 | 54:19:16.77 | — | — | ||
| J140248.90+541840.10 | 9490c210368 | 14:02:48.90 | 54:18:40.10 | 20.74 | 0.16 | — | |
| J140249.10+541842.08 | 9490c210564 | 14:02:49.10 | 54:18:42.08 | 20.24 | 0.13 | — | |
| J140249.39+542359.14 | 9490b116197 | 14:02:49.39 | 54:23:59.14 | 21.02 | 0.31 | — | Field 3 |
| J140249.83+541924.17 | 9492093069 | 14:02:49.83 | 54:19:24.20 | 20.88 | 0.25 | — | Field 1 |
| J140250.63+542346.86 | 9490a315563 | 14:02:50.63 | 54:23:46.86 | 20.63 | 0.06 | — | Field 3 |
| J140251.11+542114.51 | 9490034663 | 14:02:51.11 | 54:21:14.51 | 20.60 | 0.49 | ||
| J140253.82+542319.14 | 9490a15661 | 14:02:53.82 | 54:23:19.14 | 20.86 | -0.04 | — | Field 3 |
| J140254.07+541942.89 | 949002867 | 14:02:54.07 | 54:19:42.89 | 20.73 | 0.04 | Field 1 | |
| J140256.45+541830.42 | 9490a2SF10 | 14:02:56.45 | 54:18:30.42 | 20.40 | 0.00 | — | Field 1 |
| J140257.81+541750.64 | 9490a31058 | 14:02:57.81 | 54:17:50.64 | 20.85 | 0.42 | — | Field 1 |
| J140258.34+541656.35 | 9490a27168 | 14:02:58.34 | 54:16:56.35 | 20.88 | 0.72 | — | Field 1 |
| J140258.67+542242.49 | 9490017533 | 14:02:58.67 | 54:22:42.49 | 20.77 | 0.11 | — | |
| 9490a16666 | 14:02:59.11 | 54:21:09.22 | — | — | |||
| — | 9490a321186 | 14:02:59.99 | 54:24:36.05 | — | — | Field 3 | |
| J140300.13+542156.52 | 9490023047 | 14:03:00.13 | 54:21:56.52 | 20.47 | 0.12 | — | |
| J140301.82+541514.87 | 9490a239 | 14:03:01.82 | 54:15:14.87 | 20.86 | 0.51 | — | Field 1 |
| J140302.00+542329.58 | 949210SF89 | 14:03:02.00 | 54:23:29.58 | 20.22 | 0.18 | Field 3 | |
| J140302.70+542308.88 | 949210SF162 | 14:03:02.70 | 54:23:08.88 | 21.38 | 0.92 | — | Field 3 |
| J140306.60+541924.56 | 949002584 | 14:03:06.60 | 54:19:24.56 | 20.68 | 0.14 | — | Field 1 |
| J140306.84+542147.95 | 9490022905 | 14:03:06.84 | 54:21:47.95 | 19.96 | -0.06 | — | |
| J140309.76+542330.52 | 9490a312519 | 14:03:09.76 | 54:23:30.52 | 20.35 | 0.03 | — | Field 3 |
| J140311.11+541623.59 | 9490a2SF112 | 14:03:11.11 | 54:16:23.59 | 21.12 | 0.05 | — | Field 1 |
| J140312.18+542006.40 | 9490021378 | 14:03:12.18 | 54:20:06.40 | 20.42 | 0.01 | — | |
| J140312.52+541752.55 | 9490a215263 | 14:03:12.52 | 54:17:52.55 | 20.92 | 0.09 | — | |
| J140312.62+541749.85 | 9490a214783 | 14:03:12.62 | 54:17:49.85 | 20.70 | 0.20 | Field 1 | |
| J140312.81+541732.17 | 9490a212011 | 14:03:12.81 | 54:17:32.17 | 20.84 | 0.13 | — | |
| J140315.13+542151.19 | 9490017652 | 14:03:15.13 | 54:21:51.19 | 20.62 | 0.13 | — | Field 3 |
| J140315.66+541907.72 | 9492105190 | 14:03:15.66 | 54:19:07.72 | 21.30 | -0.01 | — | Field 1 |
| J140316.03+541756.22 | 9490a215969 | 14:03:16.03 | 54:17:56.22 | 20.28 | 0.23 | Field 1 | |
| J140317.37+542506.89 | 9490036586 | 14:03:17.37 | 54:25:06.89 | 20.47 | 1.34 | Field 3 | |
| J140317.62+542332.53 | 949003SF55 | 14:03:17.62 | 54:23:32.53 | 21.27 | 0.06 | — | Field 3 |
| J140317.99+541712.08 | 9490a29284 | 14:03:17.99 | 54:17:12.02 | 21.29 | 0.00 | — | Field 1 |
| — | 9490a34912 | 14:03:19.25 | 54:21:49.12 | — | — | Field 3 | |
| J140320.92+541705.60 | 9490a28459 | 14:03:20.92 | 54:17:05.60 | 20.53 | 0.38 | ||
| J140321.42+542344.09 | 9490031988 | 14:03:21.42 | 54:23:44.09 | 20.46 | 1.26 | — | |
| J140321.81+542346.00 | 9490032120 | 14:03:21.81 | 54:23:46.00 | 20.31 | 0.11 | — | Field 3 |
| J140323.24+542042.68 | 9490a217072 | 14:03:23.24 | 54:20:42.68 | 20.82 | 0.30 | — | Field 2 |
| J140324.77+541726.74 | 9490a11294 | 14:03:24.77 | 54:17:26.74 | 20.90 | 0.15 | — | Field 1 |
| J140325.40+541939.04 | 9490a16386 | 14:03:25.40 | 54:19:39.04 | 20.59 | 1.40 | ||
| J140325.45+542522.94 | 9490037146 | 14:03:25.45 | 54:25:22.94 | 20.66 | 0.02 | Field 3 | |
| J140325.57+542353.02 | 9490032492 | 14:03:25.57 | 54:23:53.02 | 20.29 | 0.64 | Field 3 | |
| J140325.58+541957.65 | 9490011198 | 14:03:25.58 | 54:19:57.60 | 20.58 | 0.10 | Field 2 | |
| J140325.70+542514.88 | 9490036836 | 14:03:25.70 | 54:25:14.88 | 20.27 | 0.04 | Field 3 | |
| J140325.90+542420.88 | 9490034390 | 14:03:25.90 | 54:24:20.88 | 22.61 | 0.01 | — | Field 3 |
| J140325.98+542422.82 | 9490034520 | 14:03:25.98 | 54:24:22.82 | 20.02 | 0.41 | — | |
| J140326.19+541939.47 | 9490c11362 | 14:03:26.19 | 54:19:39.47 | 20.81 | 0.66 | — | Field 2 |
| J140326.21+542047.87 | 9490014031 | 14:03:26.21 | 54:20:47.87 | 20.67 | 0.01 | ||
| J140326.38+542411.30 | 9490022637 | 14:03:26.38 | 54:24:11.30 | 20.69 | -0.04 | — | Field 3 |
| J140326.45+542038.36 | 9490013379 | 14:03:26.45 | 54:20:38.36 | 20.65 | 0.07 | — | |
| J140327.03+542346.36 | 9490032142 | 14:03:27.03 | 54:23:46.36 | 21.08 | -0.06 | — | |
| J140327.10+542046.79 | 9490013977 | 14:03:27.10 | 54:20:46.79 | 20.82 | 0.09 | — | Field 2 |
| J140327.60+541846.80 | 9490a14198 | 14:03:27.60 | 54:18:46.80 | 20.75 | 0.01 | — | |
| J140327.67+542340.92 | 9490031822 | 14:03:27.67 | 54:23:40.92 | 19.69 | 0.40 | — | |
| J140327.71+541844.93 | 9490a14062 | 14:03:27.71 | 54:18:44.93 | 20.89 | 0.05 | — | |
| J140328.82+542458.03 | 9490036315 | 14:03:28.82 | 54:24:58.03 | 20.15 | 0.84 | ||
| J140329.43+541809.97 | 9490a37830 | 14:03:29.43 | 54:18:09.97 | 20.54 | 0.25 | — | |
| J140329.51+541712.23 | 9490a1627 | 14:03:29.51 | 54:17:12.23 | 20.81 | 0.19 | — | |
| J140330.07+541853.28 | 9490c11485 | 14:03:30.07 | 54:18:53.28 | 20.52 | 0.30 | Field 2 | |
| J140330.32+541954.19 | 949001991 | 14:03:30.32 | 54:19:54.19 | 20.80 | -0.06 | — | |
| J140330.61+542424.48 | 9490c22831 | 14:03:30.61 | 54:24:24.48 | 20.45 | 0.77 | Field 3 | |
| — | 9490b214 | 14:03:30.91 | 54:14:10.48 | — | — | — | |
| — | 9490b114323 | 14:03:32.13 | 54:22:00.47 | — | — | — | Field 2 |
| J140333.74+541854.61 | 9490a14710 | 14:03:33.74 | 54:18:54.61 | 20.57 | 0.48 | — | Field 2 |
| — | 9490b13388 | 14:03:40.92 | 54:19:02.68 | — | — | — | Field 2 |
| — | 9490033779 | 14:03:41.57 | 54:19:08.47 | — | — | ||
| J140342.85+542336.96 | 9490c14050 | 14:03:42.85 | 54:23:36.96 | 20.65 | 0.20 | ||
| J140346.10+541959.52 | 9490b18183 | 14:03:46.10 | 54:19:59.52 | 20.77 | 0.07 | — | Field 2 |
| — | 9490c11535 | 14:03:46.17 | 54:16:15.68 | — | — | ||
| — | 9490c13069 | 14:03:47.38 | 54:22:29.50 | — | — | ||
| — | 9490c13679 | 14:03:49.63 | 54:23:8.74 | — | — | ||
| J140351.93+542152.78 | 9490c11292 | 14:03:51.93 | 54:21:52.78 | 20.33 | -0.02 | — | |
| J140355.88+542229.46 | 9490c13067 | 14:03:55.88 | 54:22:29.46 | 20.30 | 0.11 | — |