CEA, Centre d’Etudes de Saclay, DSM/IRAMIS/Service de Physique de l’Etat Condensé and CNRS UMR 3680, 91191 Gif-sur-Yvette, France
Strongly correlated electron systems Antiferromagnetic materials Mössbauer spectroscopy
Enhanced conduction band density of states in intermetallic EuTSi3 (T=Rh, Ir)
Abstract
We report on the physical properties of single crystalline EuRhSi3 and polycrystalline EuIrSi3, inferred from magnetisation, electrical transport, heat capacity and 151Eu Mössbauer spectroscopy. These previously known compounds crystallise in the tetragonal BaNiSn3-type structure. The single crystal magnetisation in EuRhSi3 has a strongly anisotropic behaviour at 2 K with a spin-flop field of 13 T, and we present a model of these magnetic properties which allows the exchange constants to be determined. In both compounds, specific heat shows the presence of a cascade of two close transitions near 50 K, and the 151Eu Mössbauer spectra demonstrate that the intermediate phase has an incommensurate amplitude modulated structure. We find anomalously large values, with respect to other members of the series, for the RKKY Néel temperature, for the spin-flop field (13 T), for the spin-wave gap ( 20-25 K) inferred from both resistivity and specific heat data, for the spin-disorder resistivity in EuRhSi3 ( Ohm.cm) and for the saturated hyperfine field (52 T). We show that all these quantities depend on the electronic density of states at the Fermi level, implying that the latter must be strongly enhanced in these two materials. EuIrSi3 exhibits a giant magnetoresistance ratio, with values exceeding 600% at 2 K in a field of 14 T.
pacs:
71.27.+apacs:
75.50.Eepacs:
76.80.+y1 Introduction
Divalent-Eu intermetallic compounds order magnetically due to the indirect RKKY exchange interaction [1] between the Eu 4f-spins. Several Eu-based compounds with composition EuTX3, where T is a -transition element and X = Si or Ge, crystallizing in the non-centrosymmetric BaNiSn3-type structure are known. Of these, the magnetic properties of EuPtSi3 [2], EuPtGe3 [3], EuPdGe3 [4] and EuNiGe3 [5, 6] have recently been reported in the literature in single crystal samples. In these materials, an anisotropic behaviour of the 2 K magnetisation seems to be the prerequisite for the existence of a cascade of close transitions, around 15 K: a transition from the paramagnetic to an incommensurate, moment modulated antiferromagnetic (AF) state occurs first, followed by another one to a single moment regular AF state, a few K below. This is the case for EuPtSi3 and EuNiGe3, whereas EuPtGe3 shows a unique transition and an isotropic behaviour of the magnetisation.
Here, we report on the magnetic properties of iso-structural EuTSi3 (T=Rh and Ir) compounds, with a single crystal sample for EuRhSi3 only. An early Mössbauer spectroscopy study of these two compounds was performed in Ref.[7]. We show that these two materials belong to the “transition cascade” type, with an anisotropic behaviour of the magnetisation documented for EuRhSi3. We present in addition specific heat, transport and 151Eu Mössbauer spectroscopy data. We find that the magnetic and transport properties in these two materials are notably enhanced with respect to those in other members of the series, and we show that this enhancement can be attributed to an unusually large density of conduction electron states at the Fermi level . As a remarkable result, the values of the spin-wave gap derived from such different techniques as resistivity, specific heat and single crystal magnetisation measurements are in good agreement.
2 Experimental
Polycrystalline samples of EuIrSi3 and EuRhSi3 were prepared by melting Eu (99.9% purity), Ir/Rh (99.99%) and Si (99.999%) in an arc furnace under an inert argon atmosphere. Single crystal growth of the two Eu compounds was tried using Sn and In as flux and following the same protocol as reported in Refs.[2, 3]. Powder-diffraction spectra were recorded on a Phillips Pan-analytical set up using Cu- radiation. The magnetisation as a function of field (up to 16 T) and temperature (1.8 to 300 K) was measured using Quantum Design MPMS and VSM magnetometers. The electrical resistivity between 1.8 and 300 K in zero and applied fields, and the heat capacity were measured in a Quantum Design PPMS set-up. 151Eu Mössbauer spectra were recorded at various temperatures using a commercial 151SmF3 source mounted on a constant acceleration spectrometer.
3 Results and Discussion
3.1 Structure
Our attempt to grow single crystals succeeded only for EuRhSi3, with In as flux. Powder diffraction spectra of EuIrSi3 and EuRhSi3 could be indexed on the basis of the BaNiSn3 type structure (space group ). The lattice parameters obtained by the Rietveld analysis of the powder diffraction spectra are in good agreement with the previously reported values [7].
3.2 Susceptibility and isothermal magnetisation
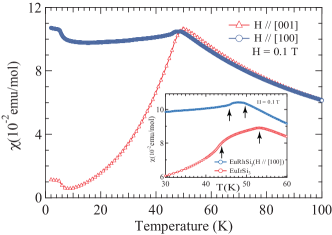
The susceptibility of EuRhSi3 measured in a field of 0.1 T applied along [001] and [100] is shown below 60 K in Fig.1. It is strongly anisotropic and a clear peak near 49 K shows the onset of the AF phase. The close-up in the inset of Fig.1 shows that this peak is split (arrows). In agreement with the heat capacity and 151Eu Mössbauer data (vide infra), these two peaks correspond to closely spaced magnetic transitions near 48 and 46 K. The susceptibility at high temperature (not shown) is nearly isotropic and a fit of the 1/ data to a Curie-Weiss law furnishes effective moments =7.39 and 7.52 and paramagnetic Curie temperature 11 and 14 K for H along [001] and [100] respectively. These effective moments are lower than the free ion value of 7.94 expected for Eu2+ (, ), which is due either to the presence of residual In-flux or to a slight Eu off-stoichiometry, corresponding to about 10 at.% Eu deficit. As to polycrystalline EuIrSi3, its susceptibility is shown between 30 and 60 K in the inset of Fig.1: two anomalies (arrows) are also present, near 52 and 43 K, witnessing the same phenomenon as in EuRhSi3. The value is 17 K, while =7.7 is closer to the Eu2+free ion value.
The Néel temperature in intermetallic compounds is the result of the indirect RKKY exchange between spins S mediated by the -conduction electron coupling with constant :
| (1) |
where s is the conduction electron spin density, and it has the form: [1]. Its value in these materials, near 50 K, is much larger than in other members of the series ( K), pointing to an enhanced value of .
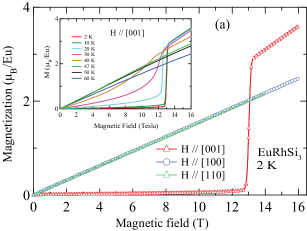
The isothermal magnetisation versus field scan at 2 K in EuRhSi3, shown in Fig.2(a), is a textbook example of an antiferromagnet with the tetragonal [001] c-axis as the easy axis of magnetisation and the (001) -plane as the hard plane, in line with the susceptibility data of Fig.1. For [001], an unusually large spin-flop field of 13 T is observed. A linear extension of the magnetisation curves for both field directions up to a saturation moment value = 7 yields large spin-flip fields H28 T and H41 T. The latter is larger since the field aligns the moments in the hard magnetic plane. In the standard molecular field theory [8], one has: H=2(HHa) and H=2(HHa), where He and Ha are respectively the exchange and the “anisotropy” field, the latter being defined as H where is the anisotropy energy density. Then we obtain He=17 T and Ha=3.35 T, and the critical spin-flop field Hcr = 2 = 13.5 T, in very good agreement with experiment. The spin-flop field in EuRhSi3 is much larger than in EuNiGe3 [6] (2-3 T), a logical consequence of a large He linked to the high value.
In the inset of Fig.2(a) are plotted the magnetisation curves along the easy axis at higher temperature. On heating, the spin-flop field decreases and the jump at the spin-flop broadens.
3.3 Modeling
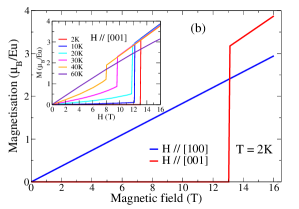
However, such a simple model as described above cannot account for the quite different values of and , and the oscillatory nature of the RKKY exchange compels one to introduce at least two different exchange integrals. Therefore, we use a numerical self-consistent calculation which has been described thoroughly in Ref.[6]: i) the infinite range dipolar interaction is added, ii) two exchange integrals (intra-plane first neighbor) and (interplane first neighbor) for the centered tetragonal structure are considered, as well as exchange anisotropy, and iii) the single ion crystalline anisotropy is described by a term , where =c. We also assume a magnetic structure made of ferromagnetic (ab) planes () coupled antiferromagnetically along c (), i.e. a propagation vector k=[001]. To obtain a first estimation of the exchange constants, the molecular field equations linking and with and are used [5, 6], yielding: =1.1 K and 0.88 K. We have taken =60 K (see the section about Mössbauer spectroscopy) and a mean value 13 K. Figure 2(b) shows the curves which reproduce best the experimental data, with a small exchange anisotropy: =0.8 K, =1.1 K, 0.7 K, 0.9 K and a crystalline anisotropy parameter 0.85 K. The model yields =57 K and =6 and 17 K for [001] and [100] respectively (experimental values 11 and 14 K resp.). At 30 K and above, the model cannot exactly reproduce the smoothing of the spin-flop transition (see inset of Fig.2(b)).
3.4 Electrical resistivity
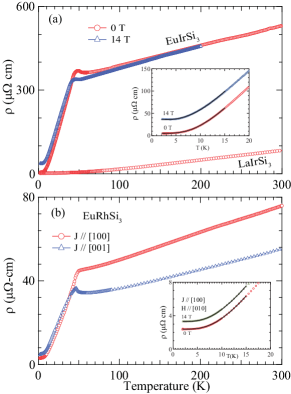
The electrical resistivity of EuIrSi3 and EuRhSi3 (and of non-magnetic LaIrSi3) is shown in Figs.3(a) and (b). Above TN it varies almost linearly up to 300 K in both compounds due to phonon scattering. It shows a small upturn at the magnetic transitions, likely caused by antiferromagnetic fluctuations just above and decreases rapidly on cooling due to a strong depletion in the spin-disorder scattering in the magnetically ordered state. One striking feature is that the resistivity of polycrystalline EuIrSi3 is one order of magnitude larger than that of single crystal EuRhSi3. We reckon that this is probably due to strong grain boundary scattering which enhances the resistivity of the polycrystalline sample. The residual resistivity is lower than 10 Ohm.cm in both materials (see Table 1), indicating they are chemically well ordered.
The total spin disorder resistivity , estimated as , amounts to about 35 Ohm.cm in EuRhSi3 while it is of the order of a few Ohm.cm in the other compounds of the series [2, 3, 6]. Since [1], its enhanced value in EuRhSi3 is in line with a stronger .
In the AF phase below 20 K, magnon scattering is the dominant mechanism for resistivity. With an antiferromagnetic spin wave dispersion relation:
| (2) |
where is the anisotropy gap and the spin-wave stiffness, the electrical resistivity in zero field for is given by [9]:
| ) | ) | ||
|---|---|---|---|
| EuRhSi3 | 5.1 | 0.04 | 23.3 |
| EuIrSi3 | 5.27 | 0.43 | 25.2 |
where a material dependent constant. Equation (3.4) provides a good fit to the zero field data in both compounds between 1.8 and 15 K (and also for a 14 T field), as shown by the solid lines in the insets of Fig.3. In EuIrSi3, the zero field spin wave gap is 25.2 K and it is 23.5 K in EuRhSi3. The AF spin wave gap is linked to the exchange and anisotropy fields He and Ha by the relation [10]:
| (4) |
Using the values determined above in EuRhSi3: He=17 T, Ha=3.35 T and =2, one obtains = 22.1 K, in excellent agreement with experiment in this material and close to the value in EuIrSi3.
At a field of 14 T, increases to 35.9 cm in EuIrSi3 and to 9 cm in EuRhSi3 for [100] and [001].
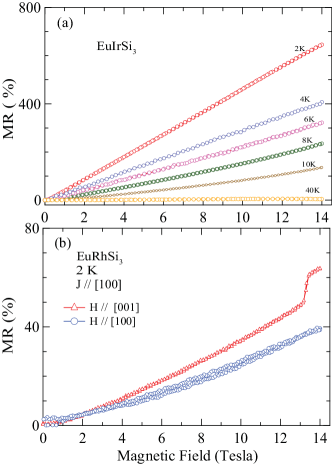
The significant increase of with field corresponds to a positive magnetoresistance ratio , defined as , as expected for antiferromagnets [11, 12]. The plots of at selected temperatures in EuIrSi3 are shown in Fig.4(a). It reaches giant values: at 14 T, it exceeds 100% at 10 K and it reaches 600% at 2 K. At higher temperatures (not shown), decreases and becomes negative near 47 K, shows an absolute minimum near 50 K and has a small residual value of 3% at 200 K, far above . In EuRhSi3, the is lower, as shown in Fig.4(b) at 2 K for [100] and [001] and [100]. A small positive jump in the occurs for [001] at the spin-flop field (13 T), although the is expected to drop to a small (positive) value above the spin-flop field, according to the molecular field calculation in Ref.[11].
3.5 Heat capacity
The main panels of Fig.5 show the heat capacity of EuIrSi3 and EuRhSi3 together with that of the non-magnetic La-reference. The two plots show two major peaks at 51.8 and 43.1 K in EuIrSi3 and at 48.3 and 45.8 K in EuRhSi3 in close correspondence with the anomalies seen in the susceptibility data, thus confirming the occurrence of two magnetic transitions in these two compounds. The jump in the heat capacity at the higher transition temperature is approximately 9.5 and 12 J/mol.K in the Ir and Rh-compound, respectively, which is lower than the value =20.14 J/mol.K for an equal moment antiferromagnetic transition for =7/2 ions in the mean field model, and closer to that predicted for an amplitude modulated structure (2/3 ) [2, 13]. This suggests that at occurs a transition to a modulated moment structure. The transition from this intermediate structure to an equal moment structure takes place at . This behaviour is confirmed by the 151Eu Mösbauer spectra recorded at few selected temperatures.
Deep in the AF phase, the specific heat should be the sum of 3 terms [14]:
where the first linear term is the conduction electron heat capacity, the second is the phonon contribution and the third the magnon heat capacity corresponding to a dispersion law given by Eq.(2) with a gap . Equation (3.5) provides a good fit of the data between 1.8 and 10 K, shown by the solid line in the insets of Figs.5(a) and (b). For EuIrSi3, the best fit estimates of and are 30.5 mJ/mol.K2 and 22.9 K respectively. The gap value is very close to that inferred from the resistivity data (25.2 K), which lends credibility to our analysis. In the case of EuRhSi3, one obtains: = 40.3 mJ/mol.K2 and =17.6 K, the latter value somewhat lower than the resistivity derived value (23.3 K). It may be noted that the Sommerfeld coefficient is an order of magnitude larger than in -metals, and even larger than in many -metal alloys. The Sommerfeld coefficient is expressed as [10]: , and its large value must be related to an enhanced .
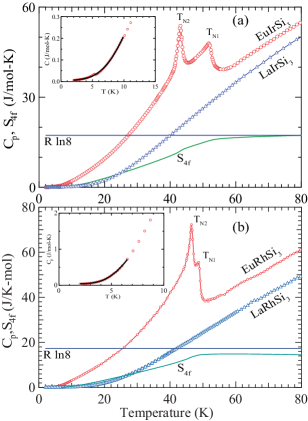
The entropy associated with the magnetic ordering was estimated by integrating , where was obtained by subtraction from of both the normalized heat capacity of LaTSi3, taking into account the slight difference in the atomic masses of Eu and La, and the large conduction electron contribution . It is seen that attains the expected value of (for = 7/2 Eu2+ ions) close to in both compounds.
3.6 151Eu Mössbauer spectra
The Mössbauer spectra on the isotope 151Eu in EuIrSi3 are shown in Fig.6 in the two temperature ranges defined as phase I (43.1 K) and phase II (43.1 K T 51.8 K). Spectra in EuRhSi3 are similar. The spectrum at 4.2 K is a standard hyperfine field pattern characteristic of Eu2+ (=7/2, =0), with an isomer shift relative to EuF3 of 7.92(5) mm/s which matches well with the value reported in Ref.[7]. This spectrum presents the peculiarity of a very high hyperfine field Hhf (4.2 K) = 52.6(3) T (51.6 T in EuRhSi3). This high value can be explained by the large prevailing in these materials. Indeed, in magnetically ordered intermetallic materials with the =0 ion Eu2+, the hyperfine field is solely due to the spin polarisation of the -type electrons at the nucleus site. It can be expressed as [15]: , where the first term is the core polarisation field proportional to the Eu2+ moment and worth T at saturation [16]. The second term Hce is due to the conduction electron spin polarisation induced by the shell through exchange and is given approximately by [15]: , where is a hyperfine constant. Acording to Eqn.(1), the effective field on s is: , and introducing the Pauli susceptibility: , one obtains:
| (6) |
In most Eu2+ intermetallic materials and in the other members of the series, the saturated hyperfine field amounts to about 30 T, i.e. Hce is negative and worth a few T. In EuIrSi3 and EuRhSi3, due to the enhanced value, Hce is much larger (18 T) and happens to be positive. The same situation holds in EuFe4P12, which presents the largest hyperfine field ever measured with 151Eu (67 T), implying H33 T [17].
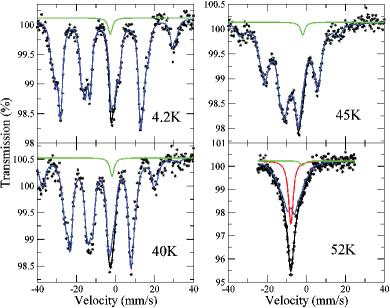
Whereas the spectra in phase I (below 43 K) show the presence of a unique hyperfine field, and hence of a unique Eu2+ magnetic moment, there occurs a sudden change of the spectral shape above 43 K, i.e. when entering phase II, where the spectra can be fitted to an incommensurate modulation of hyperfine fields [18]. The latter is well described by the first 3 odd harmonics of a Fourier series:
| (7) |
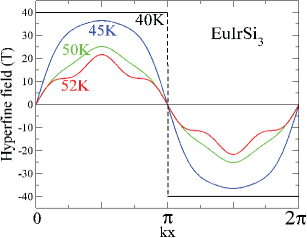
where is the propagation vector of the modulation and the distance along . The three coefficients , and were fitted to the spectral shape at each temperature to obtain the modulation profiles shown in Fig.7. The modulation becomes more “squared” as temperature decreases and approaches the transition to the incommensurate phase.
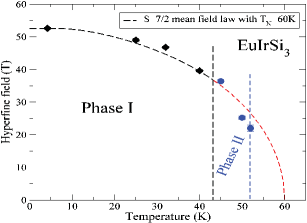
The thermal variation of the hyperfine field is plotted in Fig.8. In phase I, the hyperfine field values approximately follow a mean field law for =7/2, in line with its proportionality to the Eu2+ moment derived above. The transition temperature of this mean field law (60 K) does not correspond to the actual Néel temperature because of the presence of the commensurate - incommensurate transition at 43.1 K and of the first-order character of the transition to the paramagnetic phase at 51.8 K (see spectrum at 52 K in Fig.6).
4 Conclusion
.
The whole set of our thermodynamic and spectroscopic measurements in the two divalent Eu intermetallics EuIrSi3 and EuRhSi3 can be coherently and qualitatively interpreted by assuming a high density of electronic band states at the Fermi energy, which sets them apart from the other members of the EuTX3 family. We attribute the observed enhanced values to a large rather than to an anomalously large -conduction electron coupling since the Sommerfeld coefficient does not involve and there is a priori no reason for the stable Eu2+ shell to be prone to strong hybridisation with the conduction band. The two compounds present a cascade of magnetic transitions near 50 K, from a paramagnetic to an incommensurate modulated, then to a commensurate antiferromagnetic phase. In the EuRhSi3 single crystal sample, we could evidence an important anisotropy of the magnetisation, confirming the link between these two phenomena.
References
- [1] \Namesee for instance Freeman A. J. \BookMagnetic properties of rare earth metals, Chap.6 \EditorElliott R. J., Plenum Press, London and New York, 1972.
- [2] \NameKumar N., Dhar S. K., Thamizhavel A., Bonville P. Manfrinetti P. \REVIEWPhys. Rev. B812010144414.
- [3] \NameKumar N., Das P. K., Kulkarni R., Thamizhavel A., Dhar S. K. Bonville P. \REVIEWJ. Phys.: Condens. Matter242012036005.
- [4] \NameBednarchuk O., Gagor A. Kaczorowski D. \REVIEWJ. Alloys Comp.6222015432.
- [5] \NameGoetsch R. J., Anand V. K. Johnston D. C. \REVIEWPhys. Rev. B872013064406.
- [6] \NameMaurya A., Bonville P., Thamizhavel A. Dhar S. K. \REVIEWJ. Phys.: Condens. Matter872013064406.
- [7] \NameChevalier B., Coey J. M. D., Lioret B. Etourneau J. \REVIEWJ. Phys. C: Solid State Phys.1919864521.
- [8] \NameHerpin A. \BookThéorie du Magnétisme \EditorPresses Universitaires de France, Paris, France(1968)
- [9] \NameFontes M. B., Trochez J. C., Giordanengo B., Bud’ko S. L., Sanchez D. R., Baggio-Saitovitch E. M. Continentino M. A. \REVIEWPhys. Rev. B6019996781
- [10] \NameKittel C. \BookQuantum theory of solids \EditorJohn Wiley and Sons, New-York(1964)
- [11] \NameYamada H. Takada S. \REVIEWProgr. Theor. Phys.4919731401
- [12] \NameMcEwen K. A. \BookHandbook on the Physics and Chemistry of rare Earths, p.411 \EditorGschneider K. A. Eyring L., North-Holland, Amsterdam,1978
- [13] \NameBlanco J. A., Gignoux D. Schmitt D. \REVIEWPhys. Rev. B43199113145
- [14] \NameContinentino M. A., de Medeiros S. N.,Orlando M. T. D., Fontes M. B. Baggio-Saitovitch E. M. \REVIEWPhys. Rev. B642001012404
- [15] \NameBleaney B. \BookMagnetic properties of rare earth metals, Chap.8 \EditorElliott R. J., Plenum Press, London and New York, 1972
- [16] \NameNowik I., Dunlap B. D. Wernick J. H. \REVIEWPhys. Rev. B81973238
- [17] \NameGérard A., Grandjean F., Hodges J. A., Braun D. J. Jeitschko W. \REVIEWJ. Phys. C: Solid State Phys.1619832797
- [18] \NameBonville P., Hodges J. A., Shirakawa M., Kasaya M. Schmitt D. \REVIEWEur. Phys. J. B212001349