1\Yearpublication2014\Yearsubmission2014\Month11\Volume999\Issue88
New spectroscopic and polarimetric observations of the A0 supergiant HD 92207††thanks: Based on observations collected with the CORALIE echelle spectrograph mounted on the 1.2-m Swiss telescope at La Silla Observatory, data obtained at the European Southern Observatory (ESO Prg. 092.D-0209(A), and data obtained from the ESO Science Archive Facility under request MSCHOELLER 102067).
Abstract
Our recent search for the presence of a magnetic field in the bright early A-type supergiant HD 92207 using FORS 2 in spectropolarimetric mode revealed the presence of a longitudinal magnetic field of the order of a few hundred Gauss. However, the definite confirmation of the magnetic nature of this object remained pending due to the detection of short-term spectral variability probably affecting the position of line profiles in left- and right-hand polarized spectra. We present new magnetic field measurements of HD 92207 obtained on three different epochs in 2013 and 2014 using FORS 2 in spectropolarimetric mode. A 3 detection of the mean longitudinal magnetic field using the entire spectrum, G, was achieved in observations obtained in 2014 January. At this epoch, the position of the spectral lines appeared stable. Our analysis of spectral line shapes recorded in opposite circularly polarized light, i.e. in light with opposite sense of rotation, reveals that line profiles in the light polarized in a certain direction appear slightly split. The mechanism causing such a behaviour in the circularly polarized light is currently unknown. Trying to settle the issue of short-term variability, we searched for changes in the spectral line profiles on a time scale of 8–10 min using HARPS polarimetric spectra and on a time scale of 3–4 min using time series obtained with the CORALIE spectrograph. No significant variability was detected on these time scales during the epochs studied.
keywords:
stars: early-type – techniques: polarimetric — stars: individual: HD 92207 – stars: atmospheres — stars: magnetic fields — stars: variables: general1 Introduction
Our recent search for the presence of a magnetic field in the visually brightest early A-type supergiant HD 92207, using FORS 2 in spectropolarimetric mode, revealed the presence of a weak mean longitudinal magnetic field of the order of a few hundred Gauss (Hubrig et al. [2012]). This target has been monitored for several years in the -Strömgren system by Sterken ([1983]) and spectroscopically by Kaufer et al. ([1996, 1997]), who found cyclical changes of the brightness and substantial profile changes for metal lines and H, and suggested that the observed photometric and H line variations are the result of a corotating structure in the wind, which they considered to be in the star’s equatorial plane. Furthermore, their study of the line profile variations revealed clear pulsation-like structures, indicating the presence of non-radial pulsations (NRPs) with a period of 27 days, while the stellar rotation period is of the order of several months. Ignace et al. ([2009]) measured linear polarization in the spectra of this star on seven different nights, spanning approximately three months in time. For the continuum polarization, the spiral-shaped wind density enhancement in the equatorial plane of the star suggested by Kaufer et al. ([1996]) was explored. Importantly, the authors reported that the polarization across the H line on any given night is typically different from the degree and position angle of the polarization in the continuum. These night-to-night variations in the H polarization are hard to understand in terms of the spiral structure that was considered for the continuum polarization. The determination of the atmospheric parameters was carried out by Przybilla et al. ([2006]), who also established elemental abundances for over 20 chemical species.
In the subsequent spectropolarimetric study on this target, Hubrig et al. ([2014]) presented a careful inspection of the FORS 2 spectra used for the magnetic field determination in HD 92207 and reported the detection of short-term spectral variability on a time-scale of minutes or fractions of minutes. In the framework of that study, the authors convincingly showed the absence of instrument instabilities or flexures, presenting significantly stable spectral line profiles for a number of other stars observed quasi-simultaneously and nearby in the sky to HD 92207. However, with the available data, it was not possible to decide whether the discovered variations in line profiles of HD 92207 were of periodic or stochastic nature. In any case, given the size of the supergiant, it was clear that the variability could not be referred to coherent line variations across the entire surface on such short time-scales. Hubrig et al. ([2014]) estimated the length of the rotation period as d.
The question how pulsations affect the magnetic field measurements is not yet solved in spite of the fact that the number of studies of pulsating Cephei and slowly pulsating B (SPB) stars is gradually increasing. Already in [2006], Schnerr et al. discussed the influence of pulsations on the analysis of the magnetic field strength in the Cephei star Eri in MUSICOS spectra and tried to model the signatures found in Stokes and spectra. Although the authors wrote that using some modeling they were able to quantitatively establish the influence of pulsations on the magnetic field determination, they still detected profiles in Stokes and that were the result of the combined effects of the pulsations and the inaccuracies in wavelength calibration that were not removed by their imperfect modeling of these effects.
Clearly, it is not possible to use the low-resolution FORS 2 spectra to model the effect of pulsations on the magnetic field measurements, and the potential of high-resolution spectropolarimetric observations should be used in the search of short-term variations (e.g. Hubrig et al. [2011a]). On the other hand, it is possible that the degree with which pulsations impact the magnetic field measurements is time-dependent, e.g., if the line variability on short time scales were more or less pronounced at certain rotation phases. To investigate this possibility, we re-observed HD 92207 with FORS 2 on three different epochs in December 2013, January 2014, and February 2014 in the framework of the ESO Programme 092.D-0209(A).
In this study, we discuss the new magnetic field measurements of HD 92207. In addition, we present the results of our analysis of HARPS archival spectropolarimetric daat and of our search for short-term variability using time series with the CORALIE spectrograph installed at the Swiss 1.2-m Euler telescope on La Silla Observatory, Chile.
2 Measurements of the magnetic field using FORS 2 observations
2.1 Observations and data reduction
Three new spectropolarimetric observations of HD 92207 were carried out in service mode at the European Southern Observatory with FORS 2 mounted on the 8-m Antu telescope of the VLT from 2013 December 4 to 2014 February 14. This multi-mode instrument is equipped with polarization analyzing optics, comprising super-achromatic half-wave and quarter-wave phase retarder plates, and a Wollaston prism with a beam divergence of 22 in standard resolution mode.
Polarimetric spectra were obtained with the GRISM 600B and the narrowest slit width of 04 to achieve a spectral resolving power of . The use of the mosaic detector with a pixel size of 15 m allowed us to cover a spectral range from 3250 to 6215 Å, which includes all hydrogen Balmer lines from H to the Balmer jump.
From the raw FORS 2 data, the spectra recorded in left- and right-hand polarized light, i.e. the ordinary and extraordinary beams are extracted using a pipeline written in the MIDAS environment by T. Szeifert, the very first FORS instrument scientist. This pipeline reduction by default includes background subtraction. A single wavelength calibration frame is used for each night.
A first description of the assessment of the longitudinal magnetic field measurements using FORS 1/2 spectropolarimetric observations was presented in our previous work (e.g. Hubrig et al. [2004a, 2004b], and references therein).
To minimize the cross-talk effect, a sequence of subexposures at the retarder position angles 45∘+45∘, +45∘45∘, 45∘+45∘, etc. is usually executed during observations and the spectrum is calculated using:
| (1) |
where +45∘ and 45∘ indicate the position angle of the retarder waveplate and and are the ordinary and extraordinary beams, respectively. Rectification of the spectra was performed in the way described by Hubrig et al. ([2014]). Null profiles, , are calculated as pairwise differences from all available profiles. From these, 3-outliers are identified and used to clip the profiles. This removes spurious signals, which mostly come from cosmic rays, and also reduces the noise. A full description of the updated data reduction and analysis will be presented in a separate paper (Schöller et al., in preparation).
The mean longitudinal magnetic field, , is measured on the rectified and clipped spectra based on the relation
| (2) |
where is the Stokes parameter that measures the circular polarization, is the intensity in the unpolarized spectrum, is the effective Landé factor, is the electron charge, is the wavelength, is the electron mass, is the speed of light, is the wavelength derivative of Stokes , and is the mean longitudinal (line-of-sight) magnetic field.
The magnetic field is usually measured in two ways: using only the absorption hydrogen Balmer lines or using the entire spectrum including all available absorption lines in the spectra. The Landé factor is assumed to be 1.0 in the spectral regions containing hydrogen lines and it is slightly larger (1.25) in the spectral regions outside the hydrogen lines.
The feasibility of longitudinal magnetic field measurements in massive stars using low-resolution spectropolarimetric observations was demonstrated by previous studies of O and B-type stars (e.g., Hubrig et al. [2006, 2008, 2009, 2011a, 2011b, 2013a]). The mean longitudinal magnetic field is defined by the slope of the weighted linear regression line through the measured data points, where the weight of each data point is given by the squared signal-to-noise ratio of the Stokes spectrum. The formal error of is obtained from the standard relations for weighted linear regression. This error is inversely proportional to the rms signal-to-noise ratio of Stokes . Finally, the factor is applied to the error determined from the linear regression, if larger than 1. No significant fields were detected in the null spectra calculated by combining the subexposures in such a way that polarization cancels out. This allows us to verify that no spurious signals are present in the data.
| MJD | [G] | [G] | S/N | ||
|---|---|---|---|---|---|
| 56630.308 | 64 | 93 | 132 | 238 | 680 |
| 56672.104 | 104 | 34 | 231 | 148 | 2056 |
| 56702.159 | 152 | 61 | 201 | 120 | 1675 |
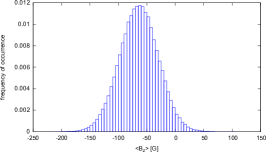
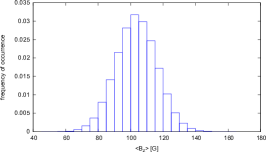
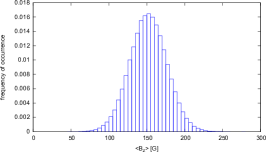
Furthermore, we have carried out Monte Carlo bootstrapping tests. These are most often applied with the purpose of deriving robust estimates of standard errors. In these tests, we randomly generate 250 000 samples from the original data that have the same size as the original data set and analyse the distribution of the determined from all these newly generated data sets. The measurement uncertainties obtained before and after Monte Carlo bootstrapping tests were found to be in close agreement, indicating the absence of reduction flaws. Distributions from our Monte Carlo bootstrapping tests for the data sets of HD 92207 from the three different epochs are presented in Fig. 1. The results of our magnetic field measurements along with the information related to the modified Julian date and the signal-to-noise ratio in the observed spectra are listed in Table 1. A magnetic field at a significance level of 3 was achieved during observations on 2014 January 15. We also find a change of polarity of the field between the observations obtained in 2013 December and 2014 January.
2.2 Variability
As has already been reported in the work by Hubrig et al. ([2014]), the previous analysis of FORS 2 polarimetric spectra clearly showed the presence of short-term spectral variability on time scales of the order of minutes and less. Along with radial velocity shifts up to 30 km s-1 detected for lines belonging to different elements, the authors also detected notable changes in line intensities up to 3%. Other stars observed during the same night, also directly after the observations of HD 92207 at the same air mass and with similar short exposure times did not exhibit a similar kind of variability, indicating that spectral variability of HD 92207 was not introduced by imperfection of the instrument. Hubrig et al. ([2014]) concluded that the detected spectral variability is intrinsic, but with the current data, it can not be decided, if the variations are of periodic or stochastic nature.
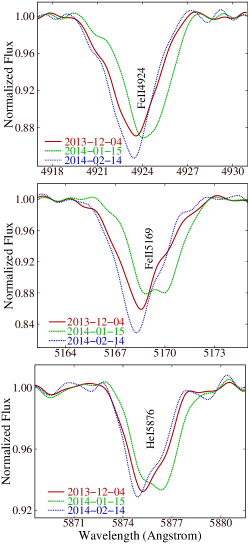
In our recent spectropolarimetric observations of HD 92207 with FORS 2, the Stokes profile shape of spectral lines changes from one epoch to the next. The differences in the line behaviour are illustrated in Fig. 2, where we display as an example the behaviour of the Fe ii 4924, Fe ii 5169, and He i 5876 lines with Landé factors 1.7, 1.3, and 1.0, respectively. An interesting fact observed in the spectra obtained in 2014 January, i.e. at the epoch when the longitudinal magnetic field is detected at a significance level of 3, is that the lines Fe ii 5169 and He i 5876 appear slightly split. To try to understand the character of the spectral variability of HD 92207 in FORS 2 spectra on a short time scale and its impact on our measurements of the longitudinal magnetic field, we decided to investigate the behaviour of the line profile in left- and right-hand circular polarized light, i.e. in ordinary and extraordinary beams obtained at the retarder waveplate positions +45∘ and 45∘, respectively. Such a study appears reasonable since in the presence of a non-zero longitudinal magnetic field, due to the Zeeman effect, the line profiles display a radial velocity shift or/and a different profile shape.
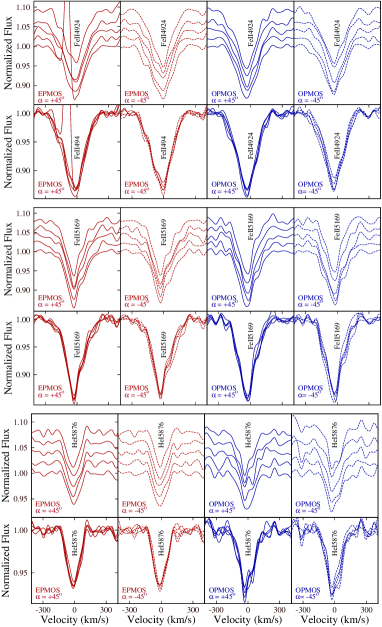
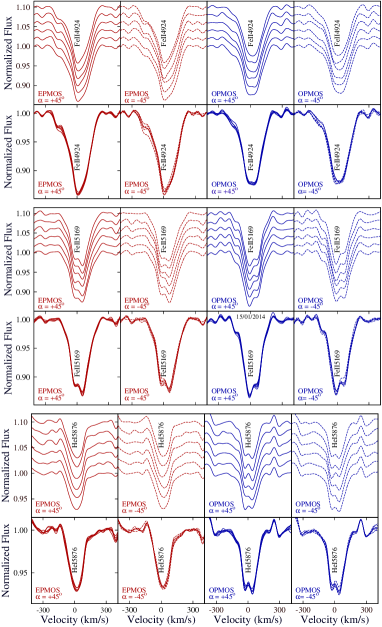
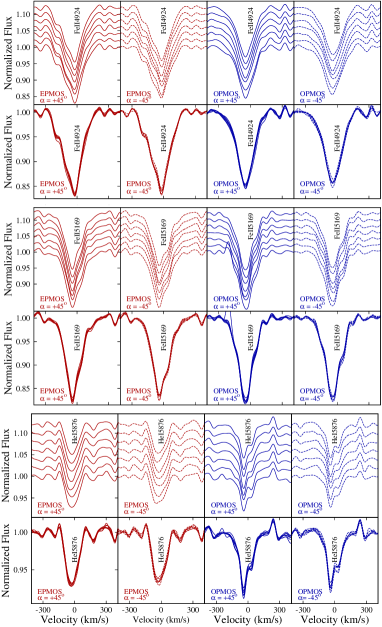
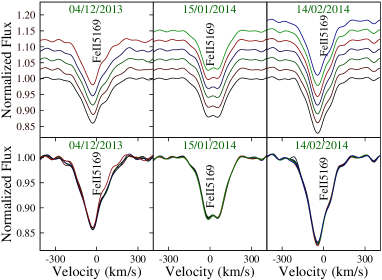
As we already mentioned above, for spectropolarimetric observations with FORS 2, a sequence of subexposures at the retarder position angles 45∘+45∘, +45∘45∘, 45∘+45∘, etc., is usually executed during observations. Ten subexposures with an exposure time of 2 sec were obtained in 2013 December, whereas twelve subexposures with an exposure time of 4 sec were taken in 2014 January, and fourteen subexposures with an exposure time of 10 sec were taken in 2014 February. In Figs. 3–5, we present the behaviour of line profiles in the ordinary and extraordinary beams at each epoch. In the presented figures, the ordinary and extraordinary beams are labeled as OPMOS and EPMOS, respectively. Please note that a spectrum from an ordinary beam at an angle of 45∘ corresponds to a spectrum from an extraordinary beam at an angle of +45∘, and vice versa. The differences seen on Figs. 3–5 between the corresponding beams are due to an imperfect wavelength calibration and are cancelling out in the spectrum, after the application of Eq. 1.
No significant variation between the line profile shapes in the ordinary and extraordinary beams are observed in FORS 2 polarimetric spectra obtained in 2013 December. At this epoch, no significant longitudinal magnetic field was detected. In contrast, in 2014 January, the line profiles in opposite circularly polarized light exhibit remarkable differences: the line profiles of all three lines in the ordinary beams appear slightly split. The line Fe ii 5169 exhibits split profiles also in the extraordinary beam, but the shape of the line profile is different compared to that observed in the ordinary beams. At that epoch, we measure a longitudinal magnetic field at a significance level of 3. In 2014 February, the profiles of the Fe ii 4924 and Fe ii 5169 lines in both ordinary and extraordinary beams appear similar, and the Fe ii 5169 line profile shows a small distortion in the red wing. However, the behaviour of the He i 5876 line is different, indicating the presence of a small splitting in the profile shape observed in the ordinary beams. At this epoch, a longitudinal magnetic field is measured at a significance level of 2.5.
The detected behaviour of the line profile in opposite circularly polarized light has not been reported before. The inspection of the previous FORS 2 spectropolarimetric observations discussed in the work by Hubrig et al. ([2014]) revealed that also in the observations obtained at MJD 55936.341 the lines Fe ii 4924 and He i 5876 show a similar splitting in both ordinary and extraordinary beams, while the line Fe ii 5169 does not show any splitting. No splitting in any line is detected on the dates MJD55688.168 and MJD56018.223. Since apart from the three lines discussed above, only very few other Fe ii lines show similar split line profile shapes, we can conclude that the detected splitting is not a result of an imperfect data reduction. The interesting fact is that the lines Fe ii 4924 and Fe ii 5169 belong to multiplet 42. Lines of this multiplet present the principle emission lines observed in individual classes of emission objects, among them Oe-, Be-, and P Cygni-stars. However, the third member of this multiplet, the line Fe ii 5018, was not found split in any FORS 2 spectropolarimetric observation.
We have currently no explanation for the appearance of the line splitting observed in the polarized line profiles. We note that since previously only very few searches for the presence of magnetic fields in a small number of early A-type supergiants were conducted, mostly using least-squares deconvolution i.e. without any presentation of individual line profiles in opposite circular polarization (e.g., Verdugo et al. [2005]), the necessary expertise for any well-founded explanation of the observed behaviour is missing. On the other hand, given the size and the shape of the splitting, it is obvious that the splitting is not related to the Zeeman splitting frequently observed in slowly rotating Ap and Bp stars with strong magnetic fields. It is also likely that such a splitting can not be related to the appearance of emission in the line cores since the observed H line in the FORS 2 spectra does not appear in emission on any of the three epochs. Noteworthy, we are not able to inspect the behaviour of the H line in our spectra, as it is located outside of the spectral range available with our FORS 2 setting. Further, it is also not clear whether any kind of pulsation would affect polarized profiles causing the appearance of the line splitting in polarized light.
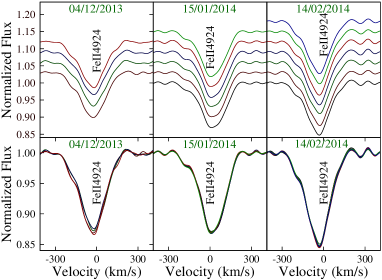
Hubrig et al. ([2014]) reported the presence of radial velocity shifts of up to 30 km s-1 and changes in line intensities of up to 3%. Variations of the line profiles in Stokes spectra with radial velocities reaching 10–20 km s-1 are observed in the line profiles recorded in 2013 December and 2014 February, while during the observations in 2014 January the line profiles appear significantly stable with measured radial velocity shifts below 3 km s-1. In all observed spectra is the intensity variation below 2% and mostly caused by a stronger noise in the line cores. These results indicate that the short-term spectral variability most likely does not have any significant impact on our magnetic field measurements using the spectra obtained in 2014 January. As an example, we present in Fig. 6 overplotted Stokes profiles of the Fe ii 4924 and Fe ii 5169 lines in each individual subexposure on all three epochs. The shifts of individual line profiles appear in general substantially smaller in 2014 January than those presented by Hubrig et al. ([2014]) in their Figs. 2–5.
3 Measurements of the magnetic field using HARPS observations
| HJD | S/N | [G] | [G] | ||
|---|---|---|---|---|---|
| 2456345.677 | 345 | 36 | 21 | 12 | 25 |
| 2456347.676 | 510 | 11 | 11 | 5 | 15 |
| 2456348.677 | 450 | 2 | 13 | 3 | 16 |
| 2456350.669 | 485 | 14 | 11 | 6 | 14 |
Part of the spectra analyzed in this work were obtained with the HARPS polarimeter (Snik et al. [2008]) feeding the HARPS spectrometer at the ESO 3.6-m telescope on La Silla. We downloaded from the ESO archive the publically available polarimetric spectra of HD 92207, obtained on four different epochs in 2013 February. All spectra have a resolving power of and the signal-to-noise ratio in the Stokes profiles is between 345 and 510. The HARPS archival spectra cover the wavelength range 3780–6913 Å, with a small gap around 5300 Å. Each observation of the star is split into four sub-exposures, obtained with four different orientations of the quarter-wave retarder plate relative to the beam splitter of the polarimeter. The reduction was performed using the HARPS data reduction software available at the ESO headquarters in Garching. The normalization procedure for the HARPS spectra to the continuum level is described in detail in the work of Hubrig et al. ([2013b]). The Stokes and parameters were derived following the ratio method described by Donati et al. ([1997]), ensuring in particular that all spurious signatures are removed up to first order. The information on the individual observations, including the dates of observation and the values, is given in Table 2.
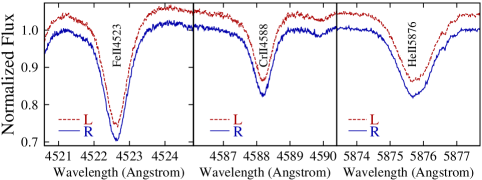
We used for the measurements of the longitudinal magnetic field the moment technique developed by Mathys (e.g. [1991]). The diagnostic potential of high-resolution circularly polarized spectra using the moment technique has been discussed at length in numerous papers by Mathys (e.g., [1993], [1994]). Wavelength shifts between right- and left-hand side circularly polarized spectra are interpreted in terms of a longitudinal magnetic field . Furthermore, this technique allows us not only the determination of the mean longitudinal magnetic field, but also to investigate the presence of crossover effect, and to measure the quadratic magnetic field. For each line in the selected sample of 50 Fe ii lines, the measured shifts between the line profiles in the left- and right-hand circularly polarized HARPS spectra are used in a linear regression analysis in the versus diagram, following the formalism discussed by Mathys ([1991, 1994]). The measured values for the mean longitudinal magnetic field are presented in Table 2. They range from 36 G obtained on the first observing night to 14 G obtained on the last observing night. We do not detect a longitudinal magnetic field at a significance level of 3 for any night, and, as we show below, on each night the profile shapes of spectral lines recorded in each subexposure in the left- and right-hand polarized light appear rather identical, indicating the absence of a significant longitudinal magnetic field. As an example, we present in Fig. 7 the line profiles recorded with HARPS in left- and right-hand polarized light on 2013 February 25.
As a crosscheck, we measure the mean longitudinal magnetic field on null polarization spectra, which are calculated by combining the subexposures in such a way that polarization cancels out. The results of our measurements are presented in Table 2. The measurements on the spectral lines of Fe ii using null spectra are labeled with . Since no significant fields could be determined from null spectra, we conclude that any noticeable spurious polarization is absent. No significant crossover or mean quadratic magnetic field has been detected on the four observing epochs.
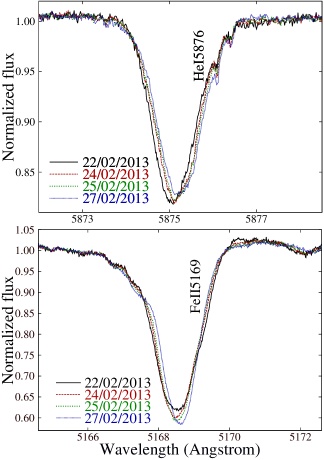
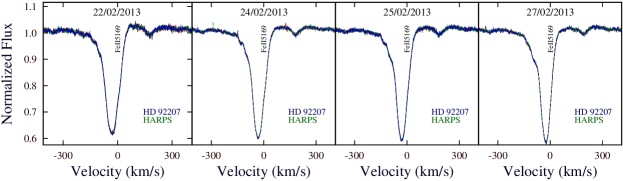
Clear day-to-day spectral variations are discovered in the spectra observed from 2013 February 22 to 27. We detect that the radial velocity for metallic lines is increasing from night to night at a mean rate of 1.7 km s-1, while for the He i lines it increases by 0.8 km s-1. The intensities of metallic lines vary opposite to the intensities of He i lines. We observe over the five nights the increase of the metallic line intensity by about 3% while the intensity for the He i lines decreases by about 1%. As an example of the day-to-day spectral variations, we present in Fig. 8 the behaviour of the Fe ii 5169 and He i 5876 lines.
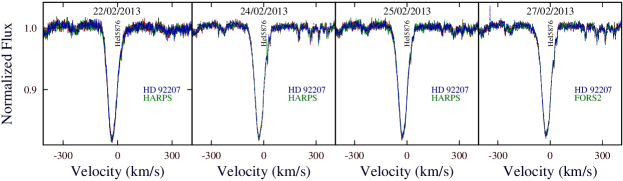
Since HARPS spectropolarimetric observations are usually split into four sub-exposures, it is also possible to test the line profile variability not only on the day-to-day time scale but also on shorter time scales corresponding to the duration of sub-exposures, which in the case of HD 92207 accounts for 8.3 to 10 min. Admittedly, these exposure times are much longer than those used for FORS 2 observations. On the other hand, the analysis of HARPS spectra allows us to explore the presence of the variability on 8–10 minute time scales. In Fig. 9, we present the profiles of the Fe ii 5169 and He i 5876 lines recorded on each individual night. No obvious changes in radial velocity or intensity are detected at these time scales. In the sub-exposures obtained during the same night, the flux differences are of the order of 0.5% of the continuum level, which is consistent with the noise estimate.
4 Spectroscopic time-series obtained with the CORALIE spectrograph

To search for the presence of variability in HD 92207 in high-resolution spectra on even shorter time scales of the order of a few minutes, we used the CORALIE spectrograph installed at the Swiss 1.2-m Leonard Euler telescope on La Silla. CORALIE is a fibre-fed echelle spectrograph with and with a wavelength coverage from 3800 to 6900 Å. The instrument is described by Queloz et al. ([2001]), and instrumental upgrades made in 2007 are detailed by Ségransan et al. ([2010]). The raw data were reduced using the efficient automated reduction pipeline, which follows standard procedures and performs pre- and overscan bias correction, flatfielding using Halogen lamps, background modelization, as well as cosmic removal. ThAr lamps are used for wavelength calibration.
Two time-series over several hours were obtained on the nights in 2014 January 8 and 12. During the first night, we were able to record 40 spectra with an exposure time of 120 s and a signal-to-noise ratio of about 80–100. Taking into account the readout overheads, the individual exposures are separated by 3.28 min. In Fig. 10, we present the behaviour of the line profile of the Fe ii 5197.6 line in all 40 spectra. Due to the presence of the rather strong noise, before plotting the line profiles, we have slightly smoothed the profiles using a Gauss filter with a width of 0.05 Å. Although the line profiles appear to be slightly variable, the level of variability is rather low, much less than that observed by Hubrig et al. ([2014]) in FORS 2 spectra.
During the second night on January 12, an additional time series of 29 and 28 spectra with an exposure time between 120 and 150 sec and similar S/N, separated by a wavelength calibration exposure, were recorded. The total observing time accounted for 3 h 40 min. In these spectra, one can find similar line profile variations as in the night of January 8.
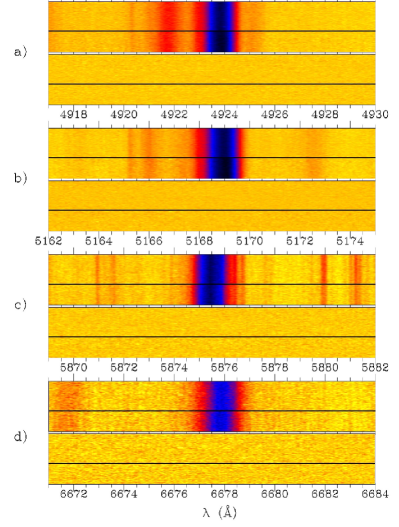
To check that the observed variability is not just due to the impact of the noise in the observed spectra, we constructed images of stacked spectra in several spectral regions. In Fig. 11 in the upper panels, we present the stacked CORALIE spectra for the first and the second series in different spectral regions around the lines Fe ii 4924, Fe ii 5169, He i 5876, and Fe i 6678. In the lower panels we show the residual spectra with respect to the mean spectrum. All six panels are 13 Å long, and in all presented images, the -dimension corresponds to the observing time. The inspection of these images seems to indicate that some structure is present in the cores of the He i 5876 and Fe i 6677 lines. However, as we show in the same figure in the lower panels, if we subtract the mean spectrum calculated using all observed spectra, this structure disappears, indicating that the amplitude of the structure is of the same order as the spectrum noise. The presented results can be explained in two different ways: either short-term spectral variability on a time scale of 3-4 min does not exist, or the amplitude of the line profile variability is of the same order as the spectrum noise and cannot be detected in spectra obtained with a signal-to-noise ratio of about 80–100.
5 Discussion
We obtained new magnetic field measurements of HD 92207 on three different epochs in 2013 and 2014 using FORS 2 in spectropolarimetric mode. Previous FORS 2 observations revealed the presence of a weak mean longitudinal magnetic field, but the definite confirmation of the magnetic nature of this object was pending due to the detection of short-term spectral variability probably affecting the position of line profiles in left- and right-hand polarized spectra. In our recent FORS 2 observations obtained in 2014 January, the position of spectral lines appeared stable, with measured radial velocity shifts below 3 km s-1. Exactly at this epoch, using the entire spectrum including all hydrogen lines for the measurement of the magnetic field, we achieved a 3 detection with G. This result is fully in agreement with the previous detection of a weak longitudinal magnetic field in this star.
However, our analysis of the polarimetric FORS 2 spectra revealed a strange phenomenon that is currently difficult to explain and that has never been mentioned by other polarimetric studies of blue supergiants before: we discover that the line profiles in the light polarized in a certain direction appear slightly split. Given the size and the shape of the splitting, it is obvious that the splitting is not related to the Zeeman splitting frequently observed in slowly rotating Ap and Bp stars with strong magnetic fields. We also cannot ascribe this splitting to the appearance of an emission in the line core, since the H line, which is sensitive to the stellar wind, does not display any core emission or splitting in polarized light. Further, we are also not aware of any kind of pulsations that would affect polarized profiles in such a way. Clearly, future monitoring of the behaviour of the line profiles in polarimetric spectra will be very valuable to identify the mechanism causing the line splitting in circularly polarized light.
The available high-resolution polarimetric HARPS spectra on four different epochs show clear day-to-day variations in all spectral lines, but short-term variability on a time scale of 8–10 min is not detected. We do not find any distinct Zeeman features in the Stokes spectra and the determined value of the longitudinal magnetic field is always below the 3 level. No significant crossover or mean quadratic magnetic field is detected in the four HARPS observations
To search for short-term variability on even shorter timescales down to 3–4 min, we obtained time series at two different epochs with the CORALIE spectrograph. The structure visible in a few spectral lines in the images presenting stacked spectra disappears if the mean spectrum is subtracted. Due to the rather low signal-to-noise ratio of CORALIE spectra, we can not rule out that spectral variability is present, but its amplitude is of the same order as the spectrum noise.
Despite several decades of observational efforts with ground-based photometry and spectroscopy of bright blue supergiants, it is not yet certain what portion of their variability is periodic, or how far they deviate from strict periodicity. As a matter of fact, short-term variability was already identified on a time scale of 1–3 hours (Lefever et al. [2007]; Kraus et al. [2012]). However, a variability on time scales of the order of minutes and less has not been investigated so far. To improve the sensitivity to such variability, it would be important to use for the time series a high-resolution spectrograph installed at a telescope with a larger collecting area, such as the UV-Visual Echelle Spectrograph attached to the VLT 8 m Kuyen telescope.
References
- [1997] Donati, J.-F., Semel, M., Carter, B. D., et al. 1997, MNRAS, 291, 658
- [2004a] Hubrig, S., Kurtz, D. W., Bagnulo, S., et al. 2004a, A&A, 415, 661
- [2004b] Hubrig, S., Szeifert, T., Schöller, M., et al. 2004b, A&A, 415, 685
- [2006] Hubrig, S., Briquet, M., Schöller, M., et al. 2006, MNRAS, 369, L61
- [2008] Hubrig, S., Schöller, M., Schnerr, R.S., et al. 2008, A&A, 490, 793
- [2009] Hubrig, S., Briquet, M., De Cat, P., et al. 2009, Astron. Nachr., 330, 317
- [2011a] Hubrig, S., Ilyin, I., Briquet, M., et al. 2011a, A&A, 531, L20
- [2011b] Hubrig, S., Schöller, M., Kharchenko, N. V., et al. 2011b, A&A, 528, A151
- [2012] Hubrig, S., Schöller, M., Kholtygin, A. F., et al. 2012, A&A, 546, L6
- [2013a] Hubrig, S., Schöller, M., Ilyin, I., et al. 2013a, A&A, 551, A33
- [2013b] Hubrig, S., Ilyin, I., Schöller, M., Lo Curto, G. 2013b, Astron. Nachr., 334, 1093
- [2014] Hubrig, S., Schöller, M., Kholtygin, A. F. 2014, MNRAS, 440, 1779
- [2009] Ignace, R., Hubrig, S., Schöller, M. 2009, AJ, 137, 3339
- [1996] Kaufer, A., Stahl, O., Wolf, B., et al. 1996, A&A, 305, 887
- [1997] Kaufer, A., Stahl, O., Wolf, B., et al. 1997, A&A, 320, 273
- [2012] Kraus, M., Tomić, S., Oksala, M. E., Smole, M. 2012, A&A, 542, L32
- [2007] Lefever, K., Puls, J., Aerts, C. 2007, A&A, 463, 1093
- [1991] Mathys, G. 1991, A&AS, 89, 121
- [1993] Mathys, G. 1993, in: IAU Colloq. 138, “Peculiar versus Normal Phenomena in A-type and Related Stars”, eds. M. M. Dworetsky, F. Castelli, & R. Faraggiana, ASP Conf. Ser. 44, p. 232
- [1994] Mathys, G. 1994, A&AS, 108, 547
- [2006] Przybilla, N., Butler, K., Becker, S. R., Kudritzki, R. P. 2006, A&A, 445, 1099
- [2001] Queloz, D., Mayor, M., Udry, S., et al. 2001, The ESO Messenger, 105, 1
- [2006] Schnerr, R. S., Verdugo, E., Henrichs, H. F., Neiner, C. 2006, A&A, 452, 969
- [2010] Ségransan, D., Udry, S., Mayor, M., et al. 2010, A&A, 511, A45
- [2008] Snik, F., Jeffers, S., Keller, C., et al. 2008, SPIE 7014, E22
- [1983] Sterken, C. 1983, The ESO Messenger, 33, 10
- [2005] Verdugo, E., Henrichs, H. F., Talavera, A., et al. 2005, in: “The Nature and Evolution of Disks Around Hot Stars”, eds. R. Ignace, & K. G. Gayley, ASP Conf. Ser. 337, p. 324