Sejong Open Cluster Survey (SOS) - IV. The Young Open Clusters NGC 1624 and NGC 1931
Abstract
Young open clusters located in the outer Galaxy provide us with an opportunity to study star formation activity in a different environment from the solar neighborhood. We present a and H photometric study of the young open clusters NGC 1624 and NGC 1931 that are situated toward the Galactic anticenter. Various photometric diagrams are used to select the members of the clusters and to determine the fundamental parameters. NGC 1624 and NGC 1931 are, on average, reddened by and mag, respectively. The properties of the reddening toward NGC 1931 indicate an abnormal reddening law (). Using the zero-age main sequence fitting method we confirm that NGC 1624 is kpc away from the Sun, whereas NGC 1931 is at a distance of kpc. The results from isochrone fitting in the Hertzsprung-Russell diagram indicate the ages of NGC 1624 and NGC 1931 to be less than 4 Myr and 1.5 – 2.0 Myr, respectively. We derived the initial mass function (IMF) of the clusters. The slope of the IMF ( and ) appears to be steeper than that of the Salpeter/Kroupa IMF. We discuss the implication of the derived IMF based on simple Monte-Carlo simulations and conclude that the property of star formation in the clusters seems not to be far different from that in the solar neighborhood.
1 INTRODUCTION
Young open clusters are useful objects to study the star formation process because about 80 percent of the stars in star forming regions (SFRs) are found in clusters with at least 100 members (Lada & Lada, 2003; Porras et al., 2003). The relation between star formation activity and environmental conditions is one of the most interesting issues in star formation studies (Caramazza et al., 2008, 2012). A basic diagnostic tool for understanding star formation processes is the stellar initial mass function (IMF). The concept was first introduced by Salpeter (1955). If the stellar IMF has a universal shape in all SFRs, there must be a fundamental factor controlling the star formation process. A number of efforts have been devoted to confirming the universality (see review of Bastian et al. 2010), however, there is as yet no firm conclusion concerning the universality or diversity of the shape. In this context, the IMF of young open clusters formed in various star-forming environments may give a clue to the dependence of star formation processes on environmental conditions. As part of an attempt to study this issue, we investigated the young open clusters NGC 1624 and NGC 1931 in the outer Galaxy, which is probably a low-metallicity environment, according to the gradient of metal abundance in the Galactic disk (Yong et al., 2012).
The young open cluster NGC 1624 is surrounded by the H II region Sh2-212 with a shell like structure. The cluster comprises several high-mass main sequence (MS) stars, as well as a large number of pre-main sequence (PMS) stars (Jose et al., 2011). The most luminous star is NGC 1624-2 (O7f?p – Walborn et al. 2010; Sota et al. 2011) located near the cluster center. This star with strong X-ray emission is known to be a slowly rotating star with a very strong magnetic field (Wade et al., 2012). Out of all the probable PMS members one-fifth have circumstellar disks (Jose et al., 2011). From their radio observations, Deharveng et al. (2008) found an ultra-compact H II (UCHII) region at the border of Sh2-212. A high-mass PMS star (No. 228 of Deharveng et al. 2008) seems to be associated with the UCHII. A few photometric studies of NGC 1624 provided the fundamental parameters (Moffat et al., 1979; Chini & Wink, 1984; Sujatha & Babu, 2006; Deharveng et al., 2008; Jose et al., 2011). The reddening of the cluster is about – 0.9 mag. The previously determined distance to the cluster was in the range 6.0 – 6.5 kpc (Moffat et al., 1979; Sujatha & Babu, 2006; Deharveng et al., 2008; Jose et al., 2011), while Chini & Wink (1984) obtained a far different value of 10.3 kpc. The IMF of the cluster was investigated by Sujatha & Babu (2006) and Jose et al. (2011), and its slope was reasonably consistent with the Salpeter/Kroupa IMF (Salpeter, 1955; Kroupa, 2001, 2002). It implies that although NGC 1624 is located in the outer Galaxy, the nature of the star formation activity is similar to that found in the solar neighbourhood.
The nearer and younger open cluster NGC 1931 is associated with the glowing nebula Sh2-237. A few bright MS stars and many PMS stars constitute the cluster (Pandey et al., 2013a). The main ionizing source of the bright nebula is thought to be the B0.5 star (Glushkov et al., 1975) or two B2 stars (Pandey et al., 2013a). A number of PMS star candidates were identified by Pandey et al. (2013a) from the Two Micron All Sky Survey (2MASS; Skrutskie et al. 2006) catalog and Spitzer InfraRed Array Camera (IRAC) photometry. The spatial distribution of members seems to be divided into two stellar groups, a northern and a southern group (Bonatto & Bica, 2009; Pandey et al., 2013a). The fundamental parameters of the cluster were obtained from photometric studies (Moffat et al., 1979; Pandey & Mahra, 1986; Bhatt et al., 1994; Bonatto & Bica, 2009; Pandey et al., 2013a). According to these studies, the reddening and distance of the cluster are – 1.0 mag and – 2.4 kpc, respectively. A recent study (Pandey et al., 2013a) investigated the properties of dust toward the cluster using polarimetric and photometric data. The reddening law toward the cluster estimated from the Serkowski law (Serkowski et al., 1975) and color excess ratios indicated that the size distribution of dust grains may be different from that of the general diffuse interstellar medium (ISM). They also derived the IMF of the northern, southern, and the entire cluster regions, respectively. The slope of the IMF appears to be shallower than the Salpeter/Kroupa IMF.
The present work on NGC 1624 and NGC 1931 is the fifth paper of the Sejong Open cluster Survey (SOS) project which was initiated to provide homogeneous photometric data for many open clusters. The overview of the SOS project can be found in Sung et al. (2013a) (hereafter Paper 0). Comprehensive studies of several open clusters NGC 2353, IC 1848, and NGC 1893 were published as part of the project (Lim et al., 2011, 2014a, 2014b). In this work, we revisit the reddening law as well as the fundamental parameters of these clusters in a homogeneous manner. The IMF of the clusters is also studied in order to investigate the property of star formation activity in the outer Galaxy. The observation and reliability of our photometry are described in Section 2. In Section 3, we present several fundamental parameters of the clusters obtained from photometric diagrams. The reddening law toward two clusters is also discussed in this section. We construct the Hertzsprung-Russell diagram (HRD) in Section 4 and derive the IMF of the clusters in Section 5. Several discussions on the age spread of PMS stars are made in Section 6. Finally, the comprehensive results from this study are summarized in Section 7.
2 OBSERVATION
2.1 AZT-22 1.5m Telescope of Maidanak Astronomical Observatory
The observations of NGC 1624 was made on 2006 November 24, using the AZT-22 1.5m telescope (f/7.74) at Maidanak Astronomical Observatory (MAO) in Uzbekistan. All imaging data were acquired using Fairchild 486 CCD camera (SNUCam; Im et al. 2010) with the standard Bessell filters (Bessell, 1990). The field of view (FOV) is about . The characteristics of the CCD chip have been described by Lim et al. (2008) in detail. The observations comprised 8 frames that were taken in two sets of exposure times for each band – 3 and 60s in , 3 and 180s in , 5 and 300s in , and 15 and 600s in . To transform instrumental magnitudes to standard magnitudes and colors we made observations of several equatorial standard stars (Menzies et al., 1991) over a wide air mass range of 1.2 – 2.0 on the same night. The observations are summarized in Table 1, and the left-hand panel in Figure 1 displays the finder chart (dashed line) for the observed stars brighter than mag.
All pre-processing to remove instrumental artifacts was carried out using the IRAF111Image Reduction and Analysis Facility is developed and distributed by the National Optical Astronomy Observatories, which is operated by the Association of Universities for Research in Astronomy under operative agreement with the National Science Foundation./CCDRED packages as described in Lim et al. (2008). Simple aperture photometry was performed for the standard stars with an aperture size of 14.0 arcsec (26.3 pixels). Atmospheric extinction coefficients were determined from the photometric data of the standard stars with a weighted least-square method. The coefficients are presented with photometric zero points in Table 2. Using IRAF/DAOPHOT we conducted point spread function (PSF) photometry on stars in the target images using a small fitting radius of 1 full width at half-maximum (FWHM; 1.0 arcsec), and then aperture correction was done using the aperture photometry of bright, isolated stars with a photometric error smaller than 0.01 mag in individual target images. The instrumental magnitude was transformed to the standard magnitude and colors using the transformation equations below (Paper 0):
| (1) |
where , , , , , , , , , and are the standard magnitude, instrumental magnitude, the primary extinction coefficient, the secondary extinction coefficient, transformation coefficient, relevant color, air mass, time-variation coefficient, time difference relative to midnight, and photometric zero point, respectively. We adopted the SNUCam transformation coefficients (), which were recently refined from those in Lim et al. (2009).
2.2 Kuiper 61” Telescope of Steward Observatory
The observations of NGC 1624 and NGC 1931 were made on 2011 October 29, using the Kuiper 61” telescope (f/13.5) of Steward Observatory (SO) on Mt. Bigelow in Arizona, USA. We obtained images with the Mont4k CCD camera and 5 filters (Bessell , Harris , Arizona , and H). The FOV is about . Later, additional images of NGC 1931 were taken on 2013 February 5, without the H filter. Since typical seeing was – (7 – 14 pixels), the binning mode ( per pixel) allowed us not only to obtain an appropriate FWHM ( 3 pixels) for PSF photometry but also to decrease the readout time ( 10s). In order to obtain reliable transformation relations for this photometric system across a wide color range, we observed several extreme red and blue standard stars (Kilkenny et al., 1998) as well as a large number of equatorial standard stars (Menzies et al., 1991) at air masses of 1.2 – 2 during the run. In addition, a few Landolt standard star fields (Rubin 149, 152, and PG 2213 – Landolt 1992), which contain both extreme red and blue stars within a small region, were also observed to obtain the secondary extinction coefficients. The observations are summarized in Table 1, and the finder chart (solid line) for the stars brighter than mag is shown in Figure 1.
The Mont4k photometric system of the Kuiper 61” telescope was used in this survey project for the first time. Understanding the characteristics of the photometric system is essential for obtaining reliable photometric data. We address the characteristics and transformation relations for the Mont4k CCD photometric system in the Appendix. Atmospheric extinction coefficients and photometric zero points obtained from the aperture photometry of the standard stars are presented in Table 2. PSF photometry and aperture correction for the images of NGC 1624 and NGC 1931 were carried out using the same procedures as described in the previous section. The instrumental magnitude was transformed to the standard magnitude and colors using the transformation equations addressed in the Appendix.
2.3 The Consistency and Completeness of the Photometric Data
We have confirmed from a series of studies (Lim et al., 2011, 2014a, 2014b) that the photometric data obtained from the photometric system of the AZT-22 1.5m telescope at MAO are well-tied to the Johnson-Cousins standard system. But we need to check the homogeneity of the photometric data obtained with the Mont4k CCD camera of the Kuiper 61” telescope. Since NGC 1624 was observed with the two different photometric systems, it was possible for us to compare our photometric data directly. Figure 2 shows the comparison between a few sets of modern CCD photometry. Bold dots (black) in the upper panels represent the differences between the photometric data obtained at MAO and SO. We confirmed that our photometry is in good agreement within 0.01 mag (see also Table 3). The imaging data for NGC 1931 were taken with the Mont4k CCD camera of the Kuiper 61” telescope at two different epochs. The internal consistency of the two data sets was examined as shown by bold dots in the lower panels of Figure 2. The photometry is well consistent with each other within 0.01 mag. We averaged the data sets for each cluster using a weighted average scheme (Sung & Lee, 1995).
A couple of photometric studies with a modern CCD camera have been made for NGC 1624 (e.g. Sujatha & Babu 2006; Jose et al. 2011). The combined photometric data for the cluster were compared with those of the previous studies as marked by squares and triangles in the upper panels of Figure 2 (see also Table 3). The photometric data of Sujatha & Babu (2006) are far different from ours, particularly the magnitudes. All their colors are systematically redder than the others. There is also a color-dependent trend for .
The difference between the photometry of Jose et al. (2011) and ours is acceptable in and , whereas the other colors show systematic differences. Although their color is in a good agreement with ours for , for redder stars their colors are systematically redder than ours. Their color appears bluer than that of the others. We note that the previous sets of CCD data for NGC 1624 are likely to involve problems in the photometric standardization. On the other hand, the photometry of NGC 1931 by Pandey et al. (2013a) is in good agreement with ours. We present a summary of the comparison in Table 3.
Statistical analysis based on photometric data requires the completeness of the photometry to be at least 90 percent. In the case of sparse open clusters, the completeness limit is not very different from that obtained in nearby field region, and that relates to the turnover magnitude in the luminosity function of the observed stars. We estimated the completeness of our photometry from the turnover in the luminosity function of all the observed stars, by assuming a linear slope across the entire magnitude range. Our photometry is complete down to mag () for NGC 1624 and 20 mag () for NGC 1931. However, the completeness limit may be an upper limit because the bright nebulae surrounding the young open clusters may prevent the detection of faint stars. The photometric data from this work are available in the electronic tables (Table 4 and 5) or from the authors (BL or HS).
3 PHOTOMETRIC DIAGRAMS
Photometric studies for young open clusters are based on the two-color diagram (TCD) and color-magnitude diagrams (CMDs). With well-calibrated empirical relations and stellar evolution models, fundamental parameters, such as reddening, distance, and age, can be determined from these photometric diagrams. The fundamental parameters allow us to investigate the local spiral arm structure in the Galaxy (Paper 0) as well as the properties and evolution of the dust grain through the reddening law (Pandey et al., 2003; Lim et al., 2011, 2014a, 2014b; Sung & Bessell, 2014, Paper 0, etc). In addition, the age distribution of stars can be used to study the star formation history within a star-forming region (Palla & Stahler, 1999; Sicilia-Aguilar et al., 2004; Sung & Bessell, 2010; Lim et al., 2014b, etc) and the pattern speed of the Galactic spiral arms (Dias & Lépine, 2005). These studies should be based on reliable membership selection. In the following sections, we present membership selection criteria, the reddening law, and fundamental parameters of NGC 1624 and NGC 1931 with TCDs and CMDs.
3.1 The Extent of NGC 1624 and NGC 1931
As most open clusters are unbound stellar systems, i.e. expanding systems (Lada & Lada, 2003), it is believed from theoretical approaches, that gas expulsion affects the dynamical evolution of the remaining clusters significantly (Tutukov, 1978; Goodwin & Bastian, 2006). In some SFRs, new generation stars are still forming in the natal clouds swept away by the stellar wind and the UV radiation from high-mass stars (e.g. Sicilia-Aguilar et al. 2004; Koenig et al. 2008; Lim et al. 2014b). The observed structure is basically a projection onto the sky. Hence, it is difficult to determine the physically meaningful extent of young open clusters. Alternatively, radial surface density profile (RSDP) gives an area encompassing almost all the members of a cluster. This is a fundamental method to define the size of clusters.
We determined the radius of NGC 1624 assuming a circular shape. The center of the cluster was set to the position of the brightest star NGC 1624-2. The stars observed in the band were counted within concentric rings increased by . The RSDP of NGC 1624 is plotted in Figure 3. The error in the surface density was assumed to follow Poisson statistics. The surface density decreases with the increasing distance from the center until it indistinguishably converges to the surface density of field stars. The distance from the center to the convergent point () was assigned as the radius of the cluster. Jose et al. (2011) also obtained a consistent value () with ours using their optical and 2MASS near-infrared (NIR) data.
The extent of NGC 1931 could not be determined from the RSDP. Pandey et al. (2013a) presented the spatial distribution of PMS members in their figure 25. The spatial distribution could not be confined to a small specific region within our small FOV () because the PMS stars scattered across the emission nebula (Sh2-237). Given that no PMS member has been identified northwards from (Pandey et al., 2013a), we assigned the southern region covered by our observation as likely to encompass all the members of the cluster. The area of these clusters is used to normalize the IMF as well as to isolate members.
3.2 Membership Selection
The early-type stars (O – B-type) can be unambiguously identified in the (, ) TCD as they have very blue colors (see figure 11 of Paper 0). In addition, the intrinsic colors and absolute magnitude of these stars have been well calibrated in the optical passbands, so that the reddening and distance of the stars can be reliably determined by comparing the observed colors and magnitude with the intrinsic relations. These procedures are described in detail in the following sections. We identified early-type members within specific reddening and distance ranges based on the (, ) TCD (Figure 4) and CMDs (Figure 5). The membership selection criteria for the early-type main sequence (MS) stars of NGC 1624 are (1) mag, , , and , where (Paper 0), (2) mag, (3) for late-B type members () the individual distance modulus should be between ( and (, where ( and are the distance modulus of NGC 1624 and the standard deviation of the distance modulus, respectively. The factor -0.75 is introduced to take into account the effect of equal mass binaries. The FOV of SNUCam () is wide enough to include the distributed population, most of which may not be associated with NGC 1624. In order to prevent the inclusion of such stars we isolated only stars within a radius of from the brightest star NGC 1624-2. The star ID 1609 (, , , ) was rejected from the member list because the star is too bright to be the member of the cluster at a given color in the CMDs. These processes of the membership selection for early-type MS stars were carried out iteratively. A total of 14 stars were selected as the early-type MS members of NGC 1624.
Similar criteria were used to select the early-type MS members of NGC 1931. The criteria are (1) mag, , , and , (2) mag, (3) 10.8 mag 12.3 mag for late-B type members. Several field interlopers were identified from these criteria. We checked the color excess ratio of the most probable members () and excluded outliers with significantly different color excess ratios from those of the most probable members. The abnormal color excess ratios of these outliers are caused by the fact that less reddened foreground F or G-type stars would be regarded as highly reddened early-type stars from the color-cuts. The star ID 314 (, , , ) was originally selected as an early-type member, however, its spatial position (, ) is outside the cluster boundary. We regarded the star as a mid-B-type field interloper at a similar distance, and therefore the star was excluded from the member list. A total of 14 stars were assigned as early-type MS members of NGC 1931. It is worth noting that BD+34 1074, which is one of the two brightest stars in NGC 1931, was resolved into four stars, of which three (ID 857, 865, and 872) are also the early-type members identified here.
Most low-mass PMS stars have a circumstellar disk, and some of these disks exhibit significant accretion activity (Lim et al., 2014a, b). According to the standard accretion model for PMS stars (Uchida & Shibata, 1985; Bertout et al., 1988; Königl, 1991), material channeled from the circumstellar disk falls onto the surface of the central star along its magnetosphere. Various emission lines and hot continuum excess emission arise from accretion columns, preshock infall region, and the heated photosphere (Calvet & Gullbring, 1998; Hartmann, 1999). The generated energy is mainly released at ultraviolet (UV) wavelengths, so that the accretion luminosity is related to the magnitude (Gullbring et al., 1998; Calvet & Gullbring, 1998). Hence, a few PMS stars with strong UV excess emission can be identified in the band photometry. There is a dotted line parallel to the reddening vector in the () TCD (the left-hand panels of Figure 4). The stars with a bluer color than the dotted line at a given color are either early-type stars or UV excess stars. The criteria for the PMS stars with UV excess emission are (1) , (2) and , (3) stars within the empirical PMS locus (Sung et al., 2008) in the CMD (see Figure 5). The last criterion prevents the inclusion of background early-type stars. We found 3 and 4 PMS stars with UV excess emission in NGC 1624 and NGC 1931, respectively.
H photometry provides a good criterion to find PMS stars in young open clusters ( 3 Myr). Since Sung et al. (1997) achieved the successful detection of many PMS stars in NGC 2264, this efficient technique has been used to search for PMS members in a series of studies (e.g. Sung et al. 1998, 2000; Park et al. 2000; Park & Sung 2002; Sung et al. 2004; Sung & Bessell 2004; Sung et al. 2008, 2013b; Lim et al. 2014a, b). In order to identify H emission stars photometrically we have defined the H index as H - ()/2 (Sung et al., 2000). As shown in the right-hand panels of Figure 4, stars with -0.2 (dashed line) or -0.1 mag (dotted line) smaller H index than the empirical photospheric level (solid line) of normal MS stars are selected as H emission stars or candidates. The H emission stars and candidates ID 1897 (, , ), ID 2326 (, , ), ID 2356 (, , ), and ID 2588 (, , ) in the FOV of NGC 1624 were regarded as foreground stars because their colors are similar to those of less reddened foreground stars. In addition, the radius () of the cluster was also used to isolate the members. We found 9 H emission stars and candidates associated with NGC 1624. In the same way, we found 28 H emission stars and candidates in NGC 1931, one of which (ID 596; ) is likely a foreground late-type star.
The dust emission from circumstellar disks of PMS stars is prominent at infrared (IR) wavelength, particularly the mid-infrared (MIR). A number of young stellar objects in various star-forming regions have been identified through extensive imaging surveys with the Spitzer space telescope (Caramazza et al., 2008; Gutermuth et al., 2008; Koenig et al., 2008; Sung et al., 2009, etc). We used the Spitzer Galactic Legacy Infrared Mid-Plane Survey Extraordinaire 360-degree catalog (GLIMPSE360; Whitney et al. 2008, 2011) to identify PMS members with MIR excess emission. The GLIMPSE360 survey is a “Warm Mission”, so that only the 3.6 and 4.5 bands were available. Unfortunately, NGC 1624 (, ) was not covered in the survey program because of its high Galactic latitude. The catalog allows us to select PMS members with a circumstellar disk in NGC 1931. A total of 1249 optical counterparts in the catalog were found within a matching radius of . We attempted to identify the PMS members in the () TCD as shown in Figure 6. The majority of the H emission stars exhibited MIR excess emission. Stars with a color larger than 0.2 mag (dashed line) were selected as PMS member candidates, and then the empirical PMS locus (Sung et al., 2008) was used to isolate the PMS members among the candidates. From this procedure, a total of 54 PMS stars with MIR excess emission were selected as members of NGC 1931. Although it is difficult to make a detailed classification due to the absence of information in other IRAC bands (5.8 and 8.0 ), most of them may be Class II objects (see also Figure 18 of Pandey et al. 2013a).
It is a well known observational fact that PMS stars, particularly classical T-Tauri (CTTS) stars, are variable objects with an amplitude of 0.1 – 2 mag in the form of irregular variation (Grankin et al., 2007). The observations of NGC 1624 and NGC 1931 were made at two different epochs. The time difference between the first and the second observation was about 4.9 and 1.2 years for NGC 1624 and NGC 1931, respectively. Since the photometric errors from the averaging process used in section 2.3 (originally from equation (2) of Sung & Lee 1995) represent the consistency of magnitude and colors from several observations, a photometric error larger than that expected from the distribution of errors with magnitude may be attributed to a genuine variation in brightness. We investigated the photometric error of the stars observed more than twice as shown in Figure 7. The photometric errors () in a given magnitude bin ( mag) were averaged, and then its standard deviation () was used as a criterion for the variability of individual stars. If stars have variations larger than 0.03 mag in brightness and in the range of – 21 mag, we assigned the stars as variables. The star ID 727 in NGC 1931 showed a very large variation ( mag on 2011 Oct. 29 and mag on 2013 Feb. 5).
We found 4 variable stars within the radius of NGC 1624. The variable star ID 1733 has a red color similar to that of foreground stars. The color of the star in 2011 was bluer by 0.24 mag than that observed in 2006. The star may be an active late-type star in front of the cluster. The magnitude and color of the other variable stars appear to be commensurate with those of the H emission stars in the PMS locus. A total of 16 stars were identified as variable stars in NGC 1931. The majority of the variable stars were crowded into the cluster center. Their magnitudes and colors are similar to those of other PMS members with H and MIR excess emission, some of which ( percent) are indeed UV excess, H emission, or MIR excess emission stars. Thus, these variable stars were assigned as PMS members of NGC 1931.
A total of 28 stars (14 early-type and 14 PMS stars) in NGC 1624 and 85 stars (14 early-type and 71 PMS stars) in NGC 1931 were selected as members. The star ID 1773 (No. 228 of Deharveng et al. 2008) in NGC 1624 is the only star selected using 2 membership selection criteria (UV excess and H emission), and we found 24 out of 71 PMS members in NGC 1931 satisfied more than 2 selection criteria. The membership selection for early-type MS members is likely complete, however only a small fraction of the PMS stars may have been selected as members of the clusters. According to a study of the young open cluster NGC 1893 (Lim et al., 2014b), the detection efficiencies of H photometry, Spitzer MIR, and Chandra X-ray data turned out to be about 10, 24, and 85 percent for PMS stars (), respectively. This implies that X-ray emission from PMS stars is the most efficient criterion to identify the remaining PMS stars. Although NGC 1624 has been observed using the Chandra X-ray Observatory (ObsID 7473, PI Garmire), the exposure times were not long enough to detect PMS members. Using the published X-ray source list of Evans et al. (2010), the optical counterparts of X-ray emission sources and candidates were searched for with matching radii of 1.0 and 1.5 arcsec, respectively. We found only 2 X-ray emission sources and 1 candidate with optical counterparts. The brightest early-type member NGC 1624-2 is known to be an X-ray emitter (Evans et al., 2010; Wade et al., 2012), and the others turned out to be field interlopers given their colors. On the other hand, X-ray observations for NGC 1931 have not yet been made. Extensive X-ray imaging observations are clearly required in order to study the nature of PMS stars in detail based on complete membership lists. As of now, we merely anticipate that a few hundreds of members may exist in each cluster. A discussion on the approximate number is addressed in a later section.
3.3 Structure of the Clusters
The structure of young open clusters gives us clues to dynamical evolution in the early stages of cluster formation as well as the formation process of stellar clusters (Elmegreen et al., 2000). Many efforts have been made to study the structure of open clusters using the techniques of surface density distribution and minimum spanning tree (Sung et al., 1999; Sharma et al., 2007; Koenig et al., 2008; Gutermuth et al., 2009; Kook et al., 2010; Jose et al., 2011; Sung et al., 2013b; Lim et al., 2013; Pandey et al., 2013a, etc). In this section, we describe the apparent structure of NGC 1624 and NGC 1931 using the surface density distribution, with additional information from previous studies.
The appearance of the HII region Sh2-212 associated with NGC 1624 is close to a symmetric shell structure. An inner region filled with hot ionized gas and a shocked outer region constitute the apparent gas structure (see figure 1 of Jose et al. 2011). A molecular filament with different velocity components in the range of -32 to -37 km s-1 surrounds the southern part of the cluster, stretching out to the north-west (Deharveng et al., 2008). The filament incubates at least five clumps, one of which is likely to be associated with an UCHII in the western part of the cluster. The brightest star NGC 1624-2 (O7f?p – Walborn et al. 2010; Sota et al. 2011) is located near the center of the cluster. Other members are distributed in the vicinity of the star as shown in the left-hand panel of Figure 8. We obtained the surface density distribution of NGC 1624 using stars observed in the band (contour). The concentration of stars appears high in the center of the cluster, and the spatial distribution approximates to a circular shape.
On the other hand, NGC 1931 is enclosed within a dusty molecular cloud (see figure 1 of Pandey et al. 2013a). The natal cloud also exhibits a hierarchical structure. The inner region is filled with hot ionized gas produced by the radiation from a few bright stars while polycyclic aromatic hydrocarbon molecules are glowing in the outer region. The right-hand panel in Figure 8 shows the spatial distribution of cluster members. The early-type MS members appear to be divided into two groups, a northern and a southern group. A high stellar density region is seen between the groups, implying that mass segregation among the members may not yet be established. While many variable PMS members are located in the dense region, the majority of H emission stars are found in the vicinity of the southern group. The PMS members with MIR excess emission are spread out across the whole region, however the stars in the northern part of the cluster show a weak concentration. The surface density distribution (contour) reflects such an elongated shape. The apparent shape is in a good agreement with the result of Pandey et al. (2013a). These observational properties may be related to the star formation history within NGC 1931.
3.4 Reddening and the Reddening Law
As most open clusters are formed in the Galactic plane, a region where interstellar matter is unevenly distributed, reddening corrections are crucial to obtaining reliable physical quantities. The interstellar reddening is basically determined by comparing an observed color with the intrinsic one. The () TCD is a very useful tool because the reddening vector has been well established in the diagram [ – Paper 0]. The intrinsic color relations of Paper 0 were adopted to obtain the reddening of the individual early-type members (see table 1 in Paper 0).
The reddening of NGC 1624 determined from 14 early-type members is in the range of – 1.01 mag, and the mean value is (s.d.) mag. The result is in close agreement with that of previous studies, e.g. – 0.94 mag (Moffat et al., 1979), 0.84 – 0.87 mag (Chini & Wink, 1984), 0.70 – 0.90 mag (Sujatha & Babu, 2006), and 0.76 – 1.00 mag (Jose et al., 2011). The reddening of NGC 1931 obtained from 14 early-type members ranges from – 1.01 mag. The mean reddening is (s.d.) mag. This result is also commensurate with that of previous studies, e.g. – 0.93 mag (Moffat et al., 1979), 0.47 – 1.00 mag (Pandey & Mahra, 1986), 0.55 – 1.00 mag (Bhatt et al., 1994), 0.52 – 0.72 mag (Bonatto & Bica, 2009), and 0.50 – 0.90 mag (Pandey et al., 2013a). The dispersion in the reddening indicates that there is differential reddening across each cluster. The differential reddening in NGC 1624 appears to be less significant than that found in NGC 1931.
Unlike early-type MS stars, it is difficult to determine the reddening for the PMS stars because the intrinsic colors can be altered by hot and cold spots on the surface, accretion activities, and the obscuration by a circumstellar disk (Grankin et al., 2007). Simultaneous imaging (color) and spectroscopic (spectral type) observations are required to determine the reddening of individual PMS stars accurately. In the absence of such data, we estimated the reddening of PMS stars by using a weighted-mean reddening value at a given position from the reddening distribution of the early-type members, where the weight was given by an exponential function with respect to the distance from the individual early-type members.
The reddening law toward young open clusters provides an opportunity to study the spatial distribution of interstellar matter in the Galaxy as well as the dust evolution in SFRs. The ratio of total-to-selective extinction () is a basic tool to investigate the reddening law, being also a crucial parameter to correct the total extinction in the visual band. The parameter is closely related to the size distribution of dust grains. The found in several extremely young SFRs present deviations from the normal reddening law (Greve, 2010; Hur et al., 2012). Previous studies on NGC 1624 have adopted the normal reddening law (, Chini & Wink 1984; Jose et al. 2011), while Pandey et al. (2013a) showed, from photometric and polarimetric data, that the reddening law toward NGC 1931 is slightly different from that found in the general ISM. In order to check the reddening law toward these clusters we investigated various color excess ratios in the optical and IR passbands as performed in the series of studies (Kook et al., 2010; Lim et al., 2011; Hur et al., 2012; Sung et al., 2013b; Lim et al., 2014a, b).
Lim et al. (2014a) have noted that several mid – late-B-type MS stars in the young open cluster IC 1848 have a bluer color than that of normal B-type MS stars. Since the bluer color may not reflect the genuine photospheric color of the stars, the early-type members with for NGC 1624 and with for NGC 1931 were chosen to avoid such a color anomaly. We used 2MASS NIR data (tagged as a photometric quality flag ‘AAA’) as well as our optical data for the stars. For MIR data, the Spitzer GLIMPSE360 catalog (Whitney et al., 2008, 2011) was used to obtain the -MIR color excess. The various color excesses in the optical and IR passbands were computed by comparing the observed colors with the intrinsic relations from Paper 0 and Sung et al. (in preparation). The is expressed as a linear relation for each color excess ratio (Guetter & Vrba, 1989; Sung et al., 2013b). We present the color excess ratios of the cluster members in Figure 9. The thick solid line (blue) in the figure represents the slope corresponding to the normal reddening law ().
There is a foreground early-type star in the direction of NGC 1624 which was helpful to check the difference between the general ISM and the intracluster medium (ICM). As shown in the upper panels of Figure 9, all the color excess ratios consistently indicate that the ICM of NGC 1624 is indistinguishable from the general ISM. The mean obtained from different color excess ratios was (s. d.). This result is in good agreement with that examined by Jose et al. (2011), implying that dust evolution in the cluster had already progressed or no grain growth had occurred in the natal cloud. We adopted and obtained a mean extinction of mag. On the other hand, there was no available foreground early-type star toward NGC 1931 for checking the foreground reddening law. Given that the reddening law toward the neighbouring clusters NGC 1893 and Stock 8 turned out to be normal (Jose et al., 2008; Eswaraiah et al., 2011; Lim et al., 2014b), we assumed that the foreground reddening law in the direction of NGC 1931 was likely to be normal. In the lower panels of Figure 9, the color excess ratios of the members show a significant deviation from the normal reddening law. It implies that the size distribution of dust grain in the ICM of NGC 1931 is far different from that found the general ISM. Thus, the total extinction in band toward the cluster should be divided into two components as below:
| (2) |
where , , , , and represent the total band extinction, the foreground , intracluster , foreground reddening, and total reddening, respectively. As mentioned above, was adopted for the foreground component. We simultaneously determined and from the -IR color excess ratios using a fitting method. The star ID 800 shows significant excess emission at all the wavelengths. Another star ID 872 with a photometric quality flag ‘EEE’ in the 2MASS catalog also exhibits excess emission in the MIR passbands. We did not include these stars in the examination of the reddening law. The mean foreground reddening was found to be (s. d.) mag, corresponding to a point of contact between foreground (thick solid line) and intracluster (thin solid line) components in the lower panels of Figure 9. This value is in good agreement with the smallest reddening of the neighbouring cluster NGC 1893 [ mag, Lim et al. 2014b], which is likely the amount of reddening in front of the clusters. The mean intracluster determined from -IR color excess ratios was found to be (s. d.). The slope corresponding to the is shown by thin solid lines in the lower panels of Figure 9.
The color excess ratio gives an intracluster of 4.3 (dashed line). The value is significantly different from the mean obtained from the -IR colors excess ratios. We attempted to check our colors. As discussed in Section 2.3, there is no considerable systematic difference between the photometry of Pandey et al. (2013a) and ours. The observations of NGC 1624 was made on the same night, and the multiwavelength study on the reddening law showed a consistent result in the optical – NIR passbands. Hence, our photometry and the adopted empirical relations of Paper 0 do not suggest any serious systematic problem. A similar aspect was found in the reddening law toward the starburst cluster Westerlund 2 (Hur et al., 2014). The authors attributed this discrepancy to the unknown behaviour of the color in heavily reddened situations. It needs to be confirmed whether or not the linear relation between and is applicable to extremely young and dusty SFRs. We leave this issue for future work in our survey project.
Using the IR extinction curve of Fitzpatrick & Massa (2007) (equation 4) we tested the reddening law once more as shown in Figure 10. The extinction curve of NGC 1624 (open circles in the upper panel) is close to the mean Galactic extinction curve (dashed line – and – Fitzpatrick & Massa 2007), while that of NGC 1931 still shows a conspicuous deviation from the mean curve with a somewhat large scatter. The was determined by a fitting method, and the result was (). However, we cannot accept that a small specific column throughout the sky can be filled with significantly large dust grains, although a global variation of along the Galactic longitude was found (Whittet, 1977; Sung & Bessell, 2014). We derived the ICM component in the extinction curve after subtracting a foreground reddening of mag. The lower panel of Figure 10 shows the extinction curve of the ICM component. We found of using the same procedure as above. The result is reasonably consistent with that obtained from Figure 9 within the uncertainties. We note that the color excess ratio seems to be ambiguous in this analysis because it is commensurate with the mean Galactic extinction curve as well as the IR extinction curve of the cluster ().
We adopted the segmented reddening law toward NGC 1931 as presented in Figure 9 [, mag, and ] and obtained a mean extinction of mag. This result is somewhat different from that obtained through a polarimetric and photometric method ( – 3.3 – Pandey et al. 2013a). A reason is that the Serkowski law (Serkowski et al., 1975) may not be applicable in the extremely young and dusty SFRs because of the efficiency and time scale for grain alignment, the probable complex structure of the magnetic field in the ICM, as well as the depolarization effect by foreground dust grains. The other reason is that the authors did not consider the foreground and intracluster components separately, and therefore their could be underestimated. Nevertheless, their results also suggest that the reddening law in the direction of NGC 1931 is not normal. We conclude that the evolution of dust grains within the cluster is still in progress.
3.5 Distance
Young open clusters ( 10 Myr) are a useful tracer of the local spiral arm structure in the Galaxy (Dias & Lépine, 2005). We have been using the zero-age main sequence (ZAMS) fitting method to determine distances to open clusters in a series of studies. The canonical ZAMS fitting method should be made after correction for interstellar reddening. In order to reduce uncertainties arising from the reddening correction, Paper 0 introduced the reddening-independent indices as below:
| (3) |
| (4) |
| (5) |
| (6) |
The modified Johnson [] is used as the abscissa of new CMDs. These reddening-independent indices give a few advantages in ZAMS fitting procedure. The indices are based on multicolor photometry, and thus the ZAMS fitting to the CMDs of young open clusters can be made consistently with respect to different colors. The colors of early-type stars are less affected by metallicity effects because few strong metallic lines apart from a few light elements are, in general, found in their spectra. We have determined the distance of young open clusters using these indices (Lim et al., 2014a, b).
A large fraction of high-mass stars constitute binary systems (Sana et al., 2012). The luminosity of such stars appears higher than that expected from ZAMS stars at a given color or effective temperature. In addition, physical properties, such as stellar rotation and overshooting, cause the MS band to be wider in the high-mass regime (Martins & Palacios, 2013). Therefore, the faintest MS stars at a given color in the CMDs have been regarded as ZAMS stars (Johnson & Hiltner, 1956). It is worth noting that some of the early-type members may possibly reveal a color anomaly as mentioned in the previous section. Allowing for this point we carefully fitted the ZAMS relations of Paper 0 to the lower ridge line of the cluster sequence in Figure 11 after adjusting the relations above and below it. The lower ridge line could be confined between the ZAMS relations (dashed lines) shifted by 0.2 – 0.3 mag for each cluster. The fitted distance modulus of NGC 1624 and NGC 1931 was mag ( kpc) and mag ( kpc), respectively. This result places NGC 1624 (, ) in the outer arm and NGC 1931 (, ) in the Perseus arm.
Previous studies used either ZAMS or isochrone fitting in the determination of distance. The distance to NGC 1624 obtained in this work is in good agreement with the results of previous studies, e.g. 6.0 kpc (Moffat et al., 1979; Sujatha & Babu, 2006; Jose et al., 2011) and 6.1 – 6.5 (Deharveng et al., 2008). It is interesting that Sujatha & Babu (2006) obtained a distance consistent with that of other studies although their photometry shows a serious systematic difference in (Figure 2). Chini & Wink (1984) obtained a distance of 10.3 kpc using spectroscopic parallax for 2 bright stars. In their study, the stars were classified as O6I and B1III, respectively. Since their spectral classification is somewhat different from that of a recent study for the brightest star NGC 1624-2 (O7f?p – Walborn et al. 2010; Sota et al. 2011), their distance may be shifted systematically. A similar discussion has been made in Jose et al. (2011). In the case of NGC 1931, Pandey et al. (2013a) refined their previous results (Pandey & Mahra, 1986; Bhatt et al., 1994) and published a new distance of kpc. Bonatto & Bica (2009) obtained a distance of kpc from the 2MASS NIR photometry. Although Moffat et al. (1979) reported a rather smaller value (1.8 kpc), our result is in good agreement with that of more recent studies.
4 HERTZSPRUNG-RUSSELL DIAGRAM
The HRD is a basic tool to understand the evolution of stars. The effective temperature () of stars is a crucial parameter for constructing the HRD. We used the relations published in Paper 0 (table 5) to obtain the and bolometric correction for individual stars. The of the star NGC 1624-2 was determined from the spectral type- relation. Although the spectral type and luminosity class of the star seem to be uncertain - O5.5V (Moffat et al., 1979), O6I (Chini & Wink, 1984), O7f?p (Walborn et al., 2010; Sota et al., 2011), and O6.5f?cp–O8f?cp (a variation in the spectral type has been reported by Wade et al. 2012), we assumed the star to be an O7 MS star according to the recent classification (Sota et al., 2011; Wade et al., 2012). It is worth noting that the absolute magnitude of NGC 1624-2 ( -4.66 mag) is reasonably consistent with that of O7 MS stars ( -4.90 mag) rather than that of O7 supergiant stars ( -6.05 – -6.95 mag, see table 4 of Paper 0). The difference between an O7 MS and giant star is only about 165 K in , and the stars have the same bolometric correction value (Paper 0). If NGC 1624-2 is a supergiant star, the difference between MS and supergiant stars increases up to 800 K in and 0.1 mag in bolometric correction. The of other early-type MS stars was inferred from the color- relations. We averaged the estimated from each color- relation with weights.
We set the weights of estimated from vs. relation to be 0.5, 1.0, 1.5, 2.0, and 2.5 in the color range of 0.07 to -0.1 mag, -0.1 to -0.3 mag, -0.3 to -0.5 mag, -0.5 to -0.7 mag, and -0.7 to -1.2 mag, respectively, set it to be 0 for late-type stars. The temperature sensitivity of the color is not high enough to estimate the of early-type stars. We assigned each weight of inferred from vs. relation and vs. relation to 1.0 and 0.5 for stars with mag. For MS stars with mag, the weights of estimated from vs. relation and vs. relations were set to be 1.0 and 0.7, respectively. Since the color is a good temperature indicator for cool stars, we only used vs. relations (Bessell, 1995; Bessell et al., 1998) for PMS stars. The bolometric correction values for all the members were inferred from their using table 5 in Paper 0. We present the HRD of NGC 1624 and NGC 1931 in Figure 12.
The brightest star in NGC 1624 is an O7 star (Walborn et al., 2010; Sota et al., 2011). If the star is a MS star with solar metallicity, its lifetime is smaller than 10 Myr according to Massey (2013). On the other hand, the spectral type of the most luminous star in NGC 1931 is somewhat uncertain. Pandey et al. (2013a) argued that the main ionizing sources of Sh2-237 may be two B2 stars. The MS lifetime of such stars is tens of millions of years. If the stars are in the MS stage, the lifetime is the upper age limit of the cluster. We superimposed a few isochrones (solid lines) constructed from the stellar evolution models of Ekström et al. (2012) and Siess et al. (2000) on the HRD of NGC 1624 with several evolutionary tracks (dashed lines). The position of NGC 1624-2 in the HRD is well matched to the 4 Myr isochrone, and thus the turn-off age is about 4 Myr. We also used the isochrones interpolated from the stellar evolution models of Brott et al. (2011) for the initial chemical composition of the Galaxy and Large Magellanic Cloud (LMC), where the evolutionary tracks with the similar initial rotation velocity to that of Ekström et al. (2012) were selected. The isochrone for the chemical composition of the Galaxy gives an age of 3.3 Myr, while the 3.8 Myr isochrone for the slightly lower LMC metallicity appears to well predict the and of NGC 1624-2. A systematic uncertainty of the turn-off age arising from the difference in metallicity may be about 0.5 Myr.
In the case of NGC 1931, it is impossible to infer the turn-off age because the most luminous star ID 872 in NGC 1931 is below the ZAMS line. The color of the star became bluer by 0.1 mag from 2005 to 2013 (the data from Pandey et al. 2013a). Another early-type stars ID 629 and 854 also showed a similar variation in the color. The mysterious young stellar object Walker 90 found in the young open cluster NGC 2264 has also shows such a variation in its spectral type as well as colors for the last 50 years (from A3 to B4, Pérez et al. 2008 and references therein). The observational properties of the star, such as an abnormal reddening law of – 7.0, the inverse P-Cygni profile of Balmer lines, IR excess emission, and non-photospheric UV continuum, indicate that the star is likely an intermediate-mass PMS star with an accretion disk (Pérez et al., 2008). The star ID 872 in NGC 1931 also showed similar photometric properties (the variation in color, an abnormal reddening law, and IR excess emission) to those of Walker 90 although its spectral features were not confirmed. If the star is at the analogous evolutionary stage to Walker 90, the age of NGC 1931 can be conjectured from the age of the S Mon group within NGC 2264 (1.6 – 3.0 Myr, Sung & Bessell 2010)
Most of the PMS members in the two clusters have masses smaller than 3 . The number of PMS members identified in NGC 1624 is insufficient to investigate the age distribution. The star ID 1773, which is known as the main ionizing source of UCHII at the border of NGC 1624, is likely a PMS star at a very early evolutionary stage. The age of the star seems to be younger than 1 Myr, indicating that star formation is currently taking place in the cluster. We estimated the mass accretion rate of the star using its UV excess emission as performed in previous studies (Rebull et al., 2000; Lim et al., 2014a, b). The mass accretion rate of the young PMS star is . On the other hand, more than half of the PMS members are likely to be younger than 4 Myr. There are three PMS members (2 H emission and 1 UV excess stars) near the ZAMS. These stars seem to be older than other members. However, if the stars have a nearly edge-on disk, their luminosities would be underestimated. In addition, accretion activities can lead the colors of the stars to be bluer, i.e. hotter .
In the HRD of NGC 1931 (the right panel of Figure 12), most of the PMS members are younger than 10 Myr, which was suggested by the open cluster data base WEBDA222http://www.univie.ac.at/webda/. It is worth noting that WEBDA provided incorrect ages for some open clusters. The number of PMS members is relatively larger than that identified in NGC 1624 because of its proximity as well as the variety of the available data. We investigated the age distribution of the PMS members (thick solid line) in Figure 13, where the bin size is 0.5 Myr. In order to avoid binning effects, another histogram (thin solid line) was plotted by shifting the bins by half the bin size. A peak in the age distribution appears at 1.5 Myr. The median age is about 2.0 Myr with a spread of 4.5 Myr, where the spread was defined as the age difference between the 10 and 90 percentiles in the cumulative age distribution of the PMS members (Sung & Bessell, 2010). Since all the PMS members were identified using membership selection criteria based on the observational properties of warm circumstellar disks and accretion activities, the age distribution could be biased to young active stars.
Previous studies estimated the turn-off age of NGC 1624 to be 4 Myr (Sujatha & Babu, 2006; Jose et al., 2011). Our estimate (4 Myr) is in good agreement with those. Other evolution models by Brott et al. (2011) for Milky Way and LMC metallicities give a slightly younger age (3.3 and 3.8 Myr). The upper value of the ages of PMS members ( Myr) is also consistent with that of Jose et al. (2011). The turn-off age of NGC 1931 remains uncertain because the evolutionary stage of the brightest star is ambiguous. For this reason, Bonatto & Bica (2009) obtained a somewhat larger turn-off age ( Myr), while Pandey et al. (2013a) only suggested an upper value of 25 Myr. The latter reported a mean age of Myr for the PMS stars. This is in good agreement with the median age from this work. They also found a similar age spread ( Myr) from their CMD. We have further discussions on the age spread of PMS stars in Section 6.
5 INITIAL MASS FUNCTION
5.1 Derivation
The membership selection of PMS stars is likely incomplete because the membership selection criteria used above are more likely to identify young active PMS stars rather than those in a quiescent phase. A statistical method was therefore used to fill in the incomplete mass bins of the IMF.
We included all the stars within the PMS locus in the () CMD, that is, bona-fide members plus any field interlopers. These stars were then placed in the HRD following the same procedure as delineated in the previous section (see Figure 12). The mass of the individual stars was estimated in the HRD by comparing their and with those from the evolutionary tracks. For the MS members, the stellar evolution model of Ekström et al. (2012) was used to estimate the mass. The mass of the PMS members and the field stars was inferred from the PMS evolution models of Siess et al. (2000). In order to minimize the contribution of field interlopers, appropriate control fields were chosen within the observed regions (the shaded area in Figure 1). The stars within the PMS locus in the control fields were assumed to be evenly distributed in the direction of each cluster. The apparent mass of these stars was estimated by using the same procedure as above, where the mean reddening and distance of the two clusters applied to the stars. We note that the apparent mass does not mean real stellar mass.
The IMF is, in general, expressed as , where , , and represent the number of stars within a given mass bin, the size of the logarithmic mass bin, and the area of the cluster, respectively. We applied a slightly large bin size of to include as many stars as possible within a given mass bin. An even larger bin size of 1.0 was adopted for the highest mass bin [ – we assumed the upper limit of stellar mass () to be 100 ] because of the small number of high-mass stars. The number of stars was counted within each given logarithmic mass bin, and then that was normalized by the size of the mass bin and the area of the clusters. The apparent IMF of the field interlopers was obtained in the same way. In the case of NGC 1931, the extent of the control field was smaller than that of the cluster, and therefore the number of field interlopers was corrected by multiplying the areal ratio of the cluster to the control field. Finally, the IMF of the two clusters was obtained by subtracting the contribution of field interlopers. Figure 14 shows the IMF of the two clusters. In order to avoid binning effects we shifted the mass bin by 0.2 and re-derived the IMF (open circle) in the same way. The error of the IMF was assumed to follow Poisson statistics. The arrows represent the lower limit of the IMF below the completeness limit of our photometry.
Using a least-square method we determined the slope of the IMF in the mass range of 3 – 27 for NGC 1624 and 1 – 18 for NGC 1931. The slope is for the former and for the latter. The IMF of these clusters appears far steeper than the Salpeter/Kroupa IMF (Salpeter, 1955; Kroupa, 2001, 2002) as well as the results of previous studies, e.g. to for NGC 1624 (Jose et al., 2011) and for NGC 1931 (Pandey et al., 2013a). However, the small number of high-mass stars () and the upper limit of the stellar mass which was required for the normalization of the IMF may be responsible for the steep slope. The IMF of the well-studied young open cluster NGC 2264 (dashed line, Sung & Bessell 2010) is shown in Figure 14 for comparison. The IMF of the two clusters seems to resemble that of NGC 2264 within the uncertainties. According to a recent review on the IMF (Offner et al., 2014) the IMF of NGC 2264 is in good agreement with that of nearby SFRs. This may imply that the star formation in NGC 1624 and NGC 1931 is not much different from that in the solar neighbourhood. More discussion on the slope of the IMF is addressed in the next section.
We estimated the total number of members and the masses of the two clusters by integrating their IMFs. The IMF in the low-mass regime (from the completeness limit down to 0.25 ) was assumed to be that of NGC 2264. NGC 1624 hosts members, and a total of stars constitute NGC 1931. The total mass of NGC 1624 and NGC 1931 is about and , respectively. The uncertainty in the total masses was propagated from the error of the IMF in given mass bins. The total mass is comparable to that of a few small open clusters, e.g. for NGC 2264 (which is the sum of masses of all members from Sung & Bessell 2010), for Praesepe (Kraus & Hillenbrand, 2007), and 800 for the Pleiades (Adams et al., 2001). These clusters are two orders of magnitude lighter than the most massive starburst cluster Westerlund 1 in the Galaxy (, Clark et al. 2005; Gennaro et al. 2011; Lim et al. 2013).
5.2 Implications of the Slope of the IMF
The IMF of NGC 1624 and NGC 1931 shows a steep slope for stars with mass larger than 1 . This could imply that low-mass star formation is dominant in the clusters. According to the metallicity variation in the Galactic disk (Yong et al., 2012) the chemical composition at the Galactocentric distance of NGC 1624 ( kpc) and NGC 1931 ( kpc) is expected to be 0.1 – 0.3 dex lower than the solar metallicity. The temperature of a molecular cloud may therefore be higher in the low metallicity environment because radiative cooling by metallic ions will be lower (Caramazza et al., 2012). Furthermore, there is a relation between the mass accretion rate of a star and the temperature of a cloud (, Susa et al. 2014). As a result, high-mass stars may be formed advantageously in such a low metallicity environment, rather than active low-mass star formation. However, the IMF of the two clusters is inconsistent with this expectation.
In order to properly interpret the IMF of the clusters we will first discuss a few issues concerning the subtraction of field stars, dynamical evolution and stochastic effects.
We carried out checks to see whether the subtraction of field interpolators had been adequately carried out because had the contribution of field interlopers been improperly subtracted within a given mass bin, the resultant IMF would be misleading. We examined the band luminosity function (LF) of stars in each control field using the synthetic stellar population model for the Galaxy (Robin et al., 2003). The synthetic LF was scaled to have the same area as that of each control field. The observed LF was compared with the synthetic one. The LF of stars in the control field for NGC 1931 (, ) is in good agreement with the synthetic one, while the stellar population model overestimated the number of stars toward NGC 1624 at mag. Because of the Galactic warp found at (Robin et al., 2003), the synthetic stellar population in the direction of NGC 1624 (, ) which is linearly interpolated from those between and may not warrant consistency with the observational result. Alternatively, we obtained the IMF of NGC 1624 selecting different control fields (the west region , or the south-west region , in Figure 1). The slope of the IMF was about and , respectively. Hence, the uncertainty arising from the subtraction of field interlopers has a negligible contribution to the slope.
Kroupa (2001) has presented a segmented IMF based on compiled data. In his alpha-plot, a non-negligible scatter was found in the mass range of 1 – 100 . The author attributed the cause of the scatter to dynamical effects and Poisson noise. It used to be believed that young open clusters were too young to have undergone dynamical mass segregation. However, a few young open clusters show clear signs of mass segregation, e.g. Arches cluster (Habibi et al., 2013), NGC 3603 (Pang et al., 2013), NGC 6231 (Raboud & Mermilliod, 1998; Sung et al., 2013b), ONC (Hillenbrand & Hartmann, 1998), Westerlund 1 (Gennaro et al., 2011; Lim et al., 2013), etc. Several studies, through multiple sets of numerical simulation, suggested that the mass segregation found in young clusters has a dynamical origin (McMillan et al., 2007; Moeckel & Bonnell, 2009; Allison et al., 2009, 2010). If dynamical evolution had efficiently operated within young clusters, a number of low-mass members would have evaporated into the outskirts of the cluster region. Consequently, one would expect the IMF to be biased toward bright stars, and therefore show a shallow slope. The steep slope of the IMF in this work is inconsistent with this expectation of the effects. Thus, the contribution of the dynamical effect may be less significant for the clusters.
The total number of members belonging to NGC 1624 and NGC 1931 is so small, that its measured IMF is vulnerable to stochastic effects. In order to test for this effect on the slope of the IMF, multiple sets of Monte Carlo simulation were conducted for three cases with the total number of cluster members (, 1,000, and 3,000). The Kroupa IMF (Kroupa, 2001) was used as the underlying IMF for stars with mass larger than 0.5 . The simulation for each case was made 10,000 times. The IMF of the model clusters was derived using the same procedure described as above. The size of the mass bin was set to , while a bin size of 1.0 was adopted for the highest mass bin if the number of stars with mass larger than 10 was smaller than 5. Figure 15 displays the distribution of with the total number of cluster members. The dispersion of the distribution appears to be large in model clusters with a small number of members, while the IMF of model clusters with a large number of members shows a higher consistency with the underlying IMF. However, the possibility that the IMF of a given cluster has a slope steeper than is only about 10 percent in the case of , and the likelihood decreases with the increase of the total number of cluster members. It implies that the possibility that the IMF of the two clusters in the present work exhibits a steeper slope than is about 1 percent. Therefore, the stochastic effect seems not to explain our results reasonably. Although the Kroupa/Salpeter IMF provides a representative slope of the stellar IMF in a given mass range, it remains to be seen whether the slope is universal or not. Future work on the IMF of small, young open clusters will observationally be used to examine this issue.
6 DISCUSSIONS ON THE AGE SPREAD OF PMS STARS
Palla & Stahler (1999, 2000, 2002) argued that the star formation activity within nearby SFRs has persisted for about 10 Myr and that the star formation rate may be accelerating in the present epoch, on timescales of 1 – 2 Myr. Later, Palla et al. (2005) found a significant depletion of lithium in four PMS members of the Orion Nebula Cluster (ONC), and the result supported their idea because it is known that most of lithium at the surface of stars with subsolar mass are destroyed on timescales of 10 Myr. On the other hand, Hartmann (2001, 2003) refuted the extended star formation timescale invoking the influences of binarity, variability, extinction, accretion activities, the inclusion of field interlopers, and the birthline effects of intermediate-mass stars. Jeffries et al. (2007) found a small age spread of 2.5 Myr for NGC 2169. There are still many debates on the age of PMS stars although the age distribution is thought to be a key to understanding the processes of cluster formation.
Only a small number of PMS stars were identified as members of NGC 1624, so we were unable to statistically investigate the age spread. The number of the PMS members found in NGC 1931 barely allowed us to study their age spread, although the membership is still incomplete. The age distribution of the PMS members shows a spread of 4.5 Myr. We attempted to interpret the observed age distribution. Several observational uncertainties affecting the and luminosity of PMS stars were considered, e.g. photometric errors, reddening correction, and variability. Hartmann (2003) pointed out that the inclusion of field interlopers can lead the observed age spread to be larger. However, we believe that most of the PMS stars identified in this work are bona-fide members of NGC 1931 because the membership selection criteria were based on the well-known observational properties of such stars together with the fundamental parameters of the cluster (see Section 3.2). Contamination by field interlopers was excluded as a consideration.
We assessed the contribution of the observational uncertainties to the age spread of PMS stars using a few sets of simple Monte-Carlo simulations. NGC 1931 probably comprises more than 600 stars according to the integration of the IMF. We set the number of artificial PMS stars to 600. The underlying IMF was assumed to be our result () in the mass range of 0.5 to 5 . The age of the stars was set to be 1.5 Myr (the peak age of NGC 1931) with no intrinsic age spread. Based on the PMS evolutionary models of Siess et al. (2000) artificial PMS stars were generated. and luminosity were converted into magnitude and color using the relations of Bessell (1995) and Bessell et al. (1998). We introduced photometric errors with a similar distribution to the observed one. The distribution of reddening was assumed to be a normal distribution, where the mean reddening and dispersion were set to be 0.74 and 0.17 mag, respectively. In order to reproduce the extinction in the band we adopted the segmented reddening law as shown in Section 3.4 [ mag, , and ]. We re-analyzed the photometric data of the artificial stars to investigate their age spread after correcting for the mean reddening. Figure 16 displays the result of the Monte-Carlo simulation. The resulting age spread of the artificial stars was about 0.8 Myr although the age of a few PMS stars was overestimated. Hence, the photometric errors and the uncertainty in the reddening correction may not be enough to explain the observed age spread (4.5 Myr).
The color variability of PMS stars can also increase the age spread because the position of the stars in the HRD is very sensitive to . We investigated the variation of their physical quantities in the HRD using the data observed at two different epochs. The variable PMS stars identified in this work changed by -1.2 – 1.5 mag in and -0.5 – 0.5 mag in over the 1.2 years. The variation in appeared larger than that in . This aspect may be related to accretion activities, as well as to variable reddening by surrounding material (Basri & Batalha, 1990; Grankin et al., 2007). Figure 17 shows the HRD of the variable PMS stars. Assuming that the variation of reddening in the line of sight is negligible on a timescale of 1 year, we examined the change in age. The intermediate-mass PMS star ID 727 (the most luminous star in the HRD) varied the most in and luminosity over the 1.2 years. As a result of this variation, the apparent age changed by 2 – 3 Myr. Some low-mass stars also revealed as large an age variation although the change in the physical quantities was not as large as those of the star ID 727. This is because the resolution for distinguishing the age of PMS stars becomes low in the low-mass regime of the HRD. Consequently, the variability of PMS stars very likely contributes to the observed age spread.
The fraction of PMS variables is at least 4.6 percent (16/351), where the total number of PMS stars (denominator) down to our detection limit ( mag) was estimated from integration of the IMF. This value is likely a lower limit. We expect more PMS variables to exist in the cluster because stars varying on much shorter or longer timescales may not have been identified in our observations. A couple of Monte-Carlo simulations were performed assuming that 30 and 50 percent of the PMS members are variable. The variation in and was set to have a normal distribution with the same dispersion as the observed one. The photometric errors and reddening were treated with the same procedure as above. If we assume a variable fraction of 30 percent, the resultant age spread was about 1.5 Myr. A spread of 2.6 Myr was found for a variable fraction of 50 percent. These simple simulations showed that the variability of PMS stars can contribute a portion of the observed age spread. However, additional sources may still be required to explain the observed spread of 4.5 Myr.
We briefly mentioned in Section 3.3 that the structure of NGC 1931 may have resulted from its star formation history. If star formation propagated in a specific direction, one could expect there to be a correlation between the location and age of PMS stars. A systematic age variation on a few parsec scale has been found in the young open cluster NGC 1893 (Sharma et al., 2007; Pandey et al., 2013b; Lim et al., 2014b). Such a star formation history can influence the age spread of PMS stars. We investigated the age variation along the declination axis, as the cluster is elongated in the north-south direction (Figure 8). PMS members with masses larger than 1.5 were excluded from this analysis because evolutionary models for intermediate-mass PMS stars are likely to overestimate the age of the stars (Sung et al., 1997, 2004; Hartmann, 1999). We considered only stars younger than 4 Myr to find their age variation clearly. Figure 18 shows the age variation of the PMS members with declination. The age appears to decline with the increase in declination. It implies that star formation has propagated from south to north with a projected velocity of 6.8 km s-1 according to the slope of the age variation. The maximum age difference between the stars in the northern and southern groups is about 0.7 Myr, on average. Hence, the star formation history in NGC 1931 seems to contribute a small portion of the observed age spread. In conclusion, a genuine age spread of PMS members is required to explain the observed age spread, however the size of the spread may not be as large as the timescale ( Myr) argued by Palla & Stahler (2000, 2002).
7 SUMMARY
NGC 1624 and NGC 1931 are small, young, open clusters in the direction of the Galactic anticenter. These clusters are helpful in studying the property of star formation in a different environment from the solar neighbourhood. We performed and H photometry for the clusters as part of the SOS project. This work provided homogeneous photometric data as well as the comprehensive results for the clusters.
The members of the clusters were selected using various criteria. For NGC 1624, we found 14 early-type and 14 PMS members (3 variable, 3 UV excess emission, and 9 H emission stars and candidates) from photometric criteria and H photometry. On the other hand, 14 early-type and 71 PMS stars (16 variable, 4 UV excess emission, 54 MIR excess emission, and 27 H emission stars and candidates) were identified as the members of NGC 1931 using photometric criteria, H photometry, and the GLIMPSE360 catalog.
The reddening of individual early-type members was determined from the () TCD. The mean reddening was mag for NGC 1624 and mag for NGC 1931. The reddening law toward the clusters was examined using various color excess ratios from the optical to NIR passbands (to MIR passbands for NGC 1931). We confirmed that the reddening law toward and in NGC 1624 is normal. On the other hand, the early-type members of NGC 1931 exhibited color excess ratios that far deviated from the normal reddening. It implies that the size distribution of dust grains in the NGC 1931 ICM is somewhat different from that found in the general diffuse ISM. The ratio of total-to-selective extinction for the ICM of NGC 1931 was estimated to be , indicating that the evolution of dust grains is still ongoing.
We carried out ZAMS fitting to the reddening-independent CMDs of the early-type members. As a result, NGC 1624 was found to be kpc far away from the Sun, and probably located in the outer arm. The distance to NGC 1931 was about kpc, which places the cluster in the Perseus arm. Reddening-corrected CMDs were converted to the HRD using the published temperature scales and bolometric correction (Bessell, 1995; Bessell et al., 1998; Sung et al., 2013a). We performed isochrone fitting to the HRD of the clusters. A turn-off age of NGC 1624 was estimated to be 4 Myr, and the PMS members are likely to be younger than 4 Myr. The star ID 1773 associated with the UCHII region turned out to be a very young PMS star with a high mass accretion rate of . The most luminous star in NGC 1931 seems to be a very young star with an accretion disk given that the photometric properties were similar to those of Walker 90 in NGC 2264. Thus, the age of the star is likely to be 1.6 – 3.0 Myr. We found a median age of 2 Myr with a spread of 4.5 Myr for the age distribution of the PMS members.
Finally, we derived the IMF of the clusters and determined the slope in the high-mass regime (). The slope was for NGC 1624 and for NGC 1931, respectively. These results were somewhat different from the Salpeter/Kroupa IMF. We attributed the steeper slope to a stochastic effect, the small number of stars in the highest mass bin (), and the assumed upper limit of stellar mass. The IMF of the clusters exhibits a very similar shape to that of the well-studied young open cluster NGC 2264 (Sung & Bessell, 2010). It implies that the property of star formation in the clusters may not be far different from that in nearby SFRs.
References
- Adams et al. (2001) Adams, J. D., Stauffer, J. R., Monet, D. G., Skrutskie, M. F., & Beichman, C. A. 2001, AJ, 121, 2053
- Allison et al. (2010) Allison, R. J., Goodwin, S. P., Parker, R. J., Portegies Zwart, S. F., & de Grijs, R. 2010, MNRAS, 407, 1098
- Allison et al. (2009) Allison, R. J., Goodwin, S. P., Parker, R. J., et al. 2009, ApJ, 700, L99
- Basri & Batalha (1990) Basri, G., & Batalha, C. 1990, ApJ, 363, 654
- Bastian et al. (2010) Bastian N., Covey K. R., & Meyer M. R., 2010, ARA&A, 48, 339
- Bertout et al. (1988) Bertout, C., Basri, G., & Bouvier, J. 1988, ApJ, 330, 350
- Bessell (1990) Bessell, M. S. 1990, PASP, 102, 1181
- Bessell (1995) Bessell, M. S., 1995, in Proc. ESO Workshop, The Bottom of the Main Sequence and Beyond, ed. C. G. Tinney (Berlin:Springer), 123
- Bessell et al. (1998) Bessell, M. S., Castelli, F., & Plez B., 1998, A&A, 333, 231
- Bhatt et al. (1994) Bhatt, B. C., Pandey, A. K., Mahra, H. S., & Paliwal, D. C. 1994, BASI, 22, 291
- Bonatto & Bica (2009) Bonatto, C., & Bica, E. 2009, MNRAS, 397, 1915
- Brott et al. (2011) Brott, I., de Mink, S. E., Cantiello, M., et al. 2011, A&A, 530, 1115
- Calvet & Gullbring (1998) Calvet, N., & Gullbring, E. 1998, ApJ, 509, 802
- Caramazza et al. (2008) Caramazza, M., Micela, G., Prisinzano, L., et al. 2008, A&A, 488, 211
- Caramazza et al. (2012) Caramazza M., Micela G., Prisinzano L., et al. 2012, A&A, 539, 74
- Chini & Wink (1984) Chini, R., & Wink, J. E. 1984, A&A, 139, 5
- Clark et al. (2005) Clark, J. S., Negueruela, I., Crowther, P. A., & Goodwin. S. P. 2005, A&A, 434, 949
- Deharveng et al. (2008) Deharveng, L., Lefloch, B., Kurtz, S., et al. 2008, A&A, 482, 585
- Dias & Lépine (2005) Dias, W. S., & Lépine. J. R. D. 2005, ApJ, 629, 825
- Ekström et al. (2012) Ekström, S., Georgy, C., Eggenberger, P., et al., 2012, A&A, 537, 146
- Elmegreen et al. (2000) Elmegreen, B. G., Efremov, Y., Pudritz, R. E., & Zinnecker, H. 2000, in Protostars and Planets IV, ed. V. Mannings, A. P. Boss, & S. S. Russell (Tucson: Univ. Arizona Press), 179
- Eswaraiah et al. (2011) Eswaraiah C., Pandey A. K., Maheswar G., et al. 2011, MNRAS, 411, 1418
- Evans et al. (2010) Evans, I. N., Primini, F. A., Glotfelty, K. J., et al. 2010, ApJS, 189, 37
- Fitzpatrick & Massa (2007) Fitzpatrick, E. L., & Massa, D. 2007, ApJ, 663, 320
- Gennaro et al. (2011) Gennaro, M., Brandner, W., Stolte, A., & Henning, Th. 2011, MNRAS, 412, 2469
- Glushkov et al. (1975) Glushkov, Y. I., Denisyuk, E. K., & Karyagina, Z. V. 1975, A&A, 39, 481
- Goodwin & Bastian (2006) Goodwin, S. P., & Bastian, N. 2006, MNRAS, 373, 752
- Grankin et al. (2007) Grankin, K. N., Melnikov, S. Y., Bouvier, J., Herbst, W., & Shevchenko, V. S. 2007, A&A, 461, 183
- Greve (2010) Greve, A. 2010, A&A, 518, 62
- Guetter & Vrba (1989) Guetter, H. H., & Vrba, F. J. 1989, AJ, 98, 611
- Gullbring et al. (1998) Gullbring, E., Hartmann, L., Briceño, C., & Calvet, N. 1998, ApJ, 492, 323
- Gutermuth et al. (2008) Gutermuth, R. A., Myers, P. C., Megeath, S. T., et al. 2008, ApJ, 674, 336
- Gutermuth et al. (2009) Gutermuth, R. A., Megeath, S. T., Myers, P. C., et al. 2009, ApJS, 184, 18
- Habibi et al. (2013) Habibi, M., Stolte, A., Brandner, W., Hußmann, B., & Motohara, K. 2013, A&A, 556, 26
- Hartmann (1999) Hartmann, L. 1999, NewA Rev., 43, 1
- Hartmann (2001) Hartmann, L. 2001, AJ, 121, 1030
- Hartmann (2003) Hartmann, L. 2003, ApJ, 585, 398
- Hillenbrand & Hartmann (1998) Hillenbrand, L. A., & Hartmann, L. W. 1998, ApJ, 492, 540
- Hur et al. (2014) Hur, H., Park, B.-G., Sung, H., et al. 2014, MNRAS, 446, 3797
- Hur et al. (2012) Hur, H., Sung, H., & Bessell, M. S. 2012, AJ, 143, 41
- Im et al. (2010) Im, M., Ko J., Cho, Y., Choi, C., Jeon, Y., Lee, I., & Ibrahimov, M. 2010, J. Korean Astron. Soc., 43, 75
- Jeffries et al. (2007) Jeffries, R. D., Oliveira, J. M., Naylor, T., Mayne, N. J., & Littlefair, S. P. 2007, MNRAS, 376, 580
- Johnson & Hiltner (1956) Johnson, H. L., & Hiltner, W. A. 1956, ApJ, 123, 267
- Jose et al. (2011) Jose, J., Pandey, A. K., Ogura, K., et al. 2011, MNRAS, 411, 2530
- Jose et al. (2008) Jose, J., Pandey, A. K., Ojha, D. K., et al. 2008, MNRAS, 384, 1675
- Kraus & Hillenbrand (2007) Kraus, A. L., & Hillenbrand, L. A. 2007, AJ, 134, 2340
- Kilkenny et al. (1998) Kilkenny, D., van Wyk, F., Roberts, G., Marang, F., & Cooper, D. 1998, MNRAS, 294, 93
- Koenig et al. (2008) Koenig, X. P., Allen, L. E., Gutermuth, R. A., Hora, J. L., Brunt, C. M., & Muzerolle, J. 2008, ApJ, 688, 1142
- Kook et al. (2010) Kook, S.-H., Sung, H., & Bessell, M. S. 2010, J. Korean Astron. Soc., 43, 141
- Kroupa (2001) Kroupa P., 2001, MNRAS, 322, 231
- Kroupa (2002) Kroupa P., 2002, Science, 295, 82
- Königl (1991) Königl, A. 1991, ApJ, 370, 39
- Lada & Lada (2003) Lada, C., & Lada, E. 2003, ARA&A, 41, 57
- Landolt (1992) Landolt, A. U. 1992, AJ, 104, 340
- Lim et al. (2013) Lim, B., Chun, M.-Y., Sung, H., et al. 2013, AJ, 145, 46
- Lim et al. (2009) Lim, B., Sung, H., Bessell, M. S., Karimove, R., & Ibrahimov, M. 2009, J. Korean Astron. Soc., 42, 161
- Lim et al. (2011) Lim, B., Sung, H., Karimov, R., & Ibrahimov, M. 2011, J. Korean Astron. Soc., 44, 39
- Lim et al. (2008) Lim, B., Sung, H., Karimov, R., & Ibrahimov, M. 2008, Pub. of the Korean Astron. Soc., 23, 1
- Lim et al. (2014a) Lim, B., Sung, H., Kim, J. S., Bessell, M. S., & Karimov, R., 2014, MNRAS, 438, 1451
- Lim et al. (2014b) Lim, B., Sung, H., Kim, J. S., Bessell, M. S., & Park, B.-G. 2014, MNRAS, 443, 454
- Magnier & Cuillandre (2004) Magnier, E. A., & Cuillandre, J.-C. 2004, PASP, 116, 449
- Martins & Palacios (2013) Martins, F., & Palacios, A. 2013, A&A, 560, 16
- Massey (2013) Massey, P. 2013, New A, 57, 14
- McMillan et al. (2007) McMillan, S. L. W., Vesperini, E., & Portegies Zwart, S. F. 2007, ApJ, 655, L45
- Menzies et al. (1991) Menzies, J. W., Marang, F., Laing, J. D., Coulson, I. M., Engelbrecht, C. A. 1991, MNRAS, 248, 642
- Moeckel & Bonnell (2009) Moeckel, N., & Bonnell, I. A. 2009, MNRAS, 400, 657
- Moffat et al. (1979) Moffat, A. F. J., Fitzgerald, M. P., & Jackson, P. D. 1979, A&AS, 38, 197
- Offner et al. (2014) Offner, S. S. R., Clark, P. C., Hennebelle, P., et al. 2013, in Protostars and Planets VI, eds. H. Beuther, et al.(Tucson: University of Arizona Press), in press (arXiv:1312.5326)
- Palla et al. (2005) Palla F., Randich S., Flaccomio E., & Pallavicini R. 2005, ApJ, 626, L49
- Palla & Stahler (1999) Palla, F., & Stahler, S. W. 1999, ApJ, 525, 772
- Palla & Stahler (2000) Palla, F., & Stahler, S. W. 2000, ApJ, 540, 255
- Palla & Stahler (2002) Palla, F., & Stahler, S. W. 2002, ApJ, 581, 1194
- Pandey et al. (2013a) Pandey, A. K., Eswaraiah, C., Sharma, S., et al. 2013a, ApJ, 764, 172
- Pandey et al. (2013b) Pandey, A. K., Samal, M. R., Chauhan, N., et al. 2013b, New A, 19, 1
- Pandey et al. (2003) Pandey, A. K., Upadhyay, K., Nakada, Y., & Ogura, K. 2003, A&A, 397, 191
- Pandey & Mahra (1986) Pandey, A. K., & Mahra, H. S. 1986, Ap&SS, 120, 107
- Pang et al. (2013) Pang, X., Grebel, E. K., Allison, R., et al. 2013, ApJ, 764, 73
- Park et al. (2000) Park, B.-G., Sung, H., Bessell, M. S., & Kang, Y. H. 2000, AJ, 120, 894
- Park & Sung (2002) Park, B.-G., & Sung, H. 2002, AJ, 123, 892
- Pérez et al. (2008) Pérez, M. R., McCollum, B., van den Ancker, M. E., & Joner, M. D. 2008, A&A, 486, 533
- Porras et al. (2003) Porras, A., Christopher, M., Allen, L., et al. 2003, AJ, 126, 1916
- Raboud & Mermilliod (1998) Raboud, D., & Mermilliod, J.-C. 1998, A&A, 333, 897
- Rebull et al. (2000) Rebull, L. M., Hillenbrand, L. A., Strom, S. E., et al. 2000, AJ, 119, 3026
- Robin et al. (2003) Robin, A. C., Reylé C., Derriére, S., & Picaud, S. 2003, A&A, 409, 523
- Salpeter (1955) Salpeter E. E., 1955, ApJ, 121, 161
- Sana et al. (2012) Sana, H., de Mink, S. E., de Koter, A., et al. 2012, Sci, 337, 444
- Serkowski et al. (1975) Serkowski, K., Mathewson, D. S., & Ford, V. L. 1975, ApJ, 196, 261
- Sharma et al. (2007) Sharma S., Pandey A. K., Ojha D. K., et al. 2007, MNRAS, 380, 114
- Sicilia-Aguilar et al. (2004) Sicilia-Aguilar, A., Hartmann, L. W., Briceño, C., Muzerolle, J., & Calvet, N. 2004, AJ, 128, 805
- Siess et al. (2000) Siess, L., Dufour, E., Forestini, M. 2000, A&A, 358, 5931
- Skrutskie et al. (2006) Skrutskie, M. F., et al. 2006, AJ, 131, 1163
- Sota et al. (2011) Sota A., Apellániz J. M., Walborn N. R., et al. 2011, ApJS, 193, 24
- Sujatha & Babu (2006) Sujatha, S., & Babu, G.S.D. 2006, Ap&SS, 305, 399
- Sung & Bessell (2000) Sung, H., & Bessell, M. S. 2000, PASA, 17, 244
- Sung & Bessell (2004) Sung, H., & Bessell, M. S. 2004, AJ, 127, 1014
- Sung & Bessell (2010) Sung, H., & Bessell, M. S. 2010, AJ, 140, 2070
- Sung & Bessell (2014) Sung, H., & Bessell, M. S. 2014, in ASP Conf. Ser. 482, the 10th Pacific Rim Conference on Stellar Astrophysics, ed. H.-W. Lee, Young Woon Kang, and Kam-Ching Leung (San Francisco, CA: ASP), 275
- Sung et al. (2004) Sung, H., Bessell, M. S., & Chun, M.-Y. 2004, AJ, 128, 1684
- Sung et al. (2008) Sung, H., Bessell, M. S., Chun, M.-Y., Karimov, R., & Ibrahimov, M. 2008, AJ, 135, 441
- Sung et al. (1999) Sung, H., Bessell, M. S., Lee, H.-W., Kang, Y. H., & Lee, S.-W. 1999, MNRAS, 310, 982
- Sung et al. (1997) Sung H., Bessell M. S., & Lee S.-W. 1997, AJ, 114, 2644
- Sung et al. (1998) Sung, H., Bessell, M. S., & Lee, S.-W. 1998, AJ, 115, 734
- Sung et al. (2000) Sung, H., Chun, M.-Y., & Bessell, M. S. 2000, AJ, 120, 333
- Sung & Lee (1995) Sung, H., & Lee, S.-W. 1995, J. Korean Astron. Soc., 28, 119
- Sung et al. (2013a) Sung, H., Lim, B., Bessell, M. S., et al. 2013a, J. Korean Astron. Soc., 46, 103 (Paper 0)
- Sung et al. (2013b) Sung, H., Sana, H., & Bessell, M. S. 2013b, AJ, 145, 37
- Sung et al. (2009) Sung, H., Stauffer, J. R., Bessell, M. S. 2009, AJ, 138, 1116
- Susa et al. (2014) Susa, H., Hasegawa, K., & Tominaga, N. 2014, ApJ, 792, 32
- Tutukov (1978) Tutukov, A. V. 1978, A&A, 70, 57
- Uchida & Shibata (1985) Uchida, Y., & Shibata, K. 1985, PASJ, 37, 515
- Wade et al. (2012) Wade, G. A., Apellániz, J. M., Martins, F., et al. 2012, MNRAS, 425, 1278
- Walborn et al. (2010) Walborn, N. R., Sota, A., Maíz Apellániz, J., et al. 2010, ApJ, 711, L143
- Whitney et al. (2008) Whitney, B., Arendt, R., Babler, B., et al. 2008, in Spitzer Proposal ID #60020
- Whitney et al. (2011) Whitney, B., Benjamin, R., Meade, M., et al. 2011, BAAS, 43, 241.16
- Whittet (1977) Whittet, D. C. B. 1977, MNRAS, 180, 29
- Yong et al. (2012) Yong, D., Carney, B. W., & Friel, E. D. 2012, AJ, 144, 95
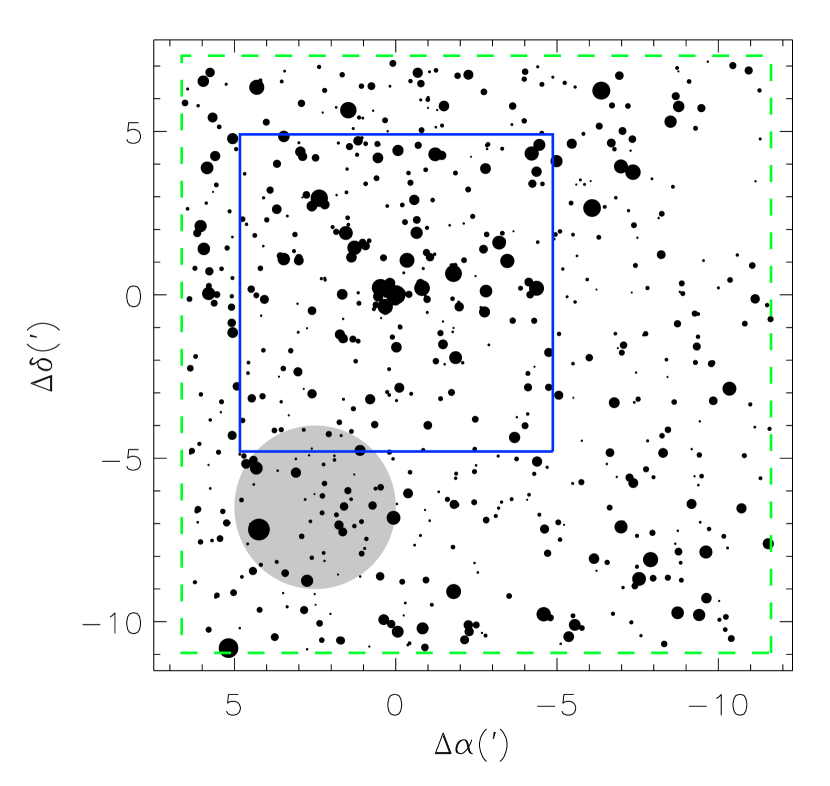
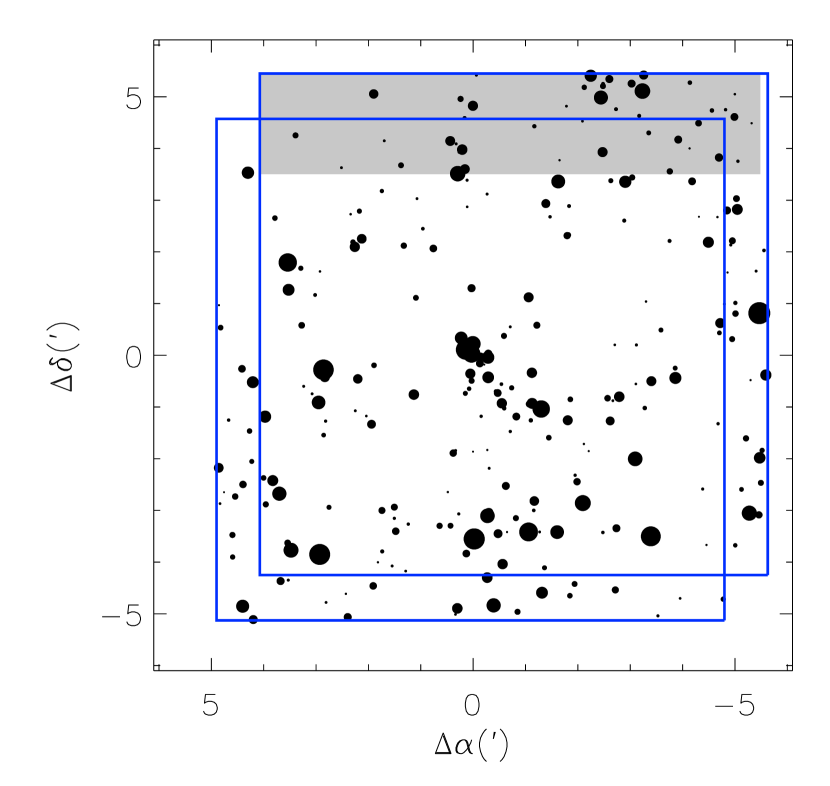
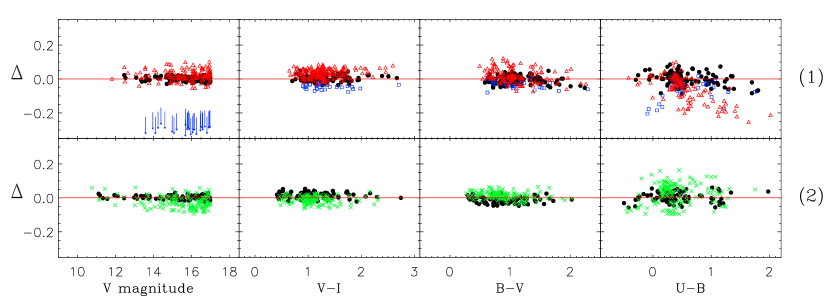
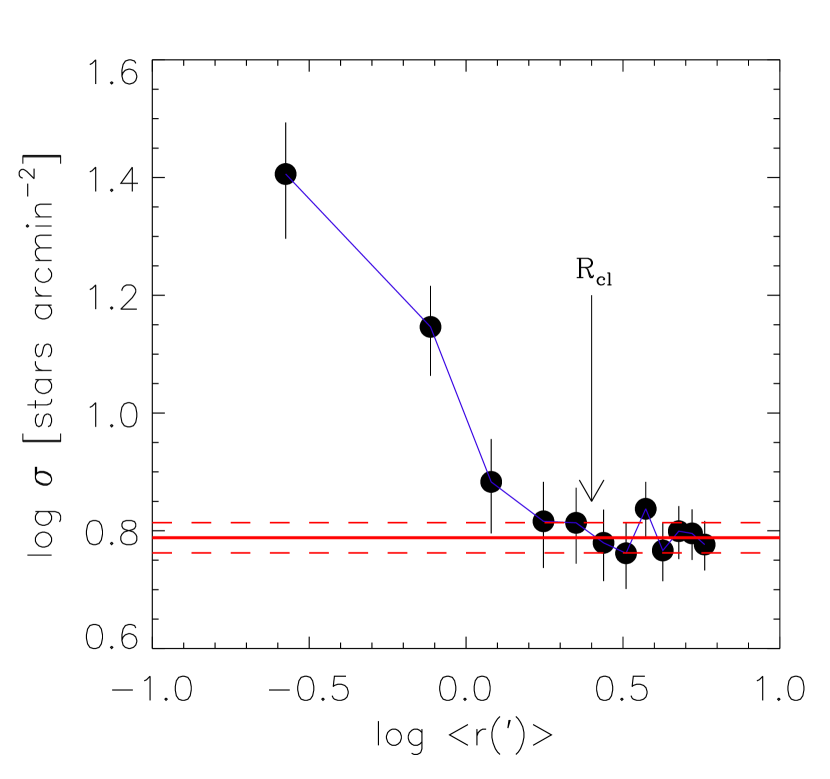
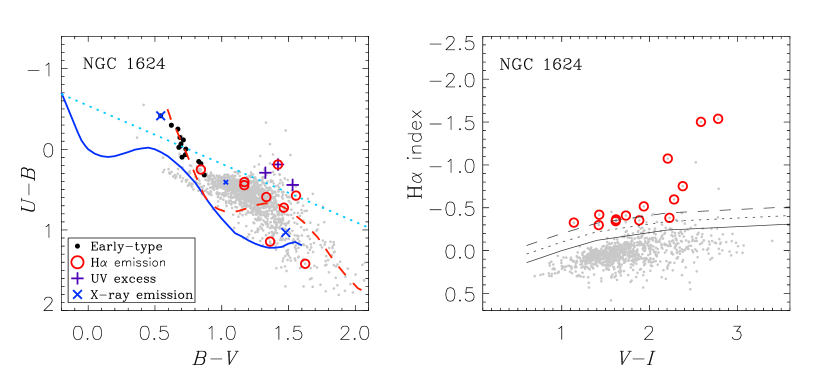
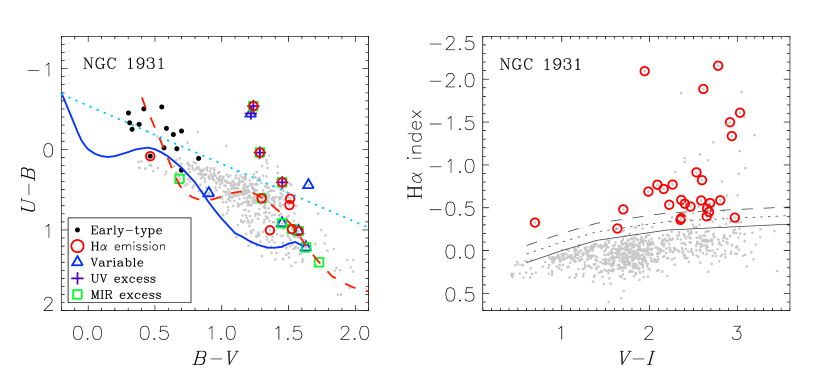
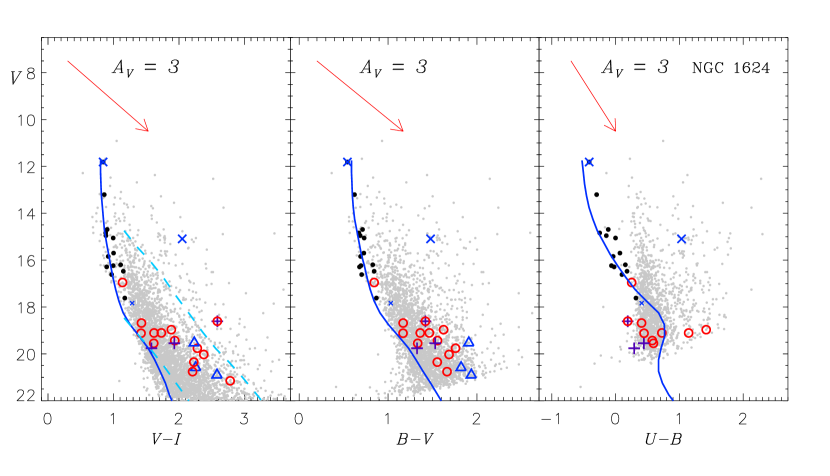
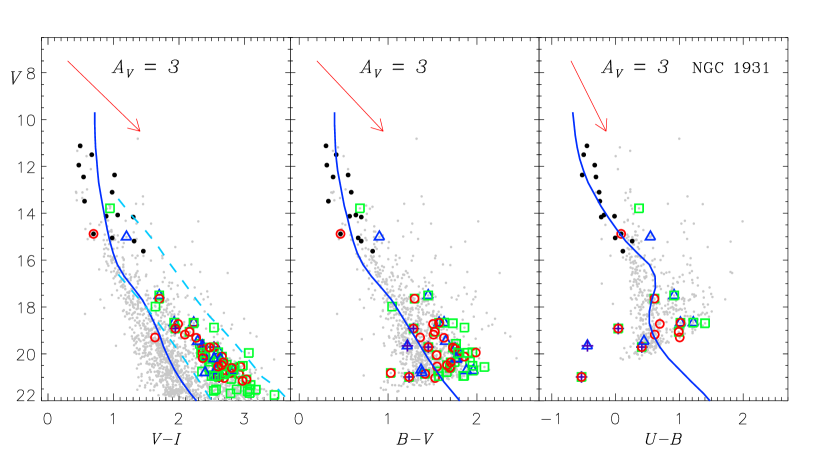
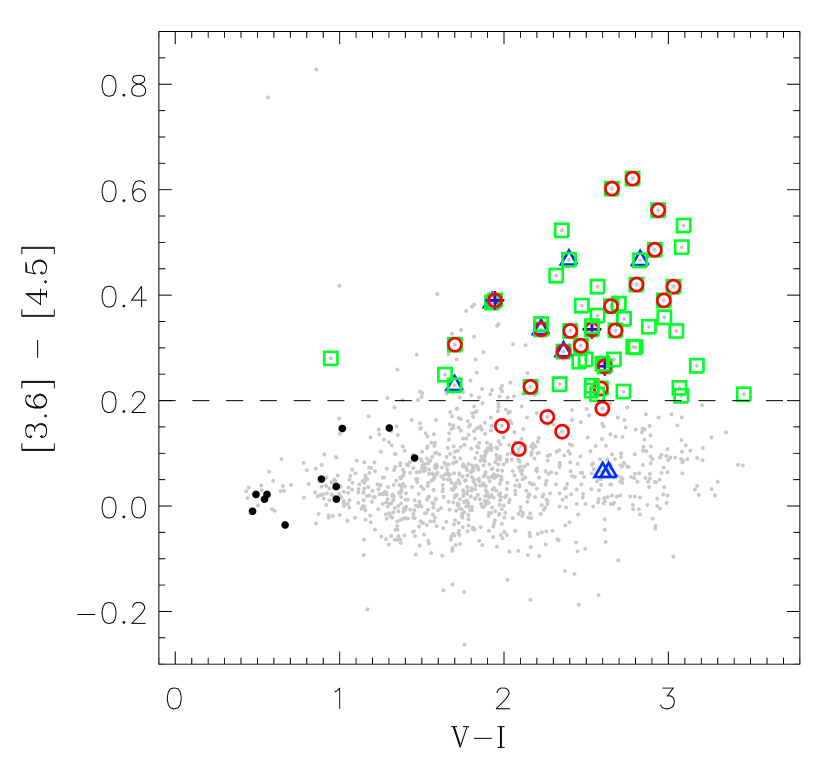
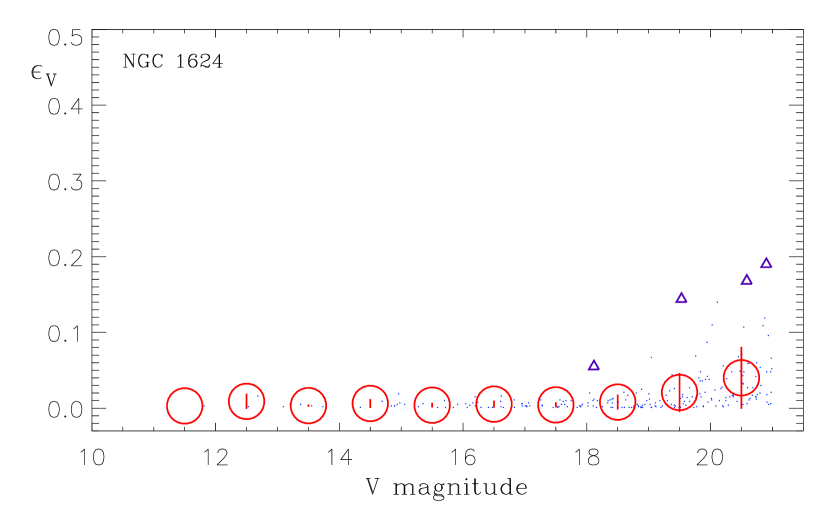
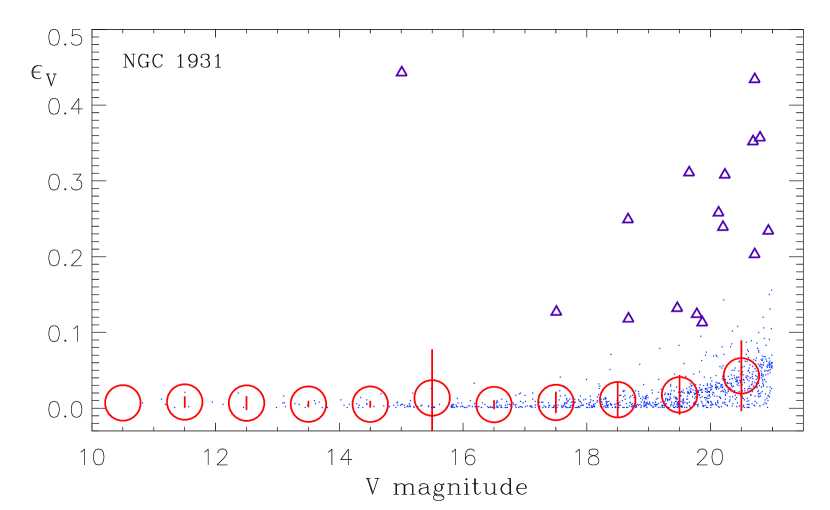
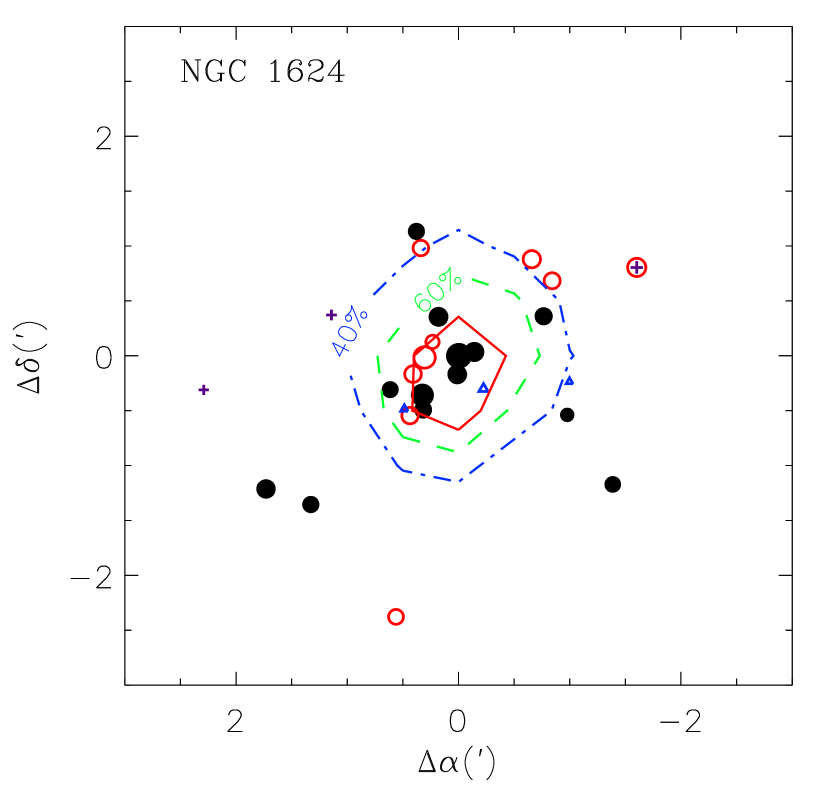
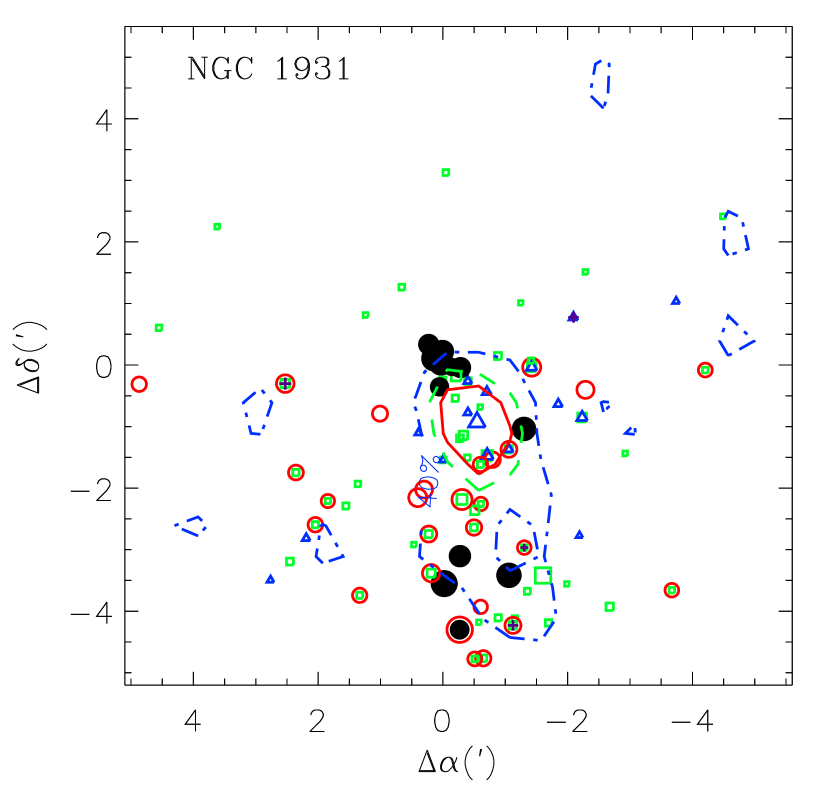
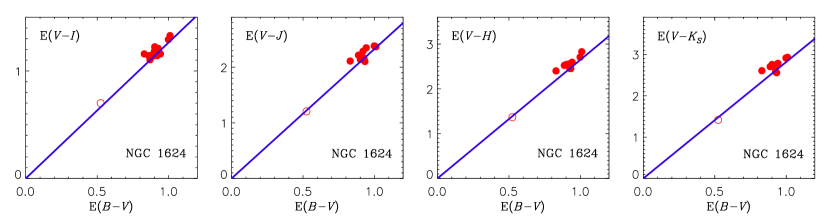
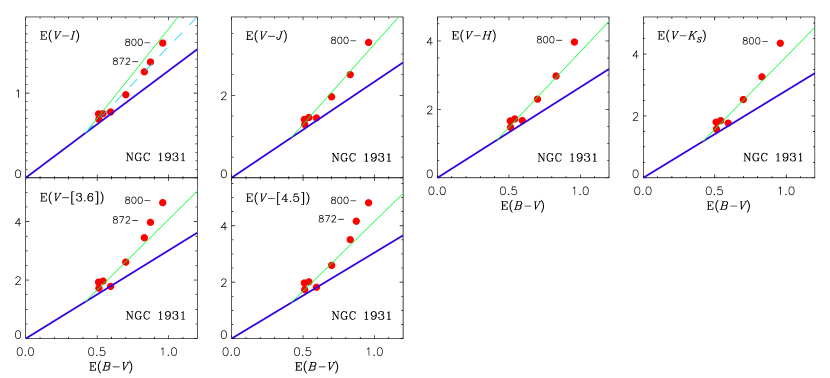
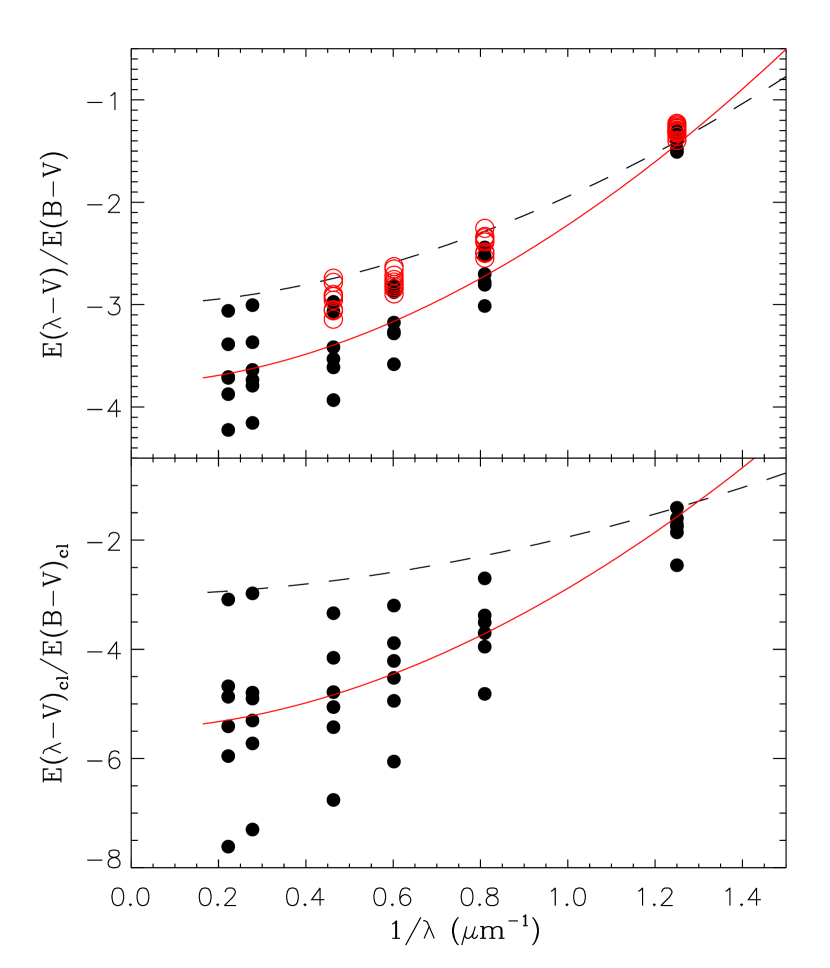
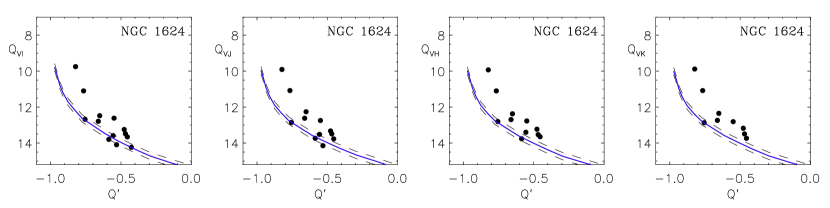
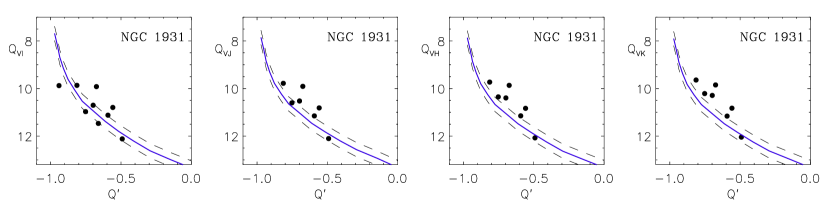
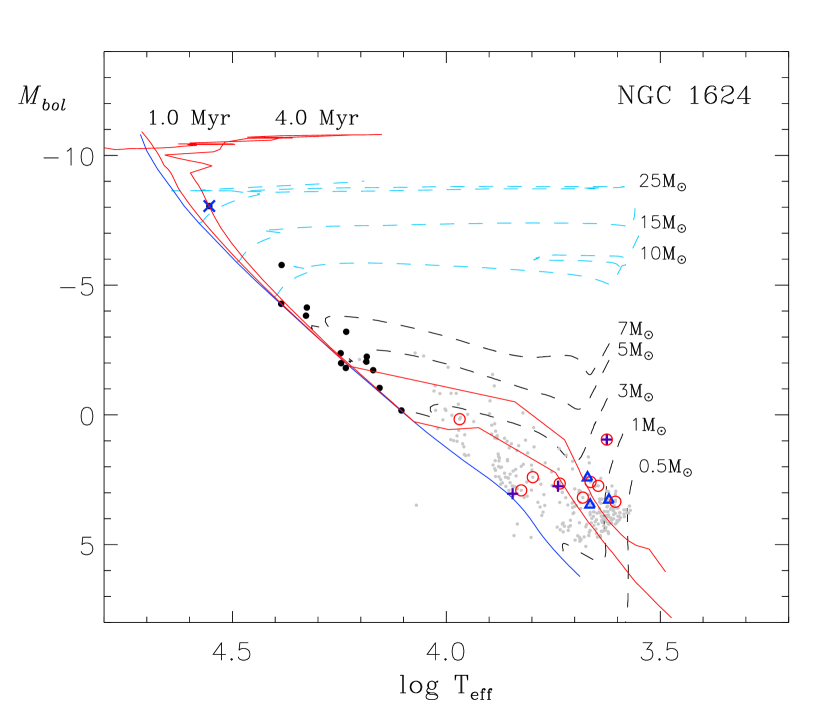
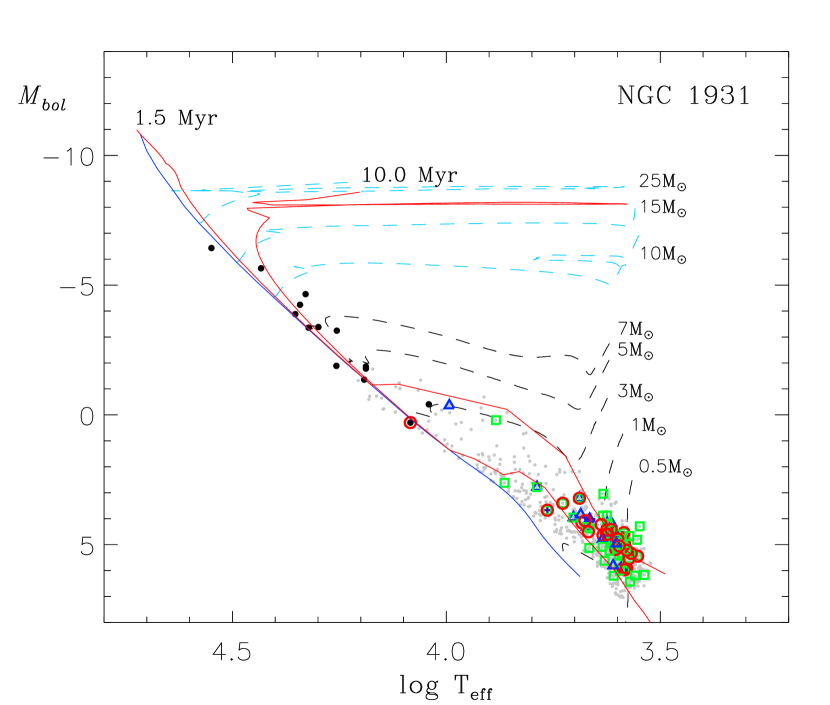

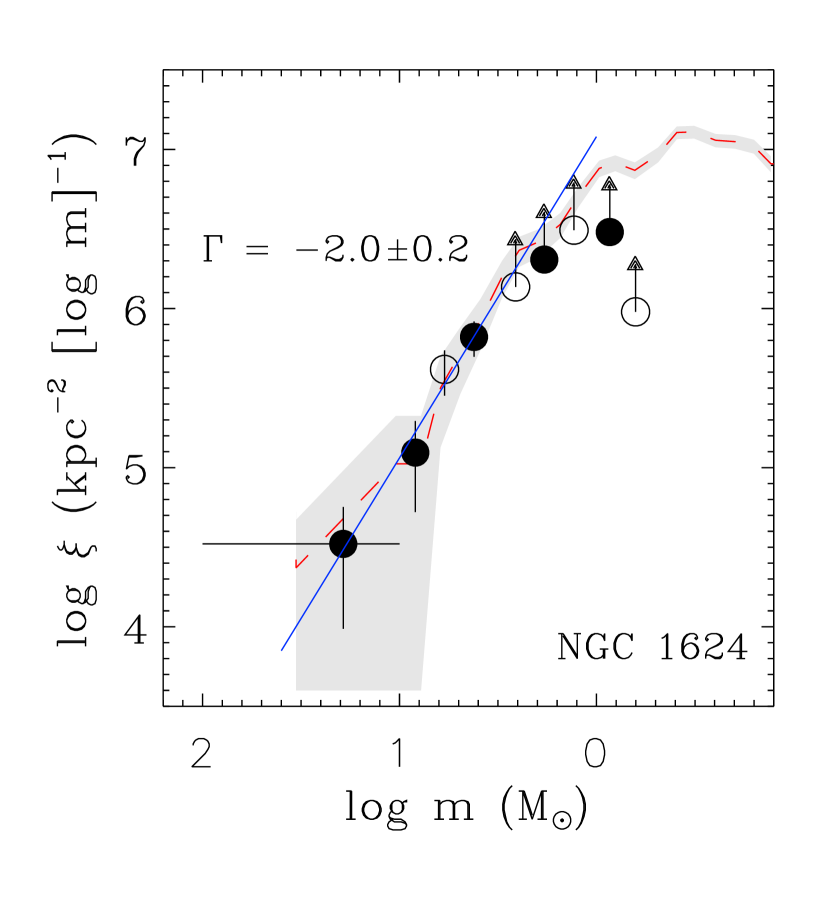
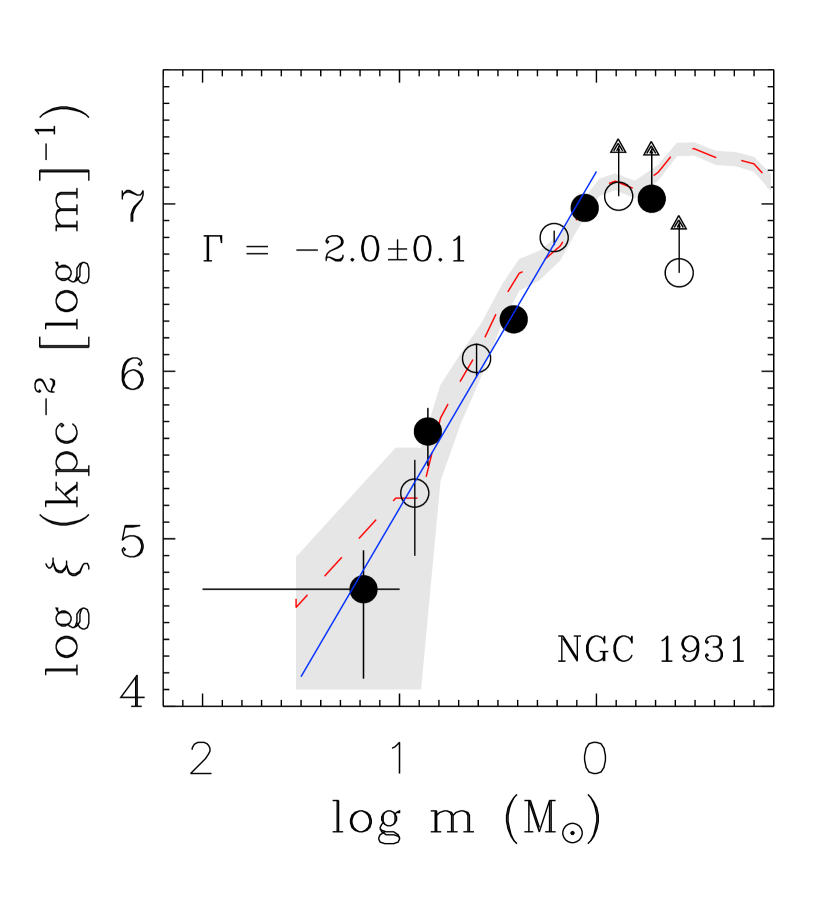

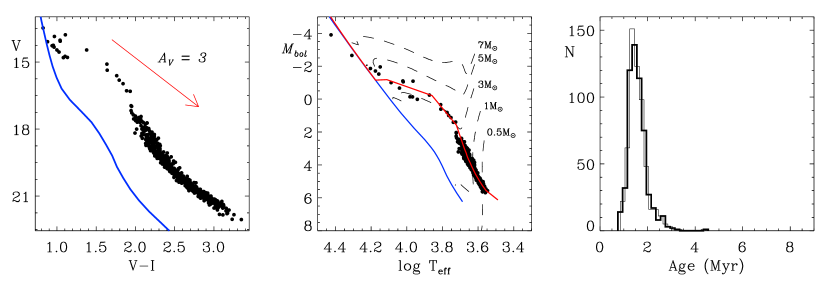
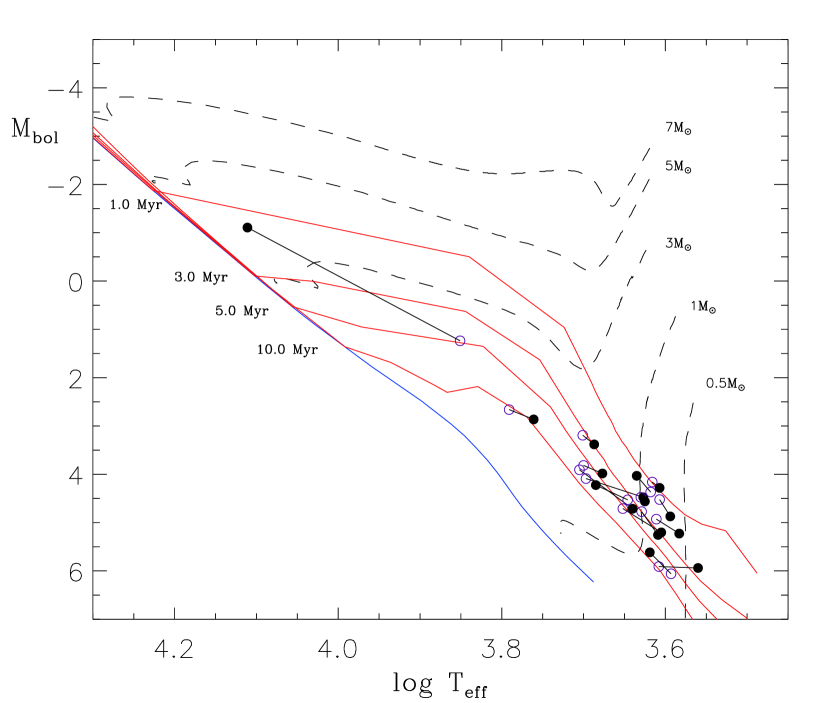
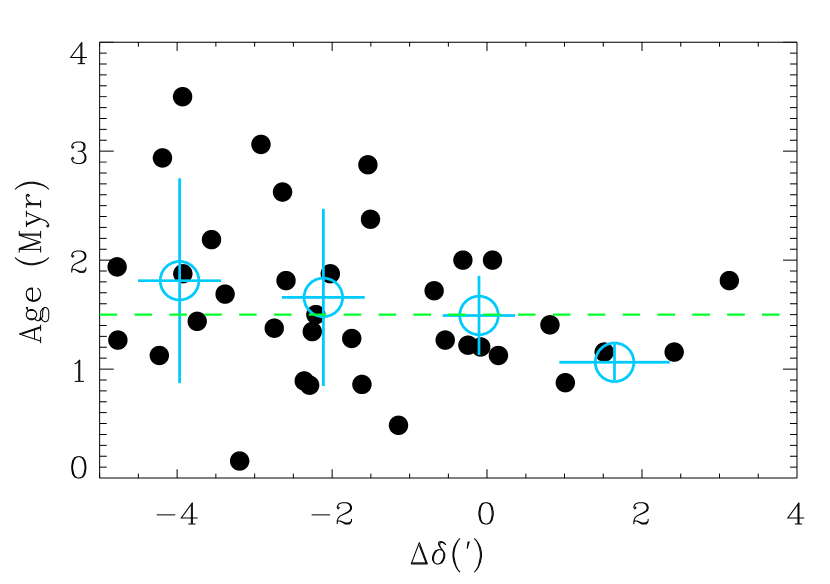
| Target | Date | Filter | Exposure time |
|---|---|---|---|
| Maidanak Astronomical Observatory | |||
| NGC 1624 | 2006.11.24. | 3s, 60s | |
| 3s, 180s | |||
| 5s, 300s | |||
| 15s, 600s | |||
| Steward Observatory | |||
| NGC 1624 | 2011.10.29. | 5s, 60s | |
| 5s, 180s | |||
| 7s, 300s | |||
| 15s, 600s | |||
| H | 30s, 600s | ||
| NGC 1931 | 2011.10.29. | 5s, 60s | |
| 5s, 180s | |||
| 7s, 300s | |||
| 15s, 600s | |||
| H | 30s, 600s | ||
| 2013.02.05. | 5s, 180s | ||
| 5s, 180s | |||
| 7s, 300s | |||
| 30s, 600s |
| Date | filter | (mag) | ||
|---|---|---|---|---|
| 2006.11.24. | ||||
| 2011.10.29. | ||||
| H | 19.549 | |||
| 2013.02.05 | ||||
| Paper | 11This - Others | N(m)22N and m indicates the number of compared stars and excluded stars | ()11This - Others | N(m)22N and m indicates the number of compared stars and excluded stars | (B V)11This - Others | N(m)22N and m indicates the number of compared stars and excluded stars | ()11This - Others | N(m)22N and m indicates the number of compared stars and excluded stars |
|---|---|---|---|---|---|---|---|---|
| NGC 1624 | ||||||||
| This (MAO - SO | 121(5) | 124(2) | 123(3) | 120(5) | ||||
| Sujatha & Babu (2006) | 29(5) | 29(5) | 31(3) | 31(3) | ||||
| Jose et al. (2011) | 125(5) | 180(10) | 129(1) | 106(13) | ||||
| NGC 1931 | ||||||||
| This (SOFeb - SOOct) | 92(15) | 102(5) | 96(11) | 97(7) | ||||
| Pandey et al. (2013a) | 142(12) | 136(20) | 141(13) | 136(1) |
| ID | aa represents the H index [] | Nobs | 2MASSID | H bbH: H emission stars; h: H emission star candidates | |||||||||||||
|---|---|---|---|---|---|---|---|---|---|---|---|---|---|---|---|---|---|
| 2325 | 04 40 39.03 | +50 34 39.2 | 21.479 | 19.533 | 1.931 | 1.367 | 0.091 | 0.086 | 0.125 | 0.194 | 1 1 1 1 0 0 | - | - | ||||
| 2326 | 04 40 39.05 | +50 28 24.4 | 18.969 | 17.068 | 1.883 | 1.625 | 1.419 | -0.353 | 0.010 | 0.002 | 0.023 | 0.056 | 0.176 | 0.057 | 3 5 3 2 1 2 | 04403905+5028245 | h |
| 2327 | 04 40 39.07 | +50 27 15.1 | 18.484 | 0.030 | 0 2 0 0 0 0 | - | - | ||||||||||
| 2328 | 04 40 39.08 | +50 27 13.4 | 19.119 | 0.226 | 0 2 0 0 0 0 | - | - | ||||||||||
| 2329 | 04 40 39.08 | +50 30 41.7 | 21.374 | 19.444 | 1.858 | 1.138 | 0.085 | 0.004 | 0.060 | 0.113 | 2 3 2 1 0 0 | - | - | ||||
| 2330 | 04 40 39.10 | +50 25 35.9 | 19.491 | 17.965 | 1.518 | 1.261 | 0.658 | -0.145 | 0.001 | 0.001 | 0.005 | 0.018 | 0.054 | 0.061 | 2 3 2 2 2 1 | 04403910+5025356 | - |
| 2331 | 04 40 39.12 | +50 27 27.6 | 20.972 | 18.660 | 2.256 | 1.732 | 0.006 | 0.001 | 0.040 | 0.162 | 2 3 2 2 0 0 | 04403915+5027275 | - | ||||
| 2332 | 04 40 39.19 | +50 27 05.9 | 19.340 | 0.042 | 0 2 0 0 0 0 | - | - | ||||||||||
| 2333 | 04 40 39.20 | +50 27 07.9 | 21.751 | 18.229 | 3.523 | 0.186 | 0.012 | 0.186 | 1 2 1 0 0 0 | 04403919+5027075 | - | ||||||
| 2334 | 04 40 39.22 | +50 27 40.2 | 16.956 | 15.828 | 1.138 | 0.844 | 0.251 | -0.327 | 0.003 | 0.012 | 0.016 | 0.010 | 0.011 | 0.007 | 4 5 4 4 3 2 | 04403923+5027402 | H |
| 2335 | 04 40 39.24 | +50 18 01.8 | 20.933 | 18.638 | 2.294 | 1.798 | 0.083 | 0.007 | 0.083 | 0.207 | 1 2 1 1 0 0 | 04403923+5018016 | - | ||||
| 2336 | 04 40 39.24 | +50 27 14.2 | 18.519 | 0.027 | 0 2 0 0 0 0 | - | - | ||||||||||
| 2337 | 04 40 39.26 | +50 19 06.5 | 21.818 | 20.007 | 1.811 | 0.152 | 0.145 | 0.210 | 1 1 1 0 0 0 | - | - | ||||||
| 2338 | 04 40 39.30 | +50 27 11.6 | 15.843 | 14.918 | 0.920 | 0.691 | -0.039 | 0.219 | 0.001 | 0.003 | 0.003 | 0.005 | 0.005 | 0.006 | 4 5 4 4 4 2 | 04403929+5027116 | - |
| 2339 | 04 40 39.32 | +50 28 47.4 | 18.428 | 17.077 | 1.350 | 1.059 | 0.428 | 0.156 | 0.013 | 0.023 | 0.011 | 0.008 | 0.020 | 0.041 | 4 5 4 3 2 1 | 04403931+5028473 | - |
| 2340 | 04 40 39.32 | +50 31 39.1 | 21.388 | 18.611 | 2.801 | 1.465 | 0.063 | 0.006 | 0.045 | 0.244 | 2 3 2 1 0 0 | 04403932+5031392 | - | ||||
| 2341 | 04 40 39.34 | +50 27 19.6 | 13.204 | 12.338 | 0.859 | 0.623 | -0.298 | 0.147 | 0.005 | 0.008 | 0.001 | 0.001 | 0.001 | 0.018 | 3 5 3 3 3 1 | 04403935+5027196 | - |
| 2342 | 04 40 39.38 | +50 33 01.5 | 16.611 | 15.251 | 1.352 | 1.131 | 0.627 | 0.004 | 0.002 | 0.004 | 0.004 | 0.014 | 2 3 2 2 1 0 | 04403938+5033015 | - |
| ID | Nobs | 2MASSID | H | ||||||||||||||
|---|---|---|---|---|---|---|---|---|---|---|---|---|---|---|---|---|---|
| 705 | 05 31 23.46 | +34 12 27.6 | 21.091 | 18.103 | 3.031 | -1.609 | 0.007 | 0.031 | 0.058 | 0.079 | 2 3 2 0 0 1 | 05312347+3412276 | H | ||||
| 706 | 05 31 23.47 | +34 10 47.2 | 21.032 | 18.326 | 2.690 | 1.529 | -0.555 | 0.041 | 0.037 | 0.071 | 0.221 | 0.099 | 2 3 2 2 0 1 | 05312345+3410471 | H | ||
| 707 | 05 31 23.47 | +34 13 28.0 | 19.460 | 17.885 | 1.567 | 1.205 | 0.593 | 0.038 | 0.001 | 0.013 | 0.013 | 0.062 | 0.083 | 0.073 | 3 4 3 2 2 1 | 05312347+3413281 | - |
| 708 | 05 31 23.48 | +34 12 18.4 | 21.762 | 18.790 | 2.950 | 0.085 | 0.029 | 0.050 | 2 2 2 0 0 0 | 05312349+3412182 | - | ||||||
| 709 | 05 31 23.49 | +34 13 06.1 | 20.549 | 17.648 | 2.938 | 1.704 | -1.336 | 0.001 | 0.045 | 0.056 | 0.105 | 0.058 | 2 4 2 2 0 1 | 05312347+3413060 | H | ||
| 710 | 05 31 23.50 | +34 14 02.0 | 21.590 | 18.543 | 3.048 | -1.852 | 0.084 | 0.054 | 0.100 | 0.109 | 1 1 1 0 0 1 | - | - | ||||
| 711 | 05 31 23.51 | +34 18 16.3 | 20.080 | 18.087 | 1.985 | 1.519 | 0.055 | 0.027 | 0.001 | 0.021 | 0.062 | 0.058 | 2 3 2 2 0 1 | 05312351+3418161 | - | ||
| 712 | 05 31 23.53 | +34 14 44.8 | 21.151 | 18.865 | 2.286 | 0.104 | 0.062 | 0.121 | 1 1 1 0 0 0 | 05312356+3414448 | - | ||||||
| 713 | 05 31 23.53 | +34 13 41.5 | 17.125 | 15.433 | 1.629 | 1.346 | 0.648 | 0.023 | 0.020 | 0.019 | 0.004 | 0.031 | 0.014 | 0.013 | 4 4 4 4 4 2 | 05312353+3413415 | - |
| 714 | 05 31 23.55 | +34 15 05.5 | 16.541 | 15.444 | 1.091 | 0.782 | 0.479 | 0.313 | 0.008 | 0.002 | 0.010 | 0.006 | 0.009 | 0.012 | 4 4 4 4 4 2 | 05312355+3415056 | - |
| 715 | 05 31 23.57 | +34 13 09.2 | 21.865 | 18.669 | 3.196 | -1.347 | 0.116 | 0.047 | 0.125 | 0.154 | 1 1 1 0 0 1 | 05312357+3413097 | - | ||||
| 716 | 05 31 23.57 | +34 13 35.3 | 19.420 | 17.059 | 2.377 | 1.811 | 0.045 | 0.004 | 0.044 | 0.057 | 4 4 4 2 0 0 | 05312356+3413353 | - | ||||
| 717 | 05 31 23.60 | +34 10 59.6 | 20.964 | 17.982 | 2.958 | 1.642 | -0.206 | 0.047 | 0.019 | 0.023 | 0.131 | 0.102 | 2 4 2 1 0 1 | - | - | ||
| 718 | 05 31 23.60 | +34 13 54.2 | 19.331 | 17.506 | 1.826 | 1.543 | -0.105 | 0.001 | 0.038 | 0.044 | 0.100 | 0.072 | 4 4 4 2 0 1 | - | - | ||
| 719 | 05 31 23.60 | +34 14 10.2 | 21.592 | 18.259 | 3.333 | 0.104 | 0.031 | 0.109 | 1 2 1 0 0 0 | - | - | ||||||
| 720 | 05 31 23.61 | +34 10 32.2 | 21.686 | 18.904 | 2.787 | 0.017 | 0.013 | 0.031 | 2 2 2 0 0 0 | 05312361+3410320 | - | ||||||
| 721 | 05 31 23.64 | +34 11 12.7 | 21.413 | 19.373 | 2.021 | 0.041 | 0.068 | 0.119 | 2 2 2 0 0 0 | - | - | ||||||
| 722 | 05 31 23.68 | +34 10 40.7 | 15.000 | 14.352 | 0.640 | 0.472 | 0.201 | 0.314 | 0.005 | 0.001 | 0.004 | 0.003 | 0.005 | 0.007 | 4 4 4 4 4 2 | 05312367+3410407 | - |
Appendix A TRANSFORMATION RELATIONS FOR THE MONT4K CCD CAMERA OF THE KUIPER 61” TELESCOPE
The Mont4k photometric system of the Kuiper 61” telescope at SO was used in the SOS project for the first time. It is necessary to obtain reliable transformation relations of the instrumental system to produce homogeneous standardized photometric data for many open clusters. In this appendix we describe the derivation of the transformation relations using a large number of the standard stars observed in 2011 – 2013 (281 in Bessell , 119 in SDSS , 402 in , 436 in , and 530 in ). The SDSS filter was used on several nights in 2012, instead of the Bessell filter, and so the transformation relation was also addressed for the forthcoming papers.
The Mont4k tasks installed in the observing system automatically corrected for variations in the bias level and crosstalk for individual images, converting from the raw extended FITS into normal FITS images. In order to remove remaining instrumental artifacts we obtained a number of bias, sky flat, and shutter shading images during observing runs. The bias level was very small (a few ADU) because the overscan correction had already been done. After subtracting the tiny residual bias, all target images were divided by the master flat images in the same passbands. The Mont4k CCD camera system is equipped with an iris-type shutter. This type of shutter imprints an iris pattern on short-exposure images. In addition, there could be either a systematic gain or loss in the observed flux depending on the speed of the shutter. These behaviours are crucial for obtaining reliable magnitudes in short exposure images. We carefully investigated the shutter shading with various exposure time (0.5s, 1s, 2s, 3s, 4s, 5s, 7s, 10s, 15s, and 20s) according to the procedures delineated by Lim et al. (2008) and found that images exposed for less than 7s showed the iris pattern. Images with exposure times less than 2s revealed a systematic gain variation of more than 0.5 percent (up to 4.6 percent at 0.5s) in the observed flux. It implies that the shutter operates more slowly for exposure time shorter than 2s. Based on these results we corrected the shutter shading effect on short exposure images (0.5 – 7s).
We performed aperture photometry for the standard stars with an aperture size of 14.0 arcsec (16.3 pixels). The enormous amount of photometric data obtained over 11 nights in 2011 – 2013 allowed us to obtain reliable transformation relations. The instrumental magnitudes can be transformed to the standard magnitudes and colors using the following equation:
| (A1) |
where , , , and represent the coefficients of spatial variation in magnitude. Other symbols are the same as in Equation 1. The and coordinates were normalized by 1,000 pixels (, ). Figure A.1 shows the spatial variations in the measured magnitudes with respect to and coordinates for each passband. Since there are five uncountable columns in the center of the normal FITS images, the coordinate of stars away from the center (682th pixel) in a positive direction was increased by 5 pixels. The form of the spatial variations can be represented by a second-order polynomial. The pattern may relate to the shape of the focal plane of the Kuiper 61” telescope (see also Magnier & Cuillandre 2004; Sung et al. 2008; Lim et al. 2013). In most cases, the amount of the variation from the CCD center was less than 0.03 mag. The maximum difference was up to 0.05 mag in the Bessell band. We performed the second-order polynomial fitting to the data, presenting the coefficients of the spatial variation in Table A.1. In addition, a linear variation along the coordinate in the band was found between the 0 – 500th pixels, but there was no remarkable spatial variation on the other side.
The atmospheric extinction and transformation coefficients were determined using a weighted least-square method after correcting for the spatial variations. Figure A.2 shows the transformation relations for the Mont4k CCD camera system. A combination of a few straight lines constitutes the transformation relations. Since there was only one extremely red star ( 3 ) in the transformation with respect to color, the transformation relation may be uncertain in that color range. The transformation with respect to shows a plateau for the reddest stars (). The TiO band spectral features in late-type stars are related to this plateau as seen in other studies (Sung & Bessell, 2000; Lim et al., 2009, 2013). The transformation was approximated by a combination of two straight lines, and the coefficients are very small. The transformation relations of the Bessell and SDSS filters exhibit opposite trends to each other. A non-linear behaviour was found in the transformation. According to Sung & Bessell (2000) and Lim et al. (2009) this aspect is caused by the Balmer discontinuity in the fluxes of B–F-type stars and difference between the response functions of the Johnson-Cousins standard system and natural photometric systems. Such a non-linearity can be corrected using dereddened colors as shown in the lower-right panels of Figure A.2. The aspect of the non-linear correction term appears as an opposite trend in the Bessell and SDSS transformation relations. The transformation coefficients with respect to given colors are summarized in Table A.2.
On the other hand, we found that standard stars with an intrinsically red color appeared systematically brighter than other stars in the Bessell filter after correcting with all the coefficients above (see the upper panel in Figure A.3). Unlike the Bessell filter used at MAO, the filter attached to the Mont4k CCD camera exhibits the so-called red leak. Since the contribution of red light drastically increases for , a careful correction for the red leak effect was carried out with respect to the color as shown in the upper panel of Figure A.3. The transformation of the SDSS filter also required an additional correction term for extremely red stars. Because the transmission function of the SDSS filter was shifted toward shorter wavelength to avoid the Balmer discontinuity, one can expect that the magnitude of late-type stars may be fainter than the Johnson magnitude. Thus, a negative correction term for red stars () was required as shown in the lower panel of Figure A.3. We note that all the coefficients in the transformation equation were obtained from iteration of the procedures described above.
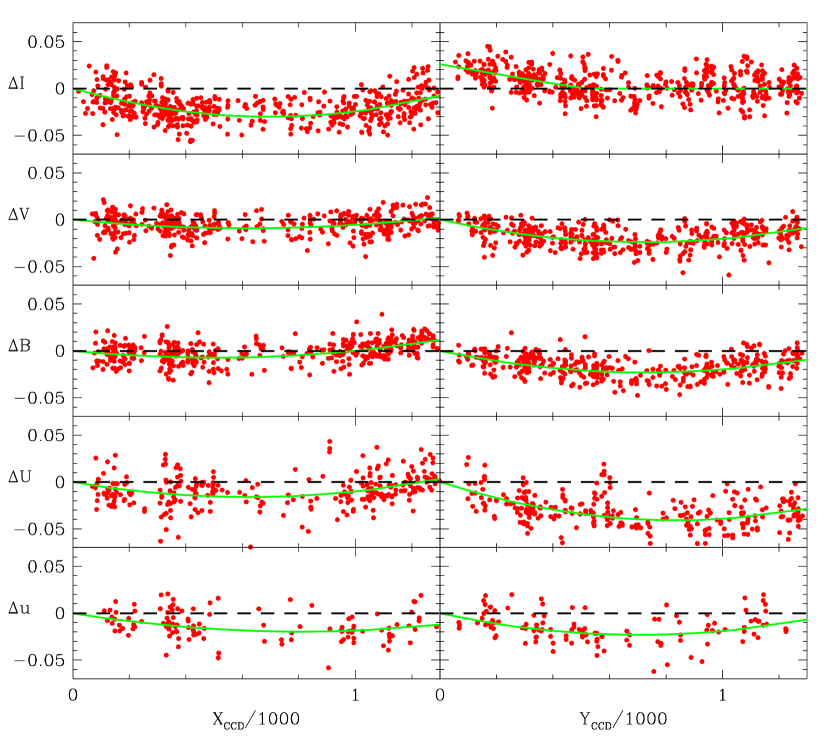
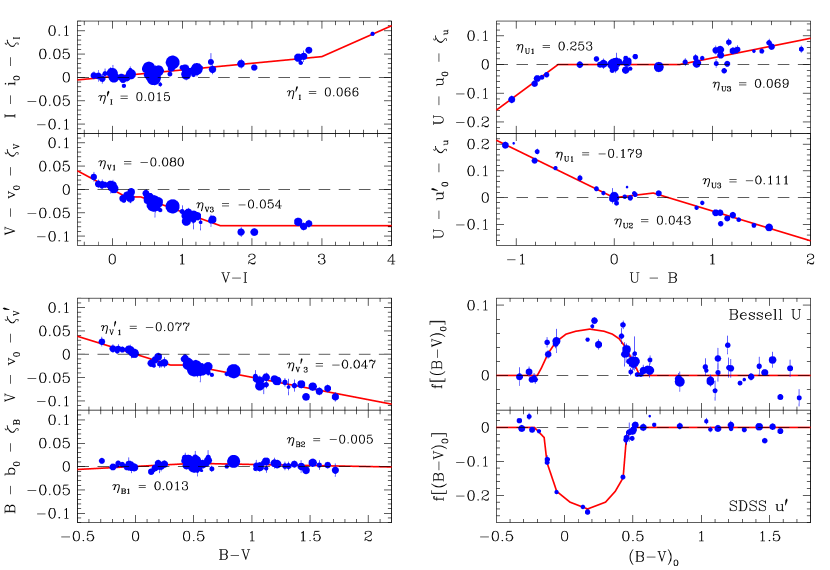
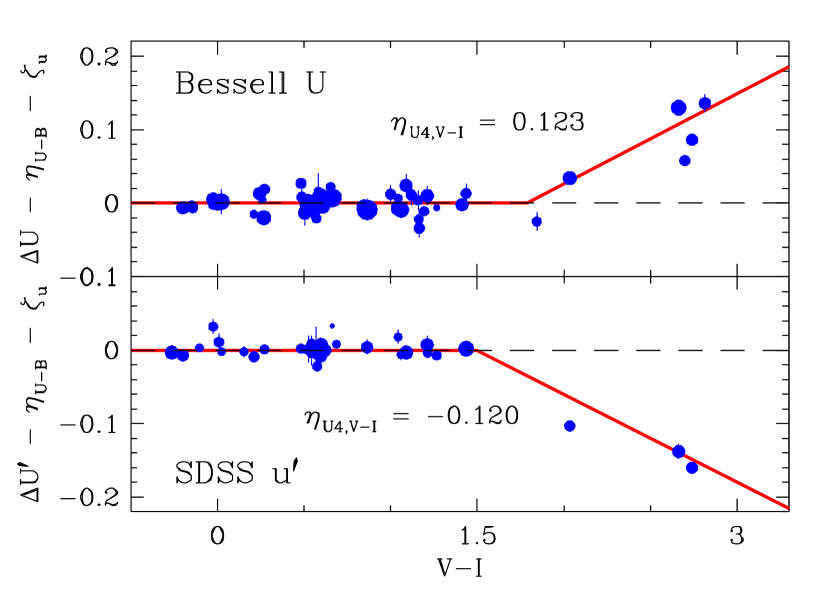
| Filter | Remark | ||||
|---|---|---|---|---|---|
| 0.062 | -0.086 | -0.052 | pixels | ||
| 0.024 | -0.029 | 0.046 | -0.066 | ||
| 0.029 | -0.029 | 0.043 | -0.063 | ||
| 0.042 | -0.052 | 0.058 | -0.097 | ||
| 0.030 | -0.049 | 0.047 | -0.066 |
| Filter | Color range | ||||
|---|---|---|---|---|---|
| Correction term | |||||
| 0.066 | |||||
| 0.000 | 0.000 | ||||
| 0.000 | |||||
| 0.000 | 0.000 | ||||
| 0.000 | |||||
| 0.043 |