0\Yearpublication\Yearsubmission2005\Month11\Volume999\Issue88
later
Stellar populations of the bulges of four spiral galaxies,††thanks: Based on observations made with ESO Telescopes at the La Silla-Paranal Observatory under programmes 075.B-0794 and 077.B-0767.,††thanks: Table 2 is available in electronic form.
Abstract
Key information to understand the formation and evolution of disk galaxies are imprinted in the stellar populations of their bulges. This paper has the purpose to make available new measurements of the stellar population properties of the bulges of four spiral galaxies. Both the central values and radial profiles of the line strength of some of the most common Lick indices are measured along the major- and minor- axis of the bulge-dominated region of the sample galaxies. The corresponding age, metallicity, and Fe ratio are derived by using the simple stellar population synthesis model predictions. The central values and the gradients of the stellar population properties of ESO-LV 1890070, ESO-LV 4460170, and ESO-LV 5140100 are consistent with previous findings for bulges of spiral galaxies. On the contrary, the bulge of ESO-LV 4500200 shows peculiar chemical properties possibly due to the presence of a central kinematically-decoupled component. The negative metallicity gradient found in our bulges sample indicates a relevant role for the dissipative collapse in bulge formation. However, the shallow gradients found for the age and Fe ratio suggests that merging can not be completely ruled out for the sample bulges. This is confirmed by the properties of ESO-LV 4500200 which can hardly be explained without invoking the capture of external material.
keywords:
galaxies: abundances – galaxies: bulges – galaxies: evolution – galaxies: formation – galaxies: stellar content1 Introduction
Due to their privileged position at the bottom of the galactic potential well, bulges are a key player in the process of the assembly of disk galaxies. In the current picture, the mechanisms of bulge formation include dissipative collapse (Gilmore & Wyse, 1998) merging and acquisition events (Cole et al., 2000), and secular evolution (Kormendy & Kennicutt, 2004). Crucial information to understand the processes of formation and evolution of galaxies is imprinted in their stellar populations and even more in their radial gradients, since different formation scenarios predict different radial trends of age, metallicity, and Fe ratio.
In the last years the stellar populations of classical bulges have been spectroscopically studied in detail and compared among different morphological types and different environments in both lenticular (Rampazzo et al., 2005; Sánchez-Blázquez et al., 2006; Collobert et al., 2006; Annibali et al., 2007; Rawle et al., 2010; Kuntschner et al., 2010; Spolaor et al., 2010) and spiral galaxies (Moorthy & Holtzman, 2006; Jablonka et al., 2007; Morelli et al., 2008; MacArthur et al., 2009; Morelli et al., 2012, 2013). The central values and radial gradients of age, metallicity, and Fe ratio have been derived for a large number of galaxies. The variety of the results testifies the complexity of the topic. The bulk of the stellar population can have a range of ages among different bulges and this is generally related with the morphological type (Ganda et al., 2007). The values of the Fe ratio, ranging from solar to super-solar, give a time-scale for star formation from 4-5 Gyr to less than 1 Gyr (Thomas & Davies, 2006). The only common feature for all the bulges (independently from their morphological type and environment) is the negative radial gradient of metallicity. All these properties support formation scenarios related to an early formation through violent relaxation or dissipative collapse are favoured over those of secular evolution.
To further investigate this topic, Morelli et al. (2012) analyzed a sample of bulges embedded in low surface-brightness disks. Low surface-brightness galaxies are believed to not have experienced major merging events during their lifetime. The radial profiles of their age, metallicity, and Fe ratio confirm also for these bulges the violent relaxation as possible formation mechanism. Furthermore, the comparison between ordinary high and low surface-brightness galaxies shows that their bulges share many structural and chemical properties. Such similarity suggests that they possibly had common formation scenarios and evolution histories and indicates that there is not a relevant interplay between the bulge and disk components. All these results downsize the role of the secular evolution in the formation scenarios of the classical bulges, independently of the high or low surface-brightness of the host disk. However, secular evolution could still be the main mechanism responsible for the formation of pseudobulges (Kormendy et al., 2009).
In this paper, we present new measurements of the central values and radial profiles of the line strength of some of the most common Lick indices for the bulges hosted by four spiral galaxies. These data are a valuable supplementary resource for the astronomical community. Indeed, the derived values of age, metallicity, and Fe ratio can be used for further comparison between the stellar populations of galactic components.
| Name | Alt. Name | Type | T | |||||
|---|---|---|---|---|---|---|---|---|
| [arcmin] | [mag] | [] | [Mpc] | [mag] | ||||
| (1) | (2) | (3) | (4) | (5) | (6) | (7) | (8) | (9) |
| ESO-LV 1890070 | NGC 7140 | SABb | 12.31 | 2981 | 37.5 | |||
| ESO-LV 4460170 | … | SBb | 13.55 | 4172 | 58.9 | |||
| ESO-LV 4500200 | NGC 6000 | SBbc | 13.03 | 2118 | 31.6 | |||
| ESO-LV 5140100 | IC 4538 | SABc | 12.88 | 2888 | 40.4 |
NOTES: Col.(3): morphological classification from Lyon Extragalactic Database (LEDA). Col.(4): morphological type code from LEDA. Col.(5): apparent isophotal diameters measured at a surface-brightness level of mag arcsec-2 from LEDA. Col.(6): total observed blue magnitude from LEDA. Col.(7): radial velocity with respect to the CMB radiation from LEDA. Col.(8): distance from Pizzella et al. (2008) adopting km s-1 Mpc-1. Col.(9): absolute total blue magnitude from corrected for extinction as in LEDA and adopting .
2 Galaxy sample
The galaxy sample comprises four spiral galaxies whose basic properties are listed in Table 1. They belong to the sample of nearby galaxies studied by Pizzella et al. (2008) who analyzed their stellar and ionized-gas kinematics and surface photometry. Pizzella et al. (2008) were interested in spiral galaxies with a low surface-brightness disk and we refer to their paper for the details about the selection criteria of the galaxy sample. ESO-LV 1890070, ESO-LV 4460170, ESO-LV 4500200, and ESO-LV 5140100 turned out to host a high surface-brightness disk and therefore were not considered in the subsequent analysis (Morelli et al., 2012). Since the long-slit spectra of the four neglected galaxies were available to us, we decided to derive the stellar population properties of their bulges.
3 Photometric decomposition
In their photometric analysis Pizzella et al. (2008) assumed the surface-brightness distribution of the sample galaxies to be the sum of the contributions of a bulge and a disk component only. We improved their photometric decomposition by including a bar component to precisely identify the bulge-dominated region of each galaxy. The structural parameters of the bulge, disk, and bar components were derived by applying the Galaxy Surface Photometry Two-Dimensional Decomposition (GASP2D) algorithm (Méndez-Abreu et al., 2008; Mendez-Abreu et al., 2014) to the images obtained by Pizzella et al. (2008). Other components (e.g., lenses, ovals, or spiral arms) were not considered.
The surface brightness of the bulge was modelled using a Sérsic function (Sérsic, 1968)
| (1) |
where is the effective radius, is the surface brightness at , is a shape parameter that describes the curvature of the radial profile, and (Caon et al., 1993). The bulge model was assumed to have elliptical isophotes centered on with constant position angle PAbulge and constant axial ratio .
The surface brightness of the disk was modelled using an exponential function (Freeman, 1970)
| (2) |
where is the central surface brightness and is the scale length. The disk model was assumed to have elliptical isophotes centered on with constant position angle PAdisk and constant axial ratio .
The surface brightness of the bar was modelled with a Ferrers function (Ferrers 1877, but see Aguerri et al. 2009 for the choice of the shape parameter)
| (3) |
where is the central surface brightness and is the bar length. The bar model was assumed to have isophotes described by generalized ellipses (Athanassoula et al., 1990) centered on with constant position angle PAbar and constant axial ratio .
The GASP2D software yields the structural parameters for the bulge (, , , PAbulge and ), disk (, , PAdisk and ), and bar (, , PAbar and ) and the position of the galaxy center by iteratively fitting a model of the surface-brightness distribution to the pixels of the galaxy image. It was used a non-linear least-squares minimisation based on a robust Levenberg-Marquardt method (Moré et al., 1980). The actual computation has been done using the MPFIT algorithm (Markwardt, 2009) under the IDL111Interactive Data Language is distributed by ITT Visual Information Solutions. It is available from http://www.ittvis.com environment. Each image pixel has been weighted according to the variance of its total observed photon counts due to the contribution of both the galaxy and sky, and determined assuming photon noise limitation and taking into account the detector readout noise. The seeing effects were taken into account by convolving the model image with a circular Moffat point spread function with the shape parameters measured directly from stars in the galaxy image.
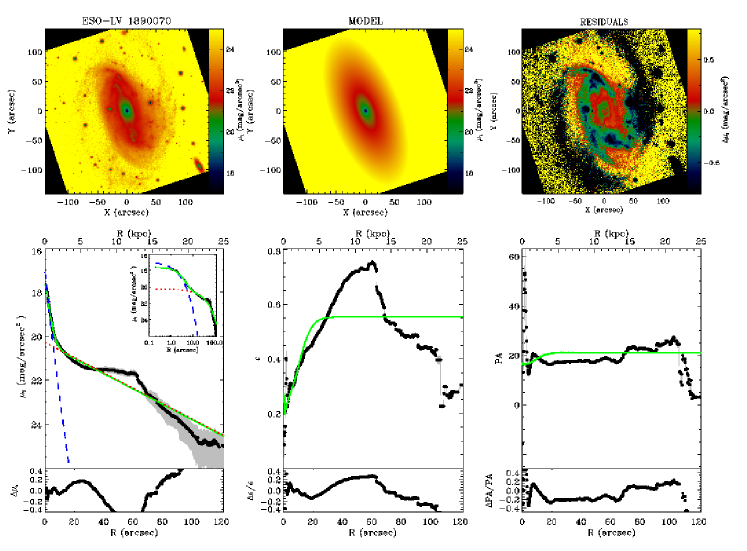
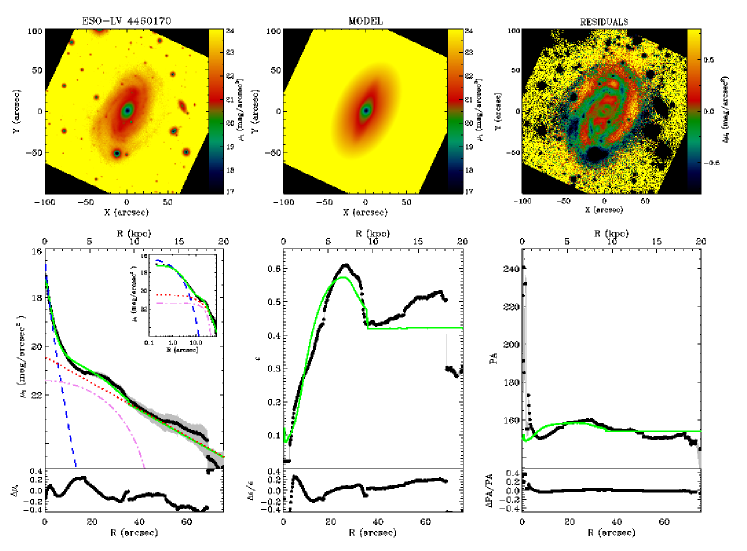
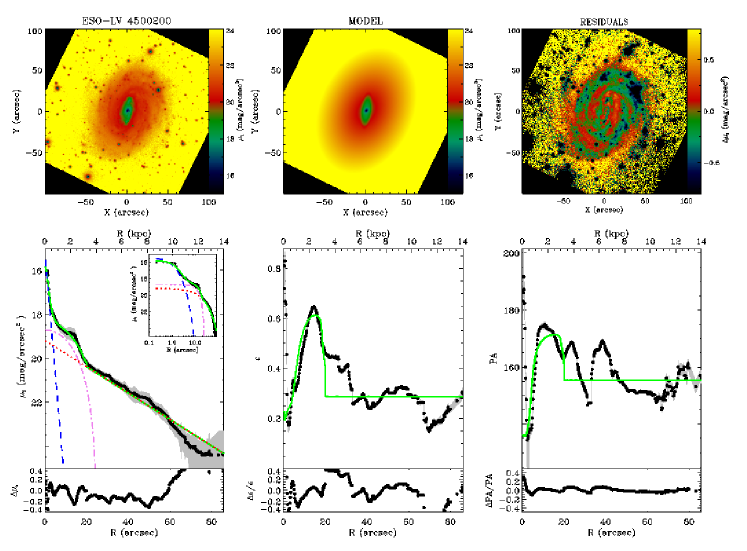
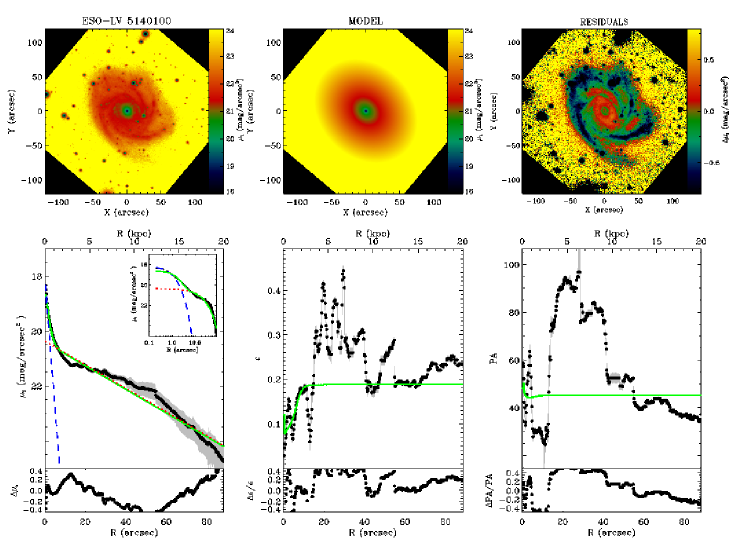
The best-fitting solution was found by building surface-brightness models with and without the bar component. A bar was detected and modelled in ESO-LV 4460170 and ESO-LV 4500200, whereas no bar was needed to improve the surface-brightness models of ESO-LV 1890070 and ESO-LV 5140100. The bump in the surface-brightness profile associated to both a significant peak in the ellipticity and a roughly constant position angle is the photometric signature of the bar in ESO-LV 4460170 and ESO-LV 4500200 (see Aguerri et al. (2009) for a detailed discussion). The flat surface-brightness profile of ESO-LV 1890070 and the increase of ellipticity measured between 30 and 60 arcsec are due to the two prominent and symmetrical arms characterizing the galaxy spiral pattern. The multi-armed structure of ESO-LV 5140100 results in the increase and variation of the ellipticity between 20 and 40 arcsec.
Figure 1 shows the GASP2D fits for the sample galaxies. The best-fitting parameters derived for their structural components are collected in Table 2 together with the radius of the bulge-dominated region where half of the total surface brightness is due to the bulge only.
The errors on the best-fitting parameters of the barred galaxies were obtained through a series of Monte Carlo simulations. A set of 500 images of galaxies with a Sérsic bulge, an exponential disk, and a Ferrers bar was generated. The structural parameters of the artificial galaxies were randomly chosen among the ranges obtained for our galaxies. The adopted pixel scale, CCD gain, and read-out-noise were chosen to mimic the instrumental setup of the photometric observations by Pizzella et al. (2008). A background level and photon noise were added to the artificial images to yield a signal-to-noise ratio () similar to that of the observed ones. Finally, the images of artificial galaxies were analyzed with GASP2D as if they were real and the errors on the fitted parameters were estimated by comparing the input and measured values assuming they were normally distributed. The mean and standard deviation of the relative errors of the artificial galaxies were adopted as the systematic and typical errors for the observed galaxies.
| Parameter | ESO-LV 1890070 | ESO-LV 4460170 | ESO-LV 4500200 | ESO-LV 5140100 |
|---|---|---|---|---|
| (1) | (2) | (3) | (4) | (5) |
| [mag arcsec-2] | ||||
| [arcsec] | ||||
| PAbulge [∘] | ||||
| [mag arcsec-2] | ||||
| [arcsec] | ||||
| PAdisk [∘] | ||||
| [mag arcsec-2] | ||||
| [arcsec] | ||||
| PAbar [∘] | ||||
| [arcsec] |
NOTES. Surface-brightness values are given in band according to the flux calibration by Pizzella et al. (2008). is the bulge-to-total luminosity ratio. is the bar-to-total luminosity ratio. is radius of the bulge-dominated region where the bulge contributes half of the total surface brightness.
4 Measurement of the line-strength indices
Major- and minor-axis spectra were obtained for each sample galaxy by Pizzella et al. (2008). All the details about the acquisition and reduction of the galaxy spectra are available in Pizzella et al. (2008) and Morelli et al. (2008).
Mg, Fe, and line-strength indices as defined by Faber et al. (1985) and Worthey et al. (1994) were measured from the flux calibrated spectra of the four sample galaxies following Morelli et al. (2004, 2007). The average iron index (Gorgas et al., 1990) and the combined magnesium-iron index (Thomas et al., 2003) were measured too.
The difference between the spectral resolution of the galaxy spectra and the Lick/IDS system ( Å; Worthey & Ottaviani 1997) was taken into account by degrading our spectra through a Gaussian convolution to match the Lick/IDS resolution before measuring the line-strength indices. No focus correction was applied because the atmospheric seeing was the dominant effect during observations (see Mehlert et al., 1998, for details). The errors on the line-strength indices were derived from photon statistics and CCD read-out noise, and calibrated by means of Monte Carlo simulations.
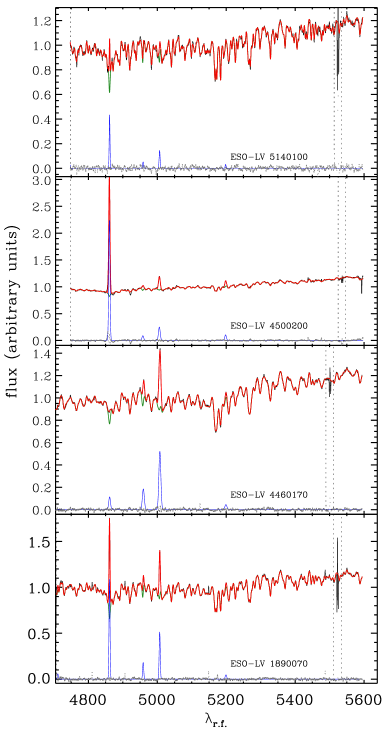
The contamination of the line-strength index by the emission line due to the ionized gas present in the galaxy is a problem when deriving the properties of the stellar populations. Indeed, if the emission fills the absorption line and a proper separation of both contributions is not performed before the analysis, the measured ages result to be artificially older. To address this issue we adopted the code Gas AND Absorption Line Fitting (GANDALF) to fit the galaxy spectra with synthetic population models as done by Sarzi et al. (2006) and Morelli et al. (2008). The models were built with different templates from the MILES stellar library by Vazdekis et al. (2010). For each spectrum, we fitted a linear combination of stellar population synthesis models to the observed galaxy spectrum by performing a minimization in pixel space (Figure 2). We adopted the Salpeter initial mass function (Salpeter, 1955), ages ranging from 1 to 15 Gyr, and metallicities from -1.31 to 0.22 dex. We simultaneously fitted the observed spectra using emission lines in addition to the stellar templates. Only emission lines detected with a were subtracted from the observed spectra. To calibrate our measurements to the Lick/IDS system, the values of the line-strength indices measured for a sample of templates were compared to those obtained by Worthey et al. (1994) as done in Morelli et al. (2012). The offsets obtained were negligible when compared to the mean error of the differences between the tabulated and measured Lick indices. Therefore, no offset correction was applied to our line-strength measurements.
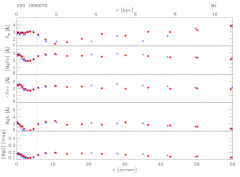
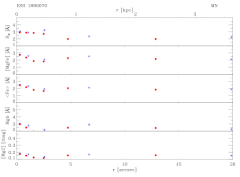
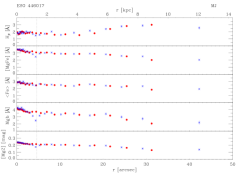
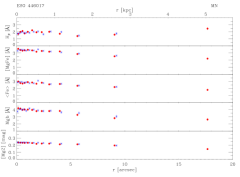
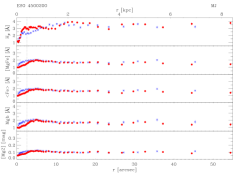
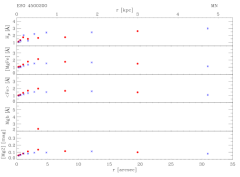
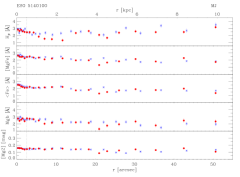
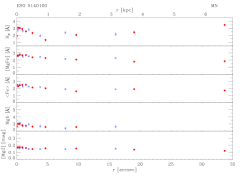
The measured values of , []′, , Mg b, and Mg 2 for all the sample galaxies are plotted in Fig. 3. The line-strength indices for all the sample galaxies are given in Table LABEL:tab:val_ind.
| r | Mg 2 | Mg b | Fe5270 | Fe5335 | |
|---|---|---|---|---|---|
| [arcsec] | (Å) | (mag) | (Å) | (Å) | (Å) |
| ESO-LV 1890070 | |||||
5 Properties of the stellar populations
5.1 Central values of age, metallicity, and /Fe ratio
The central values of velocity dispersion and line-strength indices Mg b, Mg 2, , , and []′ were derived from the major- and minor-axis radial profiles as done in Morelli et al. (2008, 2012). The data points inside an aperture of radius were averaged adopting a relative weight proportional to their . The resulting values are listed in Table 4.
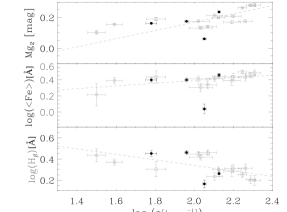
Fig. 4 shows the central values of Mg 2, , and as a function of the velocity dispersion for the sample galaxies. The values and correlations for the bulges of the sample of spiral galaxies with high surface-brightness disks by Morelli et al. (2008) are shown for comparison. The galaxy sample by Morelli et al. (2008) has similar properties to those of the galaxies studied in this paper. Three galaxies in our sample follow the trends obtained by Morelli et al. (2008) whereas ESO-LV 4500200 has a lower abundance of and iron elements with respect to galaxies with similar central velocity dispersion, as shown by the lower values of Mg 2 and . ESO-LV 4500200 is also characterized by a lower value of . It is worth noticing that Pizzella et al. (2008) found a kinematically-decoupled and dynamically cold component in the nucleus ( 2 arcsec) of this galaxy. Such a structure compromises the central stellar velocity dispersion and affects the values of the Lick indices. This is indirectly confirmed from the outlier position of ESO-LV 4500200 in the relations of Fig. 4
of the sample galaxies averaged within .
| Galaxy | []′ | Mg 2 | Mg b | H | |||
|---|---|---|---|---|---|---|---|
| [] | [Å] | [Å] | [mag] | [Å] | [Å] | [Å] | |
| (1) | (2) | (3) | (4) | (5) | (6) | (7) | (8) |
| ESO-LV 1890070 | |||||||
| ESO-LV 4460170 | |||||||
| ESO-LV 4500200 | |||||||
| ESO-LV 5140100 |
The models by Thomas et al. (2003) predict the values of the line-strength indices for a single stellar population as function of the age, metallicity, and [] ratio.
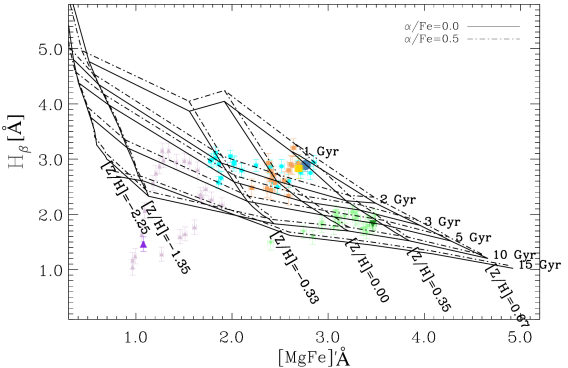
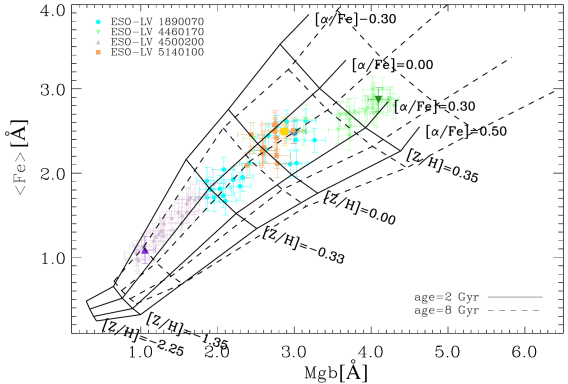
Recent studies indicate the possibility of a multi-SP or extended star formation history nature for some bulges. These properties could be interpreted using mixed SSPs. However, in this paper we decided to follow the SSP approach, since the sample bulges are the last ones of a series studied in Morelli et al. (2008) and Morelli et al. (2012). This approach allowed us to compare the results with the previous data. In the top panel of Fig. 5 the central values of and []′ are compared with the model predictions for two stellar populations with solar ([] dex) and super-solar Fe ratio ([] dex), respectively. In the bottom panel of Fig. 5 the central values of Mg b and are compared with the model predictions for two stellar populations with an intermediate (2 Gyr) and old age (12 Gyr), respectively.
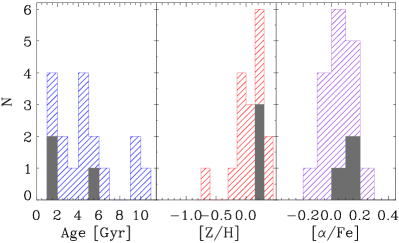
The central age, metallicity, and total Fe ratio of each bulge were derived by a linear interpolation between the model points using the iterative procedure described in Mehlert et al. (2003). The derived values and their corresponding errors are listed in Table 5 and were included in the histograms built by Morelli et al. (2008) (Fig. 6).
The values of age, metallicity, and [] ratio of ESO-LV 1890070, ESO-LV 4460170, and ESO-LV 5140100 are consistent with the distributions obtained by Morelli et al. (2008). On the contrary, the values of and Mg b of ESO-LV 4500200 in the correspond to [] , which is remarkably lower than the average Fe ratio found for similar galaxies (Figure 6). Furthermore, the kinematical and chemical properties of this galaxy place it in a region of the -[]′ diagram which is not covered by stellar population models. This does prevented us to derive the age and metallicity of the bulge of ESO-LV 4500200 and we did not considered it in the analysis of the gradients of the stellar population properties.
| Galaxy | Age | [] | [] |
|---|---|---|---|
| [Gyr] | |||
| (1) | (2) | (3) | (4) |
| ESO-LV 1890070 | |||
| ESO-LV 4460170 | |||
| ESO-LV 4500200 | |||
| ESO-LV 5140100 |
5.2 Radial gradients of the age, metallicity, and /Fe ratio
The values of the Mg 2, , and line-strength indices were measured along the bulge major axis at the radius (Morelli et al., 2008) where the surface-brightness contributions of the bulge and disk are equal (Table 1). The corresponding ages, metallicities, and Fe ratio were derived by using the stellar population models by Thomas et al. (2003) as done for the central values.
An issue in measuring the gradients of age, metallicity and Fe ratio in bulge, could be the contamination of their stellar population by the light coming from the underlying disk or bar stellar component. This effect is negligible in the galaxy center but it could increase going to the outer regions of the bulge, where the light starts to be dominated by the disk component. In order to reduce the impact of disk contamination and extend as much as possible the region in which deriving gradients, we map them inside , i.e. the radius where the bulge contributes half of the total surface brightness. This radius is slightly larger than the effective radius of the galaxy (Morelli et al., 2008) . Deriving gradients in the bulge-dominated region, will not remove completely the contamination by the disk or bar stellar population but it will assure always a similar degree of contamination in comparing the gradients of different galaxies.
The gradients were set as the difference between the values at center and and their corresponding errors were calculated through Monte Carlo simulations taking into account the errors (Mehlert et al., 2003). The final gradients of the age, metallicity, and Fe ratio and their corresponding errors are listed in Table 6.
| Galaxy | (Age) | ([] ) | ([] ) |
|---|---|---|---|
| [Gyr] | |||
| (1) | (2) | (3) | (4) |
| ESO-LV 1890070 | |||
| ESO-LV 4460170 | |||
| ESO-LV 5140100 |
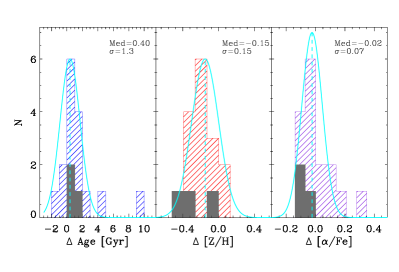
Shallow gradients in age and no gradient in /Fe ratio were found for all the sample galaxies, whereas a negative shallow gradient in metallicity was observed for ESO-LV 1890070, ESO-LV 4460170, and ESO-LV 5140100. This was somehow expected for the bulges of spiral galaxies. Indeed, the measured gradients are consistent with the distributions obtained by Morelli et al. (2008) (Fig. 7).
Although we could not derive the age, metallicity, and [] , of ESO-LV 4500200, it is worth noticing that the radial trends of the line-strength indices are opposite with respect to the other sample galaxies (Figure 3). This is probably due to the presence of a decoupled component in the center of the galaxy, as suggested by the kinematical properties discussed in Pizzella et al. (2008).
6 Conclusions
The purpose of this paper is to make available to the community the data and the results of the analysis of the stellar populations of the bulges hosted in four spiral galaxies with a high surface-brightness disk.
The central values of age, metallicity, and Fe ratio were derived for all the sample galaxies. The properties of the stellar populations of ESO-LV 1890070, ESO-LV 4460170, and ESO-LV 5140100 are consistent with the previous results obtained for the bulges of spiral galaxies (Jablonka et al., 2007; Ganda et al., 2007; Morelli et al., 2008).
The gradients of the stellar population properties along the major axis of all the galaxies were measured in their bulge-dominated regions. The results are consistent with previous findings for the bulges of spiral galaxies (Jablonka et al., 2007; Morelli et al., 2008, 2012). The negative metallicity gradient suggests that dissipative collapse has an important role in the formation of these galaxies, but the absence of the gradients of Fe ratio and age indicates that hierarchical merging might be at work during the assembling process of these objects.
This is also confirmed by the peculiar properties of the bulge of ESO-LV 4500200 which can hardly be explained without invoking a recent merging or acquisition (Bertola & Corsini, 1999; Coccato et al., 2013; Corsini, 2014).
Acknowledgements.
This work was supported by Padua University through grants 60A02-5052/11, 60A02-4807/12, 60A02-5857/13 and CPDA133894.. LM acknowledges financial support from Padua University grant CPS0204. JMA acknowledges support from the European Research Council Starting Grant (SEDmorph; P.I. V. Wild)References
- Aguerri et al. (2009) Aguerri, J. A. L., Méndez-Abreu, J., & Corsini, E. M. 2009, A&A, 495, 491
- Annibali et al. (2007) Annibali, F., Bressan, A., Rampazzo, R., Zeilinger, W. W., & Danese, L. 2007, A&A, 463, 455
- Athanassoula et al. (1990) Athanassoula, E., Morin, S., Wozniak, H., et al. 1990, MNRAS, 245, 130
- Bertola & Corsini (1999) Bertola, F. & Corsini, E. M. 1999, in Galaxy Interactions at Low and High Redshift, ed. J. E. Barnes & D. B. Sanders, IAU Symp. 186 (Kuwler, Dordrecht, 149
- Caon et al. (1993) Caon, N., Capaccioli, M., & D’Onofrio, M. 1993, MNRAS, 265, 1013
- Coccato et al. (2013) Coccato, L., Morelli, L., Pizzella, A., et al. 2013, A&A, 549, A3
- Coccato et al. (2011) Coccato, L., Morelli, L., Corsini, E. M., et al. 2011, MNRAS, 412, L113
- Cole et al. (2000) Cole, S., Lacey, C. G., Baugh, C. M., & Frenk, C. S. 2000, MNRAS, 319, 168
- Collobert et al. (2006) Collobert, M., Sarzi, M., Davies, R. L., Kuntschner, H., & Colless, M. 2006, MNRAS, 370, 1213
- Corsini (2014) Corsini, E. M. 2014, in Multi-Spin Galaxies, ed. E. Iodice & E. M. Corsini, ASP Conf. Ser. 486, (ASP, San Francisco), 51
- Faber et al. (1985) Faber, S. M., Friel, E. D., Burstein, D., & Gaskell, C. M. 1985, ApJS, 57, 711
- Ferrers (1877) Ferrers, N. M. 1877, Quart. J. Pure and Appl. Math, 14, 1
- Freeman (1970) Freeman, K. C. 1970, ApJ, 160, 811
- Ganda et al. (2007) Ganda, K., Peletier, R. F., McDermid, R. M., et al. 2007, MNRAS, 380, 506
- Gilmore & Wyse (1998) Gilmore, G. & Wyse, R. F. G. 1998, AJ, 116, 748
- Gorgas et al. (1990) Gorgas, J., Efstathiou, G., & Salamanca, A. A. 1990, MNRAS, 245, 217
- Jablonka et al. (2007) Jablonka, P., Gorgas, J., & Goudfrooij, P. 2007, A&A, 474, 763
- Kormendy et al. (2009) Kormendy, J., Fisher, D. B., Cornell, M. E., & Bender, R. 2009, ApJS, 182, 216
- Kormendy & Kennicutt (2004) Kormendy, J. & Kennicutt, R. C. 2004, ARA&A, 42, 603
- Kuntschner et al. (2010) Kuntschner, H., Emsellem, E., Bacon, R., et al. 2010, MNRAS, 408, 97
- McDermid et al. (2006) McDermid, R. M., Emsellem, E., Shapiro, K. L., et al. 2006, MNRAS, 373, 906
- MacArthur et al. (2009) MacArthur, L. A., González, J. J., & Courteau, S. 2009, MNRAS, 395, 28
- Markwardt (2009) Markwardt, C. B. 2009, in Astronomical Data Analysis Software and Systems XVIII, ed. D. A. Bohlender, D. Durand, & P. Dowler, ASP Conf. Ser. 411, (ASP, San Francisco), 251
- Mehlert et al. (1998) Mehlert, D., Saglia, R. P., Bender, R., & Wegner, G. 1998, A&A, 332, 33
- Mehlert et al. (2003) Mehlert, D., Thomas, D., Saglia, R. P., Bender, R., & Wegner, G. 2003, A&A, 407, 423
- Méndez-Abreu et al. (2008) Méndez-Abreu, J., Aguerri, J. A. L., Corsini, E. M., & Simonneau, E. 2008, A&A, 478, 353
- Mendez-Abreu et al. (2014) Mendez-Abreu, J., Debattista, V. P., Corsini, E. M., & Aguerri, J. A. L. 2014, arXiv:1409.2876
- Moorthy & Holtzman (2006) Moorthy, B. K. & Holtzman, J. A. 2006, MNRAS, 371, 583
- Moré et al. (1980) Moré, J. J., Garbow, B. S., & Hillstrom, K. E. 1980, Argonne National Laboratory Report ANL-80-74
- Morelli et al. (2004) Morelli, L., Halliday, C., Corsini, E. M., et al. 2004, MNRAS, 354, 753
- Morelli et al. (2013) Morelli, L., Calvi, V., Masetti, N., et al. 2013, A&A, 556, A135
- Morelli et al. (2012) Morelli, L., Corsini, E. M., Pizzella, A., et al. 2012, MNRAS, 423, 962
- Morelli et al. (2004) Morelli, L., Halliday, C., Corsini, E. M., et al. 2004, MNRAS, 354, 753
- Morelli et al. (2007) Morelli, L., Pompei, E., Pizzella, A., et al. 2007, Nuovo Cimento B Serie, 122, 1281
- Morelli et al. (2008) Morelli, L., Pompei, E., Pizzella, A., et al. 2008, MNRAS, 389, 341
- Pizzella et al. (2008) Pizzella, A., Corsini, E. M., Sarzi, M., et al. 2008, MNRAS, 387, 1099
- Rampazzo et al. (2005) Rampazzo, R., Annibali, F., Bressan, A., et al. 2005, A&A, 433, 497
- Rawle et al. (2010) Rawle, T. D., Smith, R. J., & Lucey, J. R. 2010, MNRAS, 401, 852
- Salpeter (1955) Salpeter, E. E. 1955, ApJ, 121, 161
- Sánchez-Blázquez et al. (2006) Sánchez-Blázquez, P., Gorgas, J., Cardiel, N., & González, J. J. 2006, A&A, 457, 809
- Sarzi et al. (2006) Sarzi, M., Falcón-Barroso, J., Davies, R. L., et al. 2006, MNRAS, 366, 1151
- Sérsic (1968) Sérsic, J. L. 1968, Atlas de galaxias australes (Observatorio Astronomico, Cordoba)
- Spolaor et al. (2010) Spolaor, M., Kobayashi, C., Forbes, D. A., Couch, W. J., & Hau, G. K. T. 2010, MNRAS, 408, 272
- Thomas & Davies (2006) Thomas, D. & Davies, R. L. 2006, MNRAS, 366, 510
- Thomas et al. (2003) Thomas, D., Maraston, C., & Bender, R. 2003, MNRAS, 339, 897
- Vazdekis et al. (2010) Vazdekis, A., Sánchez-Blázquez, P., Falcón-Barroso, J., et al. 2010, MNRAS, 404, 1639
- Worthey et al. (1994) Worthey, G., Faber, S. M., Gonzalez, J. J., & Burstein, D. 1994, ApJS, 94, 687
- Worthey & Ottaviani (1997) Worthey, G. & Ottaviani, D. L. 1997, ApJS, 111, 377