Hierarchy in Gene Expression is Predictive of Risk, Progression, and Outcome in Adult Acute Myeloid Leukemia
Abstract
Cancer progresses with a change in the structure of the gene network in normal cells. We define a measure of organizational hierarchy in gene networks of affected cells in adult acute myeloid leukemia (AML) patients. With a retrospective cohort analysis based on the gene expression profiles of 116 acute myeloid leukemia patients, we find that the likelihood of future cancer relapse and the level of clinical risk are directly correlated with the level of organization in the cancer related gene network. We also explore the variation of the level of organization in the gene network with cancer progression. We find that this variation is non-monotonic, which implies the fitness landscape in the evolution of AML cancer cells is nontrivial. We further find that the hierarchy in gene expression at the time of diagnosis may be a useful biomarker in AML prognosis.
pacs:
87.19.xj, 89.75.Fb, 89.75.-kKeywords: AML, cancer progression, cancer genes, cancer network
1 Introduction
Cancer cells break the most basic rules of cell behavior by which multicellular organisms are built and maintained, and they exploit every kind of opportunity to do so [1]. They proliferate without restraint and prosper at the expense of their neighbors in a multicellular environment. The development of cancer typically requires that a substantial number of independent, rare genetic and epigenetic accidents occur in the lineage of one cell. Cancer, therefore, involves changes in the pattern of gene expression in normal cells. It involves disruption in the normal mechanisms of gene control and regulation, which results in correlated gene networks in a cell going astray. Since cancer progresses with changes in the gene network, the structure of the gene network in cancer cells may be predictive of clinical risk and outcome [2, 3, 4, 5, 6, 7, 8, 9, 10].
Acute myeloid leukemia (AML) is the most common acute leukemia in adults. Chemotherapy induces a complete remission in 70 to 80 percent of patients aged 16 to 60 years, but many of them have a relapse and die of their disease. Myeloablative conditioning followed by allogeneic stem-cell transplantation can prevent relapse, but this approach is associated with a high treatment-related mortality. Therefore, accurate predictors of the clinical outcome are needed to determine appropriate treatment for individual patients [11, 12]. Currently used prognostic indicators include age, cytogenetic findings, the white-cell count, and the presence or absence of an antecedent hematologic disorder [13].
Cancer is a microevolutionary process. We are motivated to study the hierarchical structure in cancer affected cells by a theory that relates development of hierarchy during evolution to environmental stress and variability [14, 15, 16, 17]. According to this theory, during evolution in a rugged fitness landscape amidst a changing environment a system tends to become more hierarchical, since hierarchy tends to increase the adaptability of the system. Therefore, we expect more aggressive cancer cells to exhibit a higher level of hierarchical organization in their cancer related gene network. Cancers with a more hierarchical cancer related gene network are expected to be more adaptable and competitive, and thus have a higher chance of relapsing. We here provide support for this theory in the case of AML.
Structure in gene networks in cancer cells has been quantified, and it has been found to be useful in cancer prognosis. Vineetha et al. applied a TSK-type recurrent neural fuzzy approach to extract regulatory relationship among genes and to reconstruct gene regulatory network from microarray data from colon cancer cells. Structure in this regulatory network provided new insights into colon cancer diagnostics [18]. Taylor et al. used the co-expression of hub proteins and their partners to identify whether interactions are context-specific, or constitutive. They found that loss of co-regulation in cancer results in disruptions in hub protein components of interaction networks [2, 3]. Ford et al. used gene expression microarray data to predict the recurrence time in lung cancer [19].
Hierarchy is a measure of modularity that exists in gene expression networks at different levels. Here, we quantify the hierarchy in cancer related gene networks and explore its relation with clinical risk and outcome in AML. That is, we study the relation between cancer relapse and the structural features of the gene network in cancer affected cells. We will show that the level of organization and hierarchy in the cancer related gene network in AML affected cells can serve as a biomarker in AML prognosis. There is a significant difference in the hierarchy measure between patients that have a cancer relapse (34 patients) and those that do not (43 patients) (-value=0.0012). The area under the ROC curve for the classifier that discriminates between the relapse and no relapse patient cohorts on the basis of the hierarchy measure is , which is significant compared to a random classifier.
2 Methods
2.1 Patients
We performed a retrospective cohort analysis based on the gene expression profiles of acute myeloid leukemia patients (samples provided by the AML Study Group, Ulm, Germany). The gene expression data were previously obtained from samples obtained from 116 AML patients (median age, 50 years) [11]. Of the various genes analyzed, 133 genes predictive of clinical outcome were identified [11]. Relapse in patients was monitored during the follow up visits. Subsequent reports, working with other datasets, have also reported gene expression data in AML associated with prognosis [20, 21, 22].
During the follow up period, 68 of the 116 patients died, and 34 of the 79 patients who had complete remission relapsed. 20 patients were also reported to have developed a refractory cancer disease. For the patients who died during the follow up period, the overall survival since diagnosis was also reported.
2.2 Cytogenetics
Cytogenetic analysis can be used to classify AML patients as being at low risk [t(8;21), t(15;17), or inv(16)], intermediate risk [e.g., a normal karyotype or t(9;11)], or high risk [e.g., inv(3), -5/del(5q), -7, or a complex karyotype (three or more aberrations)] [23, 24, 25]. We categorized the patients into these categories depending on the cytogenetic aberration reported for each patient [11].
2.3 Gene networks for different patient categories
To study the structure and organization of the gene network in different patient groups, we defined a network consisting of 133 genes previously identified as being predictive of clinical outcome in AML [11] as nodes. The weight of the link between any two nodes was defined using the Pearson correlation coefficient as
| (1) |
Here is the expression data of gene for patient from [11], is the average expression value for gene for the patients, and is the standard deviation of expression value of gene for the patients. Using the above definition, we make comparisons between the following sets of categories of patients:
2.3.1 Relapse, remission with no relapse, and refractory disease groups
In order to make comparisons between these groups that contain a different number of patients each, we chose 16 patients randomly from each group and constructed the gene network. This random selection of patients from each category helps to mitigate the bias due to different group sizes. We repeated this procedure 100 times which gave us 100 networks for each group. Error bars were calculated using this bootstrap procedure. Representative networks are shown in Figure 1.
a)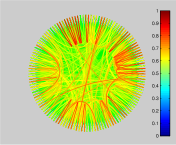 b)
b)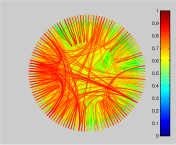 c)
c)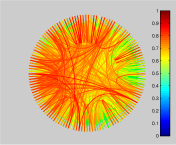
2.3.2 Low, intermediate, and high risk groups
The karyotype was used to classify AML patients into low risk, intermediate risk, or high risk categories depending on the cytogenetic aberration reported for each patient [11]. We thus had three categories of patients: low risk group consisting of 38 patients, intermediate risk group consisting of 57 patients, and high risk group consisting of 16 patients. To make comparisons between these groups that contain a different number of patients each, we randomly chose 12 patients from each category and constructed the cancer related gene network. We repeated this procedure 100 times to mitigate any bias due to unequal sample sizes. This gave us 100 networks for each risk category. We calculated error bars using this bootstrap procedure.
2.3.3 Groups with cancer at different levels of progression
68 of the 116 patients died during the follow up period. The overall survival since diagnosis had been reported for each of these patients [11]. We sorted the survival time dataset in descending order and divided it into 6 groups, each consisting of 16.67% of the dataset. Samples were assigned into groups (sextiles) based on length of survival from initial cancer diagnosis. We constructed the gene network for each of these groups as stated above using Eq. (1) to define links between nodes.
2.4 Gene network for each patient
We constructed a network with 133 cancer related genes as nodes for each patient in our dataset. Two different methods were used to define the weights of the links in the network.
2.4.1 Deviation of gene expression from average expression profile of AML cells
We defined the weight of the link between any two nodes and in the network for patient as follows:
| (2) |
where (expression of gene in patient - expression of gene in patient )2, i.e. the deviation of gene expression for patient from the average in the entire cancer dataset [11]. We will show that the structure of such a network can discriminate between the patients that have cancer relapse and those that do not.
2.4.2 Deviation of gene expression from average expression in different normal human tissues
We used the gene expression data previously collected from 79 normal human tissues [26]. Cancer cells exhibit a gene expression profile different from cells in normal human tissues due to various mutations. We were motivated to study the deviations from normal expression profiles in different patients and the level of organization in these deviations. We, therefore, constructed a network with 133 cancer related genes as nodes and defined the weight of a link between nodes and as follows:
| (3) |
where (average expression of gene in normal tissue - expression of gene in cancer cells in patient )2, i.e. the deviation of expression of gene in patient from the average expression of gene in normal human tissues [26].
2.5 The
To quantify the structure in these gene networks, we defined a measure of hierarchy that quantifies how “tree-like” a network is [27]. The motivation behind this is that a tree network topology is the typical hierarchical structure. To calculate this measure, we computed the distance matrix defined by the network. The distance between nodes and , , is defined by the square root of the commute time. The commute time is the expected time taken by a random walker to travel from one of the nodes to the other and back to the starting node [28]. Besides the weight of the link between the nodes and , the commute time between nodes and also depends on all possible paths between the two nodes in the graph. In a weighted graph, the commute time between two nodes decreases with an increase in the number of possible paths from one node to the other and increases with an increase in the length of any path connecting the two nodes. Due to these properties, the commute time is well suited for clustering tasks. To define the commute time, we let denote the graph Laplacian, defined as , where is the matrix of links, in Eq. (1), (2) or (3), and the diagonal matrix , with . The commute time is obtained using , the Moore-Penrose pseudoinverse of the graph Laplacian by [29]
| (4) |
Here , and . Since is symmetric and positive semidefinite, is a Euclidean distance metric, called the Euclidean commute time (ECT) distance.
To construct a tree topology that best approximates our original network, we applied the average linkage hierarchical clustering algorithm [30]. This method takes the distance matrix defined by the gene network and produces a tree topology that best reproduces the original distances. The tree topology has the same nodes as the original network but different weights for the links between nodes. We calculated the correlation between the distances between all pairs of nodes in the original network and the distances between these pairs in the best-fitting tree. This gives the cophenetic correlation coefficient (). The higher the correlation, the better does the tree topology approximate the original network and, thus, the more hierarchical is the original network. The best fitting tree to the distance metric data defines an approximation to the original network, termed the cophenetic matrix. The element of the cophenetic matrix is the height where the network nodes and become members of the same cluster in the tree. It defines the distance between the nodes and . The is defined as
| (5) |
Here is the average of the distances in the original network, , and is the average of the tree distances, .
3 Results
a)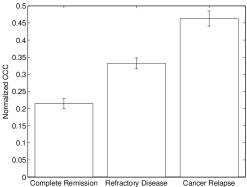 b)
b)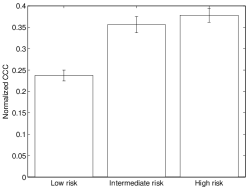
3.1 Clinical outcome groups

We constructed networks comprising of 133 cancer related genes as nodes and the links calculated using Eq. (1) for each out of the three outcome categories: relapse, refractory disease, and complete remission with no relapse during follow up. Figure 2a shows the results. We compared these values with those from a random network with the same number of nodes and edges as the cancer related gene networks. We built 100 such random networks with redistributed link values. We defined a normalized cophenetic correlation coefficient as follows: where is the average for a random network of the same size. Normalized values are shown in Figure 2a. We computed the -scores of the cancer-associated network relative to the distribution of the values of the random networks of the same size and sparsity: . The -scores for remission (no relapse), refractory disease, and relapse are , and , respectively. The difference between remission and relapse groups is significant for a Student’s t-test with a -value .
3.2 Risk groups
Figure 2b shows the normalized values for the three categories calculated as before. The high risk category has the maximum hierarchy among the three groups followed by intermediate, and low risk groups. The -scores for low, intermediate, and high risk groups are , and , respectively.
3.3 Cancer Progression
We again constructed the cancer related gene network for patients exhibiting different sextiles of survival time and calculated the average normalized CCC and standard error in this average. The results are as shown in Figure 3 wherein the independent axis indicates the time period between AML diagnosis and death, which we interpret as a measure of cancer progression, and the dependent axis indicates the mean normalized CCC. We observe that the variation of mean with increasing levels of cancer progression is non-monotonic. This result makes manifest the non-trivial changes that occur in the cancer related gene expression network as a function of remaining survival time.
3.4 Gene network for individual patients
We constructed a cancer related gene network for each of the 116 patients with 133 cancer related genes as nodes and links defined in two different ways:
3.4.1 Deviation of cancer cells gene expression from average expression profile of AML cells
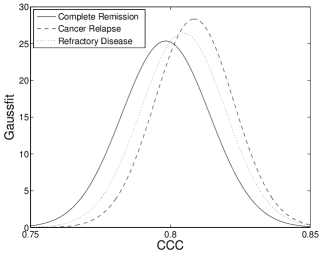
The links between nodes were calculated using Eq. (2). The distribution of values for relapse, remission, and refractory disease are shown in Figure 4. The difference between patients exhibiting relapse and those exhibiting complete remission is statistically significant for a Student’s t-test with a -value of . We plot a curve for the prediction that patients with cutoff have a relapse. The area under the curve is which is significant compared to a random classifier.
3.4.2 Deviation of cancer cells gene expression from average expression in different healthy human tissues
The links between nodes are calculated using Eq. (3). The difference between patients exhibiting relapse and those exhibiting complete remission is significant with a -value of . We plot a curve for the prediction that patients with cutoff have a relapse, shown in Figure 5a. The area under the curve is which is significant compared to a random classifier.
We further used the values for individual patient gene networks to predict the risk of death within 3 years of cancer diagnosis. For this purpose, we used the cancer related gene network for each patient with links calculated using Eq. (2). We calculated the values for 68 patients who died during the follow up period and for the patients who were alive at the end of follow up. The difference between the two categories is statistically significant for a Student’s t-test with a -value . Using these values for the two groups, we attempted to predict the chances of death within 3 years of cancer diagnosis by setting a cutoff on the values. The of the curve for this prediction is which is again significant as compared to a random classifier.
a)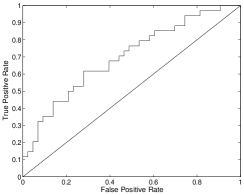 b)
b)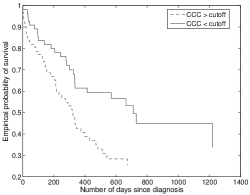
4 Discussion
There are selection pressures on a tumor that are distinct from those upon the host. The proliferation and progression of cancer involves activation of cancer-specific gene pathways, perhaps hijacked ancestral host pathways [31]. Thus, in contrast to the classical view of cancer as a dedifferentiation of the host, progression of a tumor may involve structuring of specific expression pathways. For example, we have here suggested that a more aggressive and resistant cancer is expected to have a more structurally organized and modular cancer-associated network. This is, indeed, observed in Figure 2a. The average is the highest for patients that exhibit a cancer relapse during the follow up. Post remission, there is competition between the residual cancerous cells and the normal or transplanted stem cells in the bone marrow. To compete against and to drive out these cells, there is selection for a more organized and modular cancer related genes network among the AML cells. Hence, we expected higher hierarchy in the gene network for patients that exhibit cancer relapse during follow up. For patients that exhibit complete cancer remission and no relapse, the average is the lowest. In these patients, the cancer cells are completely eradicated during chemotherapy. Any residual cells in the bone marrow, if present, are unable to compete against the normal stem cells and are unable to start proliferating again aggressively enough for cancer to relapse. Therefore, we expected cancer cells in these patients to exhibit the lowest level of organization in the cancer related genes network. In some AML cases, the cancer cells evolve mechanisms to resist the entry of anti-cancer chemo drugs into the cells. These cancers are thus resistant to existing chemotherapy procedures, and such patients are said to have a refractory cancer disease. In such cases, there is less selection pressure on AML cells since these are already resistant to anti-cancer drugs. Hence, we expected the cancer related gene network in such patients to be less organized as compared to patients that exhibit relapse. On the other hand, since these cancer cells are drug resistant and also compete with the normal bone marrow cells, they exhibit a higher level of organization as compared to cancer cells from patients exhibiting complete remission.
Cancers exhibiting a higher level of organizational hierarchy and modularity in the cancer related genes network are expected to be more competitive, proliferative, and aggressive and, thus, present a higher level of risk for the host. This is, indeed, observed in Figure 2b wherein the average increases with increasing risk. Here, the different risk categories were determined depending of the cytogenetic profile of the patients [23, 24, 25, 11].
We also calculated the average of the cancer related gene network for patients as a function of survival time since initial cancer diagnosis. The results are shown in Figure 3. As cancer progresses, cancer cells compete with the host cells for oxygen and nutrition. The host immune system attempts to resist or eradicate tumor progression [32, 33, 34, 35]. Cancer cells thus evolve in a rugged fitness landscape. Therefore, there is selection for more effective, aggressive, and proliferative gene pathways since cancer cells evolve amidst tremendous environmental pressure from the host cells and the host immune system [36]. During evolution in such a rugged fitness landscape, theory shows that modularity in gene networks is selected for [14, 15]. Therefore, the cancer related gene network becomes more organized and modular as cancer progresses and matures. However, once the cancer reaches a mature phase, the host immune system is severely compromised, especially in the cancer microenvironment [37, 38]. Also, cancer cells now dominate the tissue environment with their high proliferation rates, induced angiogenesis and reprogrammed energy metabolism [39]. Therefore, there is less selection pressure since the cancer cells do not have to compete as much with the host marrow cells or the impaired and compromised immune system. This presents a relatively smooth fitness landscape for cancer cell evolution with little or no selection, and theory shows that modularity is selected for less strongly [14, 15]. Thus, we expect the level of organization of the cancer associated gene network to decline once the cancer has dominated the host. That is, we suggest that the level of organization in the cancer related gene networks declines due to less selection pressure requiring this costly structure in the advanced phase of the cancer. Modifications to the expression network of the cancer associated genes may stem from mutations, compromised DNA replication, or other mechanisms in cancer cells [40]. We suggest that nonmonotonic selection pressure may be the reason for the nonmonotonic variation of modularity with cancer progression seen in Figure 3.
We also attempted to differentiate between patients that exhibit relapse during follow up from patients that do not show any relapse using the level of organization in cancer related gene network in their cancerous cells at the time of diagnosis. For this, we constructed a cancer related gene network for each patient with 133 cancer related genes as nodes and links defined with either Eq. (2) or (3). We then set a cutoff on the values to discriminate between patients with relapse and non-relapse cases. The area under the curve is and , respectively, for the two cases which is significant as compared to a random classifier. We also constructed a cancer related gene network for each patient using Eq. (3), considering deviation of gene expression in cancer cells from normal, non-cancerous, healthy bone marrow, and myeloid blood cells only. When classifying using values calculated from these networks, the area under the curve (not shown) was . Similarly, we attempted to predict the chances of death for a patient within 3 years of diagnosis using the value of the cancer related gene network at the time of diagnosis. We again set a cutoff on the values to discriminate between patients who died during the follow up from patients that were alive at the end of follow up. The is which is again statistically significant in comparison with a random classifier. The of the cancer related gene network in the cancerous cells of a patient is a biomarker in AML prognosis. It is discriminating and may help identify patients that are at a higher risk of a relapse after a typical chemotherapy regime before the treatment has begun. This biomarker may also help to identify the overall risk that the patient is subject to, which may be helpful in deciding upon a chemotherapy regime for each patient.
5 Conclusion
We defined a measure of hierarchical organization in gene pathways in AML cancer cells. With a retrospective cohort analysis based on the gene expression profiles of 116 acute myeloid leukemia patients, we found that the level of organization, indicated by values, correlates with the clinical outcome in AML and with the level of risk the cancer presents for the host. It also correlates with the survival period in the case of dead patients. We expected this result since a more organized and modular network of cancer associated genes is likely to contribute towards a more aggressive form of cancer. Further, since cancer cells evolve in a rugged fitness landscape, a more organized cancer related gene network will be selected for amidst the immense selection pressure in a changing, hostile environment [14, 15, 1]. We also showed how the level of organization in cancer associated gene pathways varies as cancer progresses and matures. This variation is non-monotonic, likely due to a decrease in the selection pressure once the cancer dominates. Finally, the calculated for each patient can serve as a biomarker in AML prognosis to assess the risk of relapse and overall risk level for a patient and thus to inform a suitable personalized treatment regime.
Acknowledgment
This work was supported by the US National Institutes of Health under grant 1 R01 GM 100468-01. Shubham Tripathi is a recipient of the Khorana Fellowship for the year 2014.
Supplemental Information
Files listing the 133 cancer-related genes studied as well as clinical outcome, risk group, and CCC for each patient are available as supplemental information.
References
- [1] Alberts B, Johnson A, Lewis J, Raff M, Roberts K and Walter P 2007 Molecular Biology of the Cell, Fifth Edition, Chapter 20 (Garland Science, Taylor and Francis Group)
- [2] Taylor I W, Linding R, Warde-Farley D, Liu Y, Pesquita C, Faria D, Bull S, Pawson T, Morris Q and Wrana J L 2009 Dynamic modularity in protein interaction networks predicts breast cancer outcome. Nature Biotechnology 27 199–204 ISSN 1546-1696
- [3] Chuang H Y, Lee E, Liu Y T, Lee D and Ideker T 2007 Network-based classification of breast cancer metastasis. Molecular Systems Biology 3 140 ISSN 1744-4292
- [4] Pavlidis P, Lewis D P and Noble W S 2002 Exploring gene expression data with class scores. Pac. Symp. Biocomput. 474–485
- [5] Doniger S W, Salomonis N, Dahlquist K D, Vranizan K, Lawlor S C and Conklin B R 2003 Mappfinder: Using gene ontology and genmapp to create a global gene-expression profile from microarray data. Genome Biol. 4 R7
- [6] S S D, Khatri P, Martins R P, Ostermeier G C and Krawetz S A 2003 Global functional profiling of gene expression Genomics 81 98–104
- [7] Subramanian A, Tamayo P, Mootha V K, Mukherjee S, Ebert B L, Gillette M A, Paulovich A, Pomeroy S L, Golub T R, Lander E S and Mesirov J P 2005 Gene set enrichment analysis: A knowledge-based approach for interpreting genome-wide expression profiles. Proc. Natl. Acad. Sci. USA 102 15545–15550
- [8] Tian L, Greenberg S A, Kong S W, Altschuler J, Kohane I S and Park P J 2005 Discovering statistically significant pathways in expression profiling studies. Proc. Natl. Acad. Sci. USA 102 13544–13549
- [9] Wei Z and Li H 2007 A Markov random field model for network-based analysis of genomic data. Bioinformatics 23 1537–1544
- [10] Rapaport F, Zinovyev A, Dutreix M, Barillot E and Vert J P 2007 Classification of microarray data using gene networks. Bioinformatics 8 35
- [11] Bullinger L, Döhner K, Bair E, Fröhling S, Schlenk R F, Tibshirani R, Hartmut H D and Pollack J R 2004 Use of gene-expression profiling to identify prognostic subclasses in adult acute myeloid leukemia New England Journal of Medicine 350 1605–1616 pMID: 15084693
- [12] Giles F J et al. 2002 Acute myeloid leukemia Hematology 2002 73–110
- [13] Lowenberg B 2001 Prognostic factors in acute myeloid leukaemia Best Practice & Research Clinical Haematology 14 65 – 75 ISSN 1521-6926
- [14] Sun J and Deem M W 2007 Spontaneous emergence of modularity in a model of evolving individuals. Phys. Rev. Lett. 99 228107
- [15] He J, Sun J and Deem M W 2009 Spontaneous emergence of modularity in a model of evolving individuals and in real networks Physical Review E 79 031907
- [16] Lorenz D, Jeng A and Deem M W 2011 Modularity in biological systems Physics of Life Reviews 8 129–160
- [17] Deem M W 2013 Statistical mechanics of modularity and horizontal gene transfer. Annu. Rev. Conden. Matter Phys. 4 287–311
- [18] Vineetha S, Bhat C C S and Idicula S M 2012 Gene regulatory network from microarray data of colon cancer patients using TSK-type recurrent neural fuzzy network Gene 506 408 – 416 ISSN 0378-1119
- [19] Ford W, Park J W, Campbell A S, Deng Y, Li Y and Jr W H L 2012 Classifying lung cancer recurrence time using novel ensemble method with gene network based input models Procedia Computer Science 12 444 – 449 ISSN 1877-0509 complex Adaptive Systems 2012
- [20] Radmacher M and othes 2006 Independent confirmation of a prognostic gene-expression signature in adult acute myeloid leukemia with a normal karyotype: a cancer and leukemia group b study Blood 108 1677–1683
- [21] Metzeler K et al. 2008 An 86-probe-set gene-expression signature predicts survival in cytogenetically normal acute myeloid leukemia Blood 112 4193–4201
- [22] Li Z et al. 2013 Identification of a 24-gene prognostic signature that improves the european leukemianet risk classification of acute myeloid leukemia: an international collaborative study J. Clin. Oncol. 31 1172–1181
- [23] Grimwade D, Walker H, Oliver F, Wheatley K, Harrison C, Harrison G, Rees J, Hann I, Stevens R, Burnett A and Goldstone A 1998 The importance of diagnostic cytogenetics on outcome in AML: Analysis of 1,612 patients entered into the MRC AML 10 trial Blood 92 2322–2333 ISSN 0006-4971
- [24] Byrd J C et al. 2002 Pretreatment cytogenetic abnormalities are predictive of induction success, cumulative incidence of relapse, and overall survival in adult patients with de novo acute myeloid leukemia: results from Cancer and Leukemia Group B (CALGB 8461) Blood 100 4325–4336 ISSN 0006-4971
- [25] Slovak M L et al. 2000 Karyotypic analysis predicts outcome of preremission and postremission therapy in adult acute myeloid leukemia: a southwest oncology group/eastern cooperative oncology group study Blood 96 4075–4083 ISSN 0006-4971
- [26] Su A I, Wiltshire T, Batalov S, Iapp H, Ching K A, Block D, Zhang J, Soden R, Hayakawa M, Kreiman G, Cooke M P, Walker J R and Hogenesch J B 2004 A gene atlas of the mouse and human protein-encoding transcriptomes. Proc. Natl. Acad. Sci. USA 101 6062–6067 ISSN 0027-8424
- [27] Chen M and Deem M W 2013 Hierarchy of gene expression data is predictive of future breast cancer outcome Phys. Biol. 10 056006
- [28] Saerens M, Fouss F, Yen L and Dupont P 2004 The principal components analysis of a graph, and its relationships to spectral clustering Proceedings of the 15th European conference on machine learning (ECML)
- [29] Barnett S 1990 Matrices: Methods and Applications (Oxford University Press)
- [30] Sokal R and Michener C 1958 A statistical method for evaluating systematic relationships University of Kansas Science Bulletin 38 1409–1438
- [31] Davies P C W and Lineweaver C H 2011 Cancer tumors as Metazoa 1.0: Tapping genes of ancient ancestors. Physical Biology 8 015001
- [32] Frey A B 2006 Myeloid suppressor cells regulate the adaptive immune response to cancer The Journal of Clinical Investigation 116 2587–2590
- [33] Finn O J 2008 Cancer immunology New England Journal of Medicine 358 2704–2715 pMID: 18565863
- [34] Vesely M D, Kershaw M H, Schreiber R D and Smyth M J 2011 Natural innate and adaptive immunity to cancer Annual Review of Immunology 29 235–271 pMID: 21219185
- [35] Suzuki H, Graziano D F, McKolanis J and Finn O J 2005 T Cell–Dependent antibody responses against aberrantly expressed cyclin B1 protein in patients with cancer and premalignant disease Clinical Cancer Research 11 1521–1526
- [36] Anderson A R, Weaver A M, Cummings P T and Quaranta V 2006 Tumor morphology and phenotypic evolution driven by selective pressure from the microenvironment Cell 127 905 – 915 ISSN 0092-8674
- [37] Le Dieu R, Taussig D C, Ramsay A G, Mitter R, Miraki-Moud F, Fatah R, Lee A M, Lister T A and Gribben J G 2009 Peripheral blood T cells in acute myeloid leukemia (AML) patients at diagnosis have abnormal phenotype and genotype and form defective immune synapses with AML blasts Blood 114 3909–3916 ISSN 0006-4971
- [38] Buggins A G S, Milojkovic D, Arno M J, Lea N C, Mufti G J, Thomas N S B and Hirst W J R 2001 Microenvironment produced by acute myeloid leukemia cells prevents T cell activation and proliferation by inhibition of NF–kappaB, c–Myc, and pRb pathways The Journal of Immunology 167 6021–6030
- [39] Hanahan D and Weinberg R A 2000 The hallmarks of cancer Cell 100 57 – 70 ISSN 0092-8674
- [40] Negrini S, Gorgoulis V G and Halazonetis T D 2010 Genomic instability An evolving hallmark of cancer Nat Rev Mol Cell Biol 11 220–228