A NEW DYNAMICAL MASS MEASUREMENT FOR THE VIRGO CLUSTER USING THE RADIAL VELOCITY PROFILE OF THE FILAMENT GALAXIES
Abstract
The radial velocities of the galaxies in the vicinity of a cluster shows deviation from the pure Hubble flow due to their gravitational interaction with the cluster. According to a recent study of Falco et al. (2014) based on a high-resolution N-body simulation, the radial velocity profile of the galaxies located at distances larger than three times the virial radius of a neighbor cluster can be well approximated by a universal formula and could be reconstructed from direct observables provided that the galaxies are distributed along one dimensional filament. They suggested an algorithm for the estimation of the dynamic mass of a cluster by fitting the universal formula from the simulation to the reconstructed radial velocity profile of the filament galaxies around the cluster from observations. We apply the algorithm to two narrow straight filaments (called the Filament A and B) that were identified recently by Kim et al. (2015) in the vicinity of the Virgo cluster from the NASA-Sloan-Atlas catalog. The dynamical mass of the Virgo cluster is estimated to be and for the cases of the Filament A and B, respectively. We discuss observational and theoretical systematics intrinsic to the method of Falco et al. (2014) as well as the physical implication of the final results.
1 INTRODUCTION
The simplest and probably the most reasonable explanation for the current acceleration of the universe is the anti-gravitational effect of the cosmological constant () that is supposed to be dominant at the present epoch. The fundamental assumption that underlies this explanation is that the general relativity (GR) is the universal law of gravity, the validity of which has been confirmed by recent cosmological observations (Reyes et al., 2010; Wojtak et al., 2011; Rapetti et al., 2013). Besides, the latest news from the Planck CMB (Cosmic Microwave Background) mission has drawn the following bottom line (Planck 2015 results XIV, 2015): The risk that one has to take by accepting the CDM (+cold dark matter) cosmology founded upon GR is lower than that by accepting any other alternative.
Nevertheless, the conceptual difficulty to acquiesce in the extremely fine-tuned initial conditions of the universe associated with still dares the cosmologists to take a high risk of suggesting modified gravity (MG) models and developing independent tests of GR. One of the most plausible tests of GR on the cosmological scale is to compare the lensing mass of a cluster with its dynamic mass (e.g., see Schmidt et al., 2009; Schmidt, 2010; Zhao et al., 2011). The former is estimated from the weak gravitational lensing effect generated by the mass of a cluster on the shapes of the foreground galaxies, while the latter is conventionally derived from the velocity dispersions of the central satellites of a cluster. A substantial discrepancy between the two mass measurements for a cluster, if found and accurately measured, would challenge the key tenet of GR.
However, it is a formidable task to measure the dynamical mass of galaxy clusters with high accuracy. The success of the conventional method of using the satellite velocity dispersions is contingent upon the completion of relaxation in the dynamical state and the spherical symmetry in the shape. There is another method for the dynamical mass measurement of the clusters that uses the peculiar velocities of the neighbor galaxies located beyond the virial radius of a cluster. This method can be applied even to those clusters which have yet to be completely relaxed without having spherical symmetry (Corbett Moran et al., 2014). However, large uncertainties inherently involved in the measurements of the peculiar velocity field remain as a technical bottleneck that stymies the accurate measurement of the dynamic mass of a cluster from the peculiar velocities of the neighbor galaxies (see also Corbett Moran et al., 2014; Gronke et al., 2014b; Hellwing et al., 2014; Zu et al., 2014)
Falco et al. (2014) devised a novel method to measure the dynamic mass of a cluster by using the universal radial velocity profile of the filament galaxies around the cluster. The sole condition for the practical success of their method is that the neighbor galaxies should be distributed along a narrow filament. Since it has been theoretically and observationally shown that the formation of galaxy clusters preferentially occur at the junction of the cosmic filaments (e.g., see Bond et al., 1996; Dietrich et al., 2012), the majority of the galaxy clusters should meet this condition, being eligible for the application of this method. The method of Falco et al. (2014) to measure the virial mass of a cluster from the radial velocity profile of the filament galaxies is applicable even to those clusters which have yet to complete its relaxation process. In this respect their method fits especially well for the Virgo cluster that still undergoes merging events. Furthermore, the measurements of the redshifts and equatorial coordinates of the galaxies in the vicinity of the Virgo cluster were done with high accuracy thanks to their proximity, which will help reduce uncertainties in the dynamical mass measurement with the method of Falco et al. (2014) for the Virgo cluster. The goal of this paper is to test this new method against the Virgo cluster around which the narrow filamentary structures were recently identified by Kim et al. (2015).
The upcoming sections will present the following. A review of the method of Falco et al. (2014) in Section 2. A reconstruction of the radial velocity profile of the filament galaxies around the Virgo cluster and a new dynamical mass estimate for the Virgo cluster by comparing the reconstructed profile with the numerical formula from Falco et al. (2014) in Section 3. Discussions on the final results and on the future works for the improvements in Section 4. Throughout this paper, we assume a GR+CDM cosmology with and zero curvature, to be consistent with Falco et al. (2014).
2 METHODOLOGY : A BRIEF REVIEW
The galaxies located in the vicinity of a cluster must feel the gravity of the cluster even in the case that they are not the satellites bound to the cluster, and thus their motions relative to the cluster should deviate from the pure Hubble flows. To quantify the degree of the deviation of the galaxy motions from the Hubble flows and its dependence on the cluster mass, Falco et al. (2014) determined the mean radial velocity profile of the galaxies in the vicinity of the clusters from a high-resolution N-body simulation for the GR+CDM cosmology. Their numerical experiment has discovered that the mean radial velocity profile of the neighbor galaxies located in the zone where the effect of the Hubble expansion exceeds that of the gravitational attraction of a cluster is well approximated by the following universal formula:
| (1) |
where is the mean radial velocity at (comoving) separation distance from the cluster center, , and are the virial mass, radius and velocity of the cluster, respectively, and is the Hubble parameter at redshift . The first term in the right-hand side represents a pure Hubble flow from the cluster center while the second term corresponds to the mean peculiar velocity induced by the gravitational attraction of the cluster.
According to Falco et al. (2014), the radial velocity profile is universal in the respect that the power-law index, , in Equation (1) has a constant value of , being independent of and . They also showed that the zone where the radial velocities of the galaxies are well approximated by Equation (1) with corresponds to the range of . Adopting the conventional definition that is the radius of a sphere within which the mass density reaches times the critical density of the Universe , Falco et al. (2014) used the following simple relations to calculate the virial mass and the virial velocity for Equation (1):
| (2) |
The value of was set at in accordance with the formula of given by Bryan & Norman (1998).
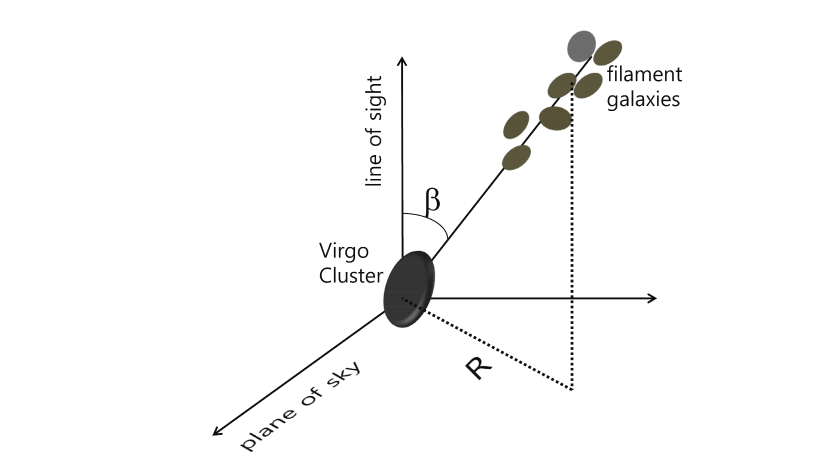
Falco et al. (2014) suggested that the virial mass of a massive cluster be estimated by comparing the observed radial velocity profile of its neighbor galaxies to Equation (1). However, since the real values of and are not directly measurable, it is difficult to determine the radial velocity profiles of the galaxies from observational data. They claimed that this difficulty should be overcome by using the anisotropic spatial distribution of the galaxies belonging to a one-dimensional filament in the vicinity of a cluster. Three dimensional separation distance and the radial velocity of the filament galaxies can be estimated from two direct observables, the projected distance in the plane of the sky and the line-of-sight velocity , as and , respectively, where is the angle at which the filament is inclined to the line of sight direction to a cluster (see Figure 1). Finally, Equation (1) was rewritten in terms of the observables as
| (3) |
Since the galaxy clusters usually form at the junction of the cosmic filaments, this new scheme of Falco et al. (2014) seems quite plausible. However, the validity of Equation (3) depends strongly on the geometrical shape of the filament. The more straight and narrow a filament is, the better Equation (1) is approximated by Equation (3). Figure 1 illustrates a three dimensional configuration of a filamentary structure around a cluster inclined at an angle to the line of sight direction to the cluster, defining the projected distance between a filament galaxy and the cluster center in the plane of sky. Falco et al. (2014) performed a numerical test of Equation (3) by applying it to three cluster-size halos around which filamentary structures were found. The estimated values of turned out to agree very well with the true virial masses for all of the three cases, which numerically verified the validity of Equations (3).
Falco et al. (2014) also performed an observational test of their algorithm by applying it to the sheet structures identified around the Coma cluster. Despite their claim that the dynamic mass of the Coma cluster determined by their method turned out to be consistent with the previous estimates, their method, strictly speaking, is valid only for the galaxies distributed along a one-dimensional filamentary structure that interacts gravitationally with the cluster. In fact, it is obvious from Equation (3) that large uncertainties should contaminate the measurement of the cluster mass if the radial velocity profile is reconstructed from the sheet galaxies.
3 ESTIMATING THE DYNAMIC MASS OF THE VIRGO CLUSTER
3.1 The Zero-th Order Approximation
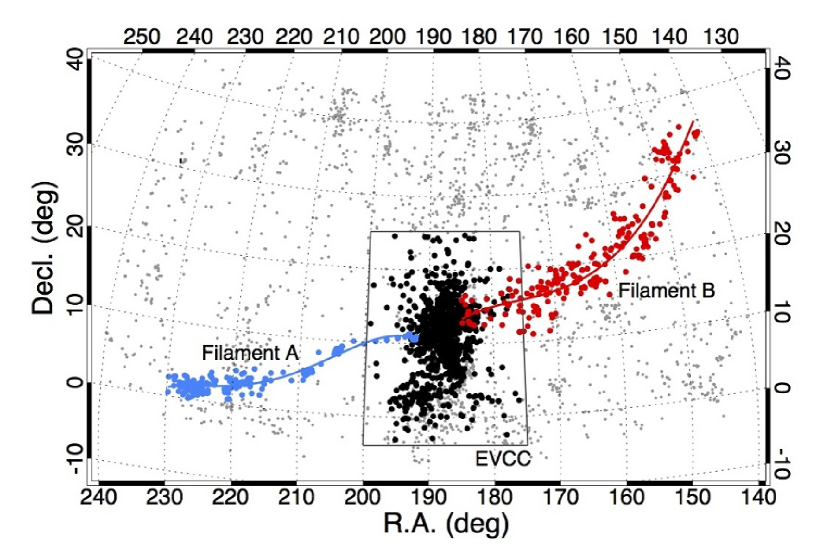
Kim et al. (2015) developed an efficient technique to identify a filamentary structure whose galaxies are under the gravitational influence of a neighbor cluster. The merit of their filament-finding technique is that it requires information only on observable redshifts and two dimensional positions of the galaxies projected onto the plane of sky. Applying this filament-finding technique to the NASA-Sloan-Atlas catalog of the local galaxies111given in http://www.nsatlas.org/data, Kim et al. (2015) have identified two narrow filamentary structures to the east and to the west of the Virgo cluster (say, the Filament A and B, respectively). Both of the Filament A and B were found to consist mainly of the dwarf galaxies with absolute -band magnitudes . For a detailed description about how the Filament A and B were identified from the NASA-Sloan-Atlas catalog, see Kim et al. (2015).
Figure 2 plots the right asensions (R.A.) and declinations (decl.) of the galaxies belonging to the filament A and B, as filled blue and red dots, respectively. The certain and possible member galaxies of the Virgo cluster from the Extended Virgo Cluster Catalog (EVCC) (Kim et al., 2014) are shown as the black and gray dots, respectively, inside an open rectangular box. The gray dots outside the box represent the field galaxies that do not belong to the EVCC nor to the two filaments but in the redshift range of . Note that the Filament A appears to be more straight than the Filament B in the equatorial plane.
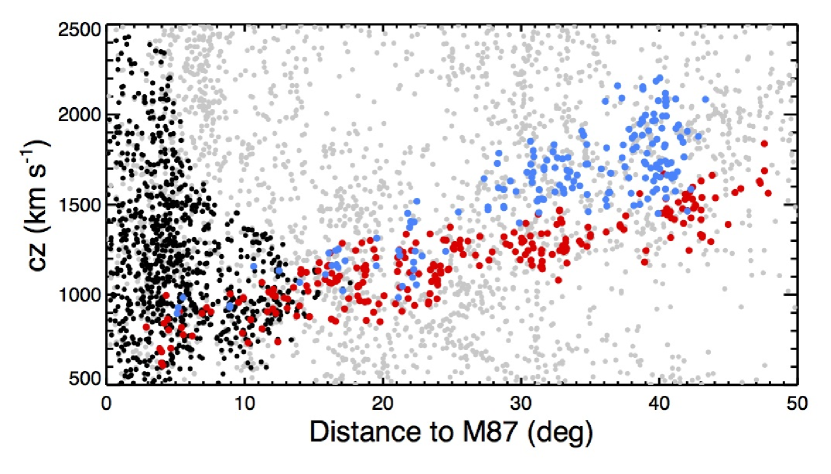
Showing that the mean radial velocities of the galaxies belonging to each filament are similar to the system velocity of the Virgo cluster, Kim et al. (2015) have confirmed that the filament galaxies are in gravitational interaction with the Virgo cluster. Figure 3 plots the redshifts of the galaxies belonging to the Filament A and B as a function of their projected distances in unit of degree from the M87 (i.e., the Virgo center) as filled blue and red dots, respectively. As can be seen, the redshift variation of the filament galaxies at the constant are less than km/s.
Denoting the equatorial positions (i.e., R.A. and decl.) of a filament galaxy and the Virgo center as and , respectively, we determine the projected distance between each filament galaxy from the Virgo center in the plane of sky (see Figure 1) as where , , , and and are the redshifts of the filament galaxy and the Virgo center, respectively. The line-of-sight velocity magnitude of each filament galaxy at a projected distance, , from the Virgo center is approximated as .
Equation (3) is valid only for those filament galaxies whose separation distances from the cluster center are larger than three times the virial radius of the Virgo cluster according to Falco et al. (2014). Taking the typical cluster size Mpc as a conservative upper limit on the virial radius of the Virgo cluster, we select only those filament galaxies which satisfy the condition of Mpc. A total of and galaxies are selected in the Filament A and B, respectively, to each of which the method of Falco et al. (2014) is applied as follows.
Setting the power-law index at the universal value of , we compare the observed values of of the filament galaxies with Equation (3). Assuming a flat prior, we search for the best-fit values of and which maximize the following posterior density function :
| (4) |
where is the number of the selected filament galaxies, is the projected distance of the -th filament galaxy, represents errors involved in the measurement of from the redshift space. Given that include all systematic errors that must be existent but unknown, we set at unity for all of the selected filament galaxies. Here, the posterior probability density function is normalized to satisfy the condition of .
The and confidence level contours of and obtained from the above fitting procedure for the case of the Filament A (B) are shown as solid, dashed and dot-dashed lines, respectively, in the left (right) panel of Figure 4, which reveals the existence of a strong degeneracy between and . To break this degeneracy, we would like to put some prior on the range of by making the zeroth-order approximation to the three dimensional positions of the filament galaxies relative to the Virgo cluster.
In the zero-th order approximation of under the assumption of no peculiar velocity, the three dimensional separation vector of each selected filament galaxy, , can be expressed as . The zeroth-order approximation to the angle, , between and the line of sight direction to the Virgo cluster, say , is now calculated as, with where the ensemble average is taken over the selected filament galaxies.
The Filament A and B yield and , respectively. It is interesting to note that this result is in line with the previous observational evidences for the alignment tendency between the major axis of the Virgo cluster and the line-of-sight direction (Mei et al., 2007). It is also consistent with the recent detection that the Virgo satellites tend to fall into the Virgo along the lie of sight directions aligned with the minor principal axis of the local velocity shear field (Lee et al., 2014). Taking these zero-th order values as a prior, we break the degeneracy between and shown in Figure 4 and finally determine the dynamical mass of the Virgo cluster: for the case of the Filament A and for the case of the Filament B.
3.2 Radial Motions of the Filament Galaxies around the Virgo Cluster
It should be worth comparing our result with the previous measurements of the Virgo mass based on various methods. For instance, Urban et al. (2011) converted the X-ray temperature of the hot gas in the Virgo cluster to its mass via the mass-temperature scaling relation obtained by Arnaud et al. (2005) and found . Here represents the mass enclosed by a spherical radius at which the mass density becomes where . Karachentsev et al. (2014) studied the infall motions of seven nearby galaxies located along the line-of-sight direction to the Virgo cluster whose distances were measured by means of the Tip of the Red Giant Branch (TRGB) method (Baade, 1944; Salaris & Cassisi, 1997) and found . It was also claimed that the lensing mass of the Virgo cluster should be in the range of by employing the technique developed by Kubo et al. (2009) to estimate the lensing mass of the galaxy clusters in the local universe (D. Nelson 2014, private communication222see also the presentation given in https://www.cfa.harvard.edu/ dnelson/doc/dnelson.fermilab.talk.pdf. ).
Noting that the definition of is different from that of the virial mass considered here, we convert the values of reported in the previous works into for a fair comparison under the assumption that the mass density profile of the Virgo cluster is well approximated by the NFW formula (Navarro et al., 1997) and list them in Table 1. As can be read, our best-fit value obtained from the Filament A is consistent with the previous dynamic mass estimated by the TRGB-distance method but substantially higher than the other two estimates. Meanwhile, for the case of the Filament B, the best-fit is significantly off not only from the previous estimates but from the best-fit value obtained for the case of the Filament A. Given that the method of Falco et al. (2014) is strictly valid only for the galaxies distributed along thin straight filament, we suspect that the bent shape of the Filament B should be responsible for the significant discrepancy on between the two filaments and suggest that the Filament B should not be eligible for the application of the method of Falco et al. (2014).
Before excluding the Filament B from our analysis, it may be worth investigating how different the reconstructed velocity profile of the Virgo cluster is from the expected profile, i.e., the universal formula given by Falco et al. (2014) when the mass of the Virgo cluster is fixed at some constant value . Treating in Equation (3) as a free parameter, we search for the best-fit values of and that maximize the following posterior distribution:
| (5) | |||||
Here, instead of setting at the fixed value , we assume a Gaussian prior on , setting its mean and standard deviation at and , respectively, both of which are determined in Section 3.1.
Figure 5 shows the and confidence level contours of and obtained from the Filament A as solid, dashed and dot-dashed lines, respectively, for the four different cases of the dynamical mass of the Virgo cluster: . As can be seen, for the cases of that is consistent with the previous estimate of the lensing mass (see Table 1), the original value of is located beyond the confidence level contours. For the case of that is consistent with the dynamical mass estimate obtained by the TRGB method, is included within the confidence level contour. Hence, one can conclude that the numerical formula of the radial velocity profile suggested by Falco et al. (2014) matches fairly well with the reconstructed profile from observation for the case of the Filament A around the Virgo cluster, yielding the best-fit value of consistent with the previous dynamical mass measurement for the Virgo. Figure 6 plots the same as Figure 5 but from the Filament B. As can be seen, for all of the four cases of , the original value of stays outside the contours, indicating that Equation (3) fails to describe the radial motions of the galaxies in the Filament B.
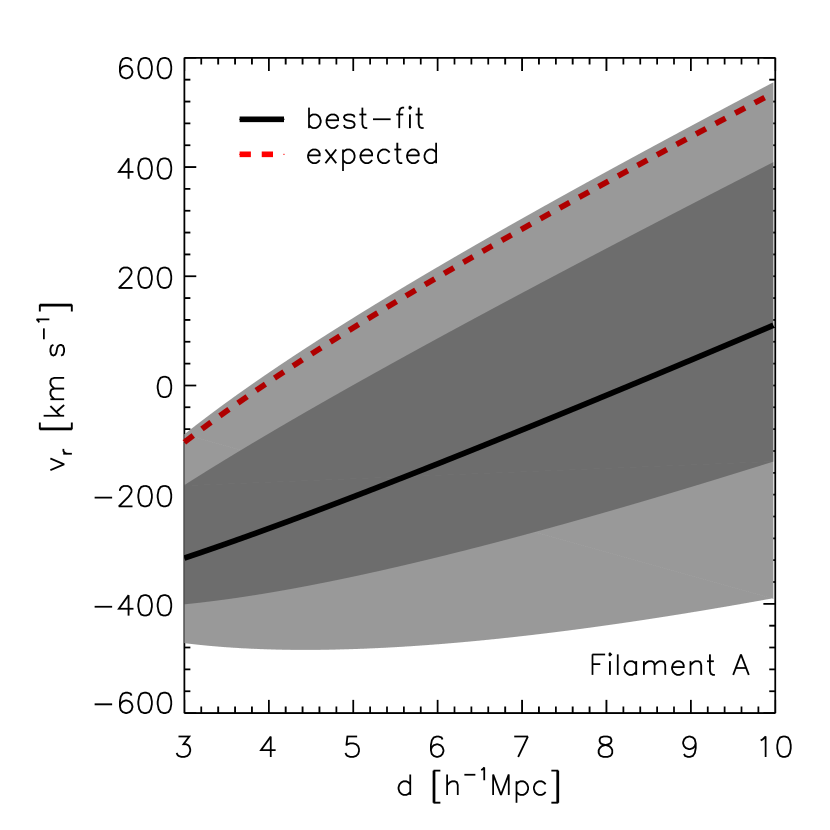
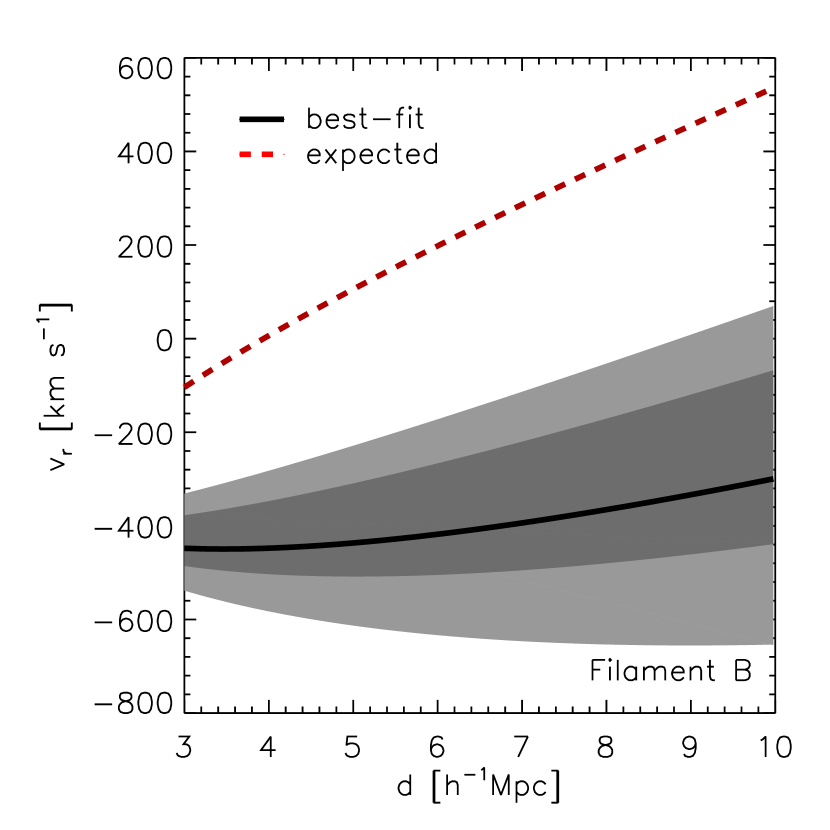
We also show the radial velocity profile, , reconstructed from the Filament A as black solid line in Figure 7. To plot , the Virgo mass is set at (close to the lensing mass), the slope and the angle are set at the best-fit values determined by the above fitting procedure. The associated and uncertainties around the reconstructed profile are also shown as dark and light grey regions, respectively, and the red dashed line represents the expected profile with the fixed value of claimed by Falco et al. (2014). As can be seen, the expected profile is only marginally consistent with the reconstructed one if . Figure 8 plots the same but for the case of the Filament B. It is clear that the difference between the numerical profile and the reconstructed one becomes much larger for the case of the Filament B.
4 DISCUSSION AND CONCLUSION
We have measured the dynamic mass of the Virgo cluster, , by applying the method of Falco et al. (2014) to two narrow filaments (the Filament A and B) consisting mainly of dwarf galaxies located to the east and to the west of the Virgo cluster in the equatorial reference frame, which were recently identified by Kim et al. (2015) from the NASA-Sloan-Atlas catalog. The method of Falco et al. (2014) that can be applied even to the unrelaxed clusters like the Virgo is based on the numerical findings that the radial velocity profile of the galaxies at distances larger than three times the virial radius of a neighbor cluster has a universal shape and that it can be readily reconstructed from direct observables as far as the galaxies are distributed along a filamentary structure.
To break a strong degeneracy found between the value of and the angle , we have constrained the ranges of by making a zero-th order approximation in which the redshift-space positions of the filament galaxies are assumed to equal their real-space ones. Our estimates based on the method of Falco et al. (2014) has yielded and from the Filament A and B, respectively.
Given that the Filament B appears not so straight as the Filament A in the equatorial plane, the substantial difference between the two results on the value of from the Filament A and B has been suspected as an indication that the Filament B is not eligible for the algorithm of Falco et al. (2014) whose success depends sensitively on the degree of the filament straightness. The method of Falco et al. (2014) itself also suffers from a couple of unjustified assumptions. First of all, it assumes the filaments to be extremely narrow and straight, which is an obvious over-simplication of the true shapes of the filaments. Second of all, in their original study, the universal radial velocity profile was obtained by taking an average over all the particles and halos around the clusters but not only over the filament halos. If only a subsample composed of the filament galaxies is used to reconstruct the radial velocity, then it would not necessarily agree with the average universal profile. Besides, the zero-th order approximation that we have made for in our estimation of the Virgo mass with the method of Falco et al. (2014) is an additional simplification of the reality. If a broader range of were considered, then the mismatches between the two masses would be likely reduced.
Our estimate of from the Filament A has turned out to be consistent with the previous dynamical mass estimates based on the TRGB-distance method by Karachentsev et al. (2014) but three to four times higher than the other mass estimates based on the weak gravitational lensing effect (D. Nelson 2014 in private communication) and the X-ray temperature of hot gas (Urban et al., 2011). The usual suspect for this disagreement between the mass estimates for the Virgo cluster is the contamination of the measurements due to the presence of systematics associated with such over-simplified assumptions as the spherical NFW density profile (Navarro et al., 1997) in the lensing mass estimates, the hydrostatic equilibrium condition for the X-ray temperature measurement, and etc.
Another more speculative explanation for the difference between the lensing and the dynamic mass measurements for the Virgo cluster is the failure of GR. We have shown that if the dynamic mass of the Virgo cluster is assumed to be identical to the lensing mass, then the reconstructed radial velocity profile from observational data appears to less rapidly decrease with the distance than the universal radial profile from the simulation for the GR+CDM cosmology. The less rapid decrease of the radial velocity profile with distance indicates higher peculiar velocities of the filament galaxies at large distances than predicted for the case of GR. In fact, several numerical works already explored how much the peculiar velocities of galaxies around massive clusters would be enhanced in the presence of modified gravity (MG) (Lam et al., 2012; Corbett Moran et al., 2014; Gronke et al., 2014b; Zu et al., 2014). Before exploring this speculative idea, however, it will be necessary to study comprehensively how the systematics produced by the over-simplified assumptions mentioned in the above would affect the reconstruction of the radial velocity profile of the filament galaxies in the vicinity of the clusters. Our future work is in this direction.
References
- Arnaud et al. (2005) Arnaud, M., Pointecouteau, E., & Pratt, G. W. 2005, A&A, 441, 893
- Baade (1944) Baade, W. 1944, ApJ, 100, 137
- Bekenstein & Sanders (1994) Bekenstein, J. D., & Sanders, R. H. 1994, ApJ, 429, 480
- Bond et al. (1996) Bond, J. R., Kofman, L., & Pogosyan, D. 1996, Nature, 380, 603
- Bryan & Norman (1998) Bryan, G. L., & Norman, M. L. 1998, ApJ, 495, 80
- Clifton et al. (2012) Clifton, T., Ferreira, P. G., Padilla, A., & Skordis, C. 2012, Phys. Rep., 513, 1
- Corbett Moran et al. (2014) Corbett Moran, C., Teyssier, R., & Li, B. 2014, arXiv:1408.2856
- Dietrich et al. (2012) Dietrich, J. P., Werner, N., Clowe, D., et al. 2012, Nature, 487, 202
- Falck et al. (2014) Falck, B., Koyama, K., Zhao, G.-b., & Li, B. 2014, JCAP, 7, 058
- Falco et al. (2013) Falco, M., Mamon, G. A., Wojtak, R., Hansen, S. H., & Gottlöber, S. 2013, MNRAS, 436, 2639
- Falco et al. (2014) Falco, M., Hansen, S. H., Wojtak, R., et al. 2014, MNRAS, 442, 1887
- Fouqué et al. (2001) Fouqué, P., Solanes, J. M., Sanchis, T., & Balkowski, C. 2001, A&A, 375, 770
- Gavazzi et al. (2010) Gavazzi, G., Fumagalli, M., Cucciati, O., & Boselli, A. 2010, A&A, 517, AA73
- Gronke et al. (2014a) Gronke, M. B., Llinares, C., & Mota, D. F. 2014a, A&A, 562, AA9
- Gronke et al. (2014b) Gronke, M., Llinares, C., Mota, D. F., & Winther, H. A. 2014b, arXiv:1412.0066
- Hellwing et al. (2014) Hellwing, W. A., Barreira, A., Frenk, C. S., Li, B., & Cole, S. 2014, Physical Review Letters, 112, 221102
- Jain et al. (2013) Jain, B., Vikram, V., & Sakstein, J. 2013, ApJ, 779, 39
- Joyce et al. (2014) Joyce, A., Jain, B., Khoury, J., & Trodden, M. 2014, arXiv:1407.0059
- Karachentsev et al. (2014) Karachentsev, I. D., Tully, R. B., Wu, P.-F., Shaya, E. J., & Dolphin, A. E. 2014, ApJ, 782, 4
- Khoury & Weltman (2004) Khoury, J., & Weltman, A. 2004, Physical Review Letters, 93, 171104
- Kim et al. (2014) Kim, S., Rey, S.-C., Jerjen, H., et al. 2014, ApJS, 215, 22
- Kim et al. (2015) Kim, S., Rey, S.-C., et al. 2015, in preparation
- Kubo et al. (2009) Kubo, J. M., Annis, J., Hardin, F. M., et al. 2009, ApJ, 702, L110
- Lam et al. (2012) Lam, T. Y., Nishimichi, T., Schmidt, F., & Takada, M. 2012, Physical Review Letters, 109, 051301
- Lee et al. (2014) Lee, J., Rey, S. C., & Kim, S. 2014, ApJ, 791, 15
- Lombriser et al. (2012) Lombriser, L., Schmidt, F., Baldauf, T., et al. 2012, Phys. Rev. D, 85, 102001
- Mei et al. (2007) Mei, S., Blakeslee, J. P., Côté, P., et al. 2007, ApJ, 655, 144
- Navarro et al. (1997) Navarro, J. F., Frenk, C. S., & White, S. D. M. 1997, ApJ, 490, 493
- Planck 2015 results XIV (2015) Planck Collaboration, Ade, P. A. R., Aghanim, N., et al. 2015, arXiv:1502.01590
- Rapetti et al. (2013) Rapetti, D., Blake, C., Allen, S. W., et al. 2013, MNRAS, 432, 973
- Reyes et al. (2010) Reyes, R., Mandelbaum, R., Seljak, U., et al. 2010, Nature, 464, 256
- Salaris & Cassisi (1997) Salaris, M., & Cassisi, S. 1997, MNRAS, 289, 406
- Schmidt et al. (2009) Schmidt, F., Lima, M., Oyaizu, H., & Hu, W. 2009, Phys. Rev. D, 79, 083518
- Schmidt (2010) Schmidt, F. 2010, Phys. Rev. D, 81, 103002
- Terukina et al. (2014) Terukina, A., Lombriser, L., Yamamoto, K., et al. 2014, JCAP, 4, 013
- Urban et al. (2011) Urban, O., Werner, N., Simionescu, A., Allen, S. W., Bohringer, H. 2011, MNRAS, 414, 2101
- Vainshtein (1972) Vainshtein, A. I. 1972, Physics Letters B, 39, 393
- Wojtak et al. (2011) Wojtak, R., Hansen, S. H., & Hjorth, J. 2011, Nature, 477, 567
- Zhao et al. (2011) Zhao, G.-B., Li, B., & Koyama, K. 2011, Physical Review Letters, 107, 071303
- Zhao et al. (2013) Zhao, H., Peacock, J. A., & Li, B. 2013, Phys. Rev. D, 88, 043013
- Zu et al. (2014) Zu, Y., Weinberg, D. H., Jennings, E., Li, B., & Wyman, M. 2014, MNRAS, 445, 1885


| indicator | literature | |
|---|---|---|
| () | ||
| X-ray temperature | Urban et al. (2011) | |
| weak lensing effect | Nelson (2014)aahttps://www.cfa.harvard.edu/ dnelson/doc/dnelson.fermilab.talk.pdf | |
| TRGB distance | Karachentsev et al. (2014) |