NuLat:
A new type of Neutrino Detector for
Sterile Neutrino Search at Nuclear Reactors
and
Nuclear Nonproliferation Applications
Abstract
We describe a new detector, called NuLat, to study electron anti-neutrinos a few meters from a nuclear reactor, and search for anomalous neutrino oscillations. Such oscillations could be caused by sterile neutrinos, and might explain the “Reactor Antineutrino Anomaly”. NuLat, is made possible by a natural synergy between the miniTimeCube and mini-LENS programs described in this paper. It features a “Raghavan Optical Lattice” (ROL) consisting of 3375 boron or 6Li loaded plastic scintillator cubical cells 6.3 cm (2.500”) on a side. Cell boundaries have a 0.127 mm (0.005”) air gap, resulting in total internal reflection guiding most of the light down the 3 cardinal directions. The ROL detector technology for NuLat gives excellent spatial and energy resolution and allows for in-depth event topology studies. These features allow us to discern inverse beta decay (IBD) signals and the putative oscillation pattern, even in the presence of other backgrounds. We discuss here test venues, efficiency, sensitivity and project status.
C. Lane1, S.M. Usman2, J. Blackmon3, C. Rasco3, H.P. Mumm4, D. Markoff5, G.R. Jocher6, R. Dorrill7, M. Duvall7, J.G. Learned7, V. Li7, J. Maricic7, S. Matsuno7, R. Milincic7, S. Negrashov7, M. Sakai7, M. Rosen7, G. Varner7, P. Huber8, M.L. Pitt8, S.D. Rountree8, R.B. Vogelaar8, T. Wright8, Z. Yokley8
1Drexel University, Department of Physics, 3141 Chestnut St, Philadelphia PA 19104
2Johns Hopkins University, Baltimore, MD, 21218
3Louisiana State University, Baton Rouge, LA 70803
4National Institute of Standards and Technology, Gaithersburg, MD 20850
5North Carolina Central University, 1801 Fayetteville Street, Durham, NC 27707
6Ultralytics LLC, 2200 Wilson Blvd, Arlington, VA 22201
7University of Hawaii, 2505 Correa Rd, Honolulu, HI, 96822
8Center for Neutrino Physics, Virginia Tech, Blacksburg, VA 24061
1 Introduction to NuLat
Sterile neutrinos (whose existence is hinted by several experiments), if found, would inescapably play a revolutionary role in our understanding of particle physics. The now established fact of neutrino masses, highlights the incomplete theoretical understanding of the origin of neutrino mass. Most models, of which there are many, invoke a heavy (and sterile at ordinary energies) neutrino state for the missing right-handed neutrinos, which in any case do not participate significantly in weak interactions at energies as yet probed (less than a few hundred GeV). Definitive discovery of a sterile neutrino would point to the scale of physics responsible for neutrino mass, provide clues to the actual mechanism, potentially open a gateway to the dark sector, and be the first particle found outside the Standard Model. Sterile neutrinos are well motivated over a wide range of parameter space, but there has been particular emphasis recently on sterile neutrinos in the 1 eV mass range due to a variety of experimental hints [38].
This White Paper describes a unique project primarily designed to search for evidence of sterile neutrinos, but which possesses excellent potential for nuclear safeguard and other applications. The detector, called NuLat (short for Neutrino Lattice), is made possible by a natural synergy between the mini-LENS and miniTimeCube programs. The goal of the mini-LENS (Low-Energy Solar Neutrino Spectroscopy) program has been to develop the “Raghavan Optical Lattice” (ROL) technology aimed primarily at low-energy solar-neutrino detection. Excellent spatial and energy resolution of this technology combined with the custom, fast, digitizing electronics of miniTimeCube will allow a timely short-baseline reactor experiment sensitive to 1 eV sterile neutrinos to be performed. ROL technology will enable accurate measurement of the positron’s energy in inverse beta decay (IBD) events while cleanly rejecting backgrounds via spatial and temporal coincidence of the IBD neutron tagging. Described below are details of the miniTimeCube and LENS programs and their merger.
The miniTimeCube (mTC) group has constructed a two-liter neutrino detector to demonstrate the power of using fine pixels and fast timing to reconstruct detailed event topology in the IBD interaction coming from reactor antineutrinos, even in a scintillation medium (previously believed to be useful for calorimetric measurement only, due to isotropy of emitted scintillation light). The next step in the TimeCube evolution has been projected to be a scale-up from the two-liter detector to a one-ton detector. With the evolution to a m3 scale and near surface location, (necessitated by reactor locations), it was realized that a dominant problem in scaling up from two liters was going to be background rejection, a major challenge of any low-energy surface neutrino detector, especially in the close vicinity of a nuclear reactor.
After extensive discussions and joint studies between the mTC collaboration and LENS collaboration, the detector geometry concept of the LENS collaboration has been adopted, as discussed below. The highly segmented LENS geometry, by which individual cells in a cubical lattice are viewed from six sides, permits three dimensional, digital location of energy deposition within the detector. The unique 3D segmentation of LENS provides superior background rejection and excellent resolution of the neutrino interaction observed in NuLat simulations. As such, NuLat is exceptionally well suited to precisely measure reactor antineutrino flux within a few meters from the reactor core, and perform a decisive test of small mixing angle oscillations (at a few percent level) of electron antineutrinos to a new sterile neutrino species (proposed 4th neutrino generation). Such a breakthrough measurement has generated a worldwide interest with several experimental pursuits in parallel, to verify or falsify this hypothesis, with high stakes for being first with a clean measurement.
Beyond the search for new physics, NuLat has potential for multiple applications, ranging from technology demonstration for reactor monitoring purposes, precision (to a few percent) measurement of the antineutrino flux, national security applications, study of an apparent problem with the neutrino spectrum in the range of MeV, and training of young physicists.
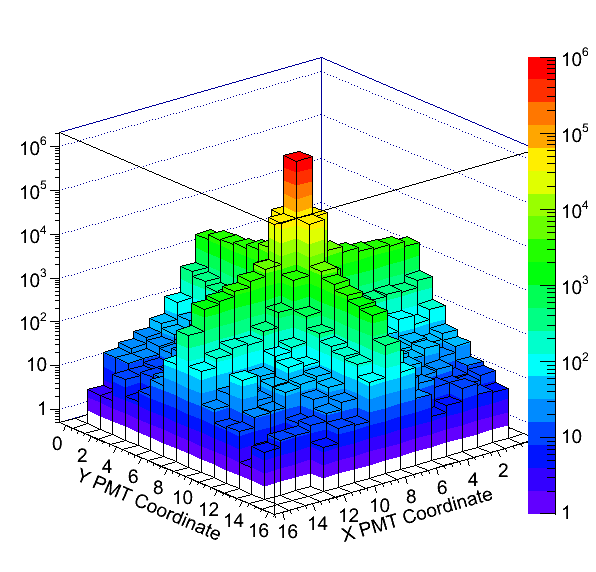
First, background information on sterile neutrinos is reviewed, followed by short baseline reactor physics and the Reactor Antineutrino Anomaly (RAA), reactor flux measurements and predictions, anti-proliferation applications, directional sensitivity, and neutron detection applications. Then, in Section 6.1, general and detailed technical discussion of the new and unique ROL design is presented. The design principles are clearly illustrated in the simulation of light channeling in a ROL detector is shown in figure 2. A simulated light output on one face of the NuLat detector and distribution of light per cell, due to 10 MeV deposition in the central cell is shown in figure 2. Similar output is expected on all six sides of the detector. The central cell along the axis from the event, has a much larger signal than adjacent cells even on a log scale, contributing to the powerful vertex reconstruction and energy localization, while effectively eliminating background gammas as discussed in detail later in the text.

2 Sterile neutrinos – physics motivation and existing experimental evidence
A sterile neutrino is a neutral lepton with no ordinary interactions (except gravity) other than those induced by mixing. They are present in most extensions of the Standard Model and in principle can have any mass. For example, sterile neutrinos are a natural ingredient of the most popular and appealing mechanism to generate neutrino masses, the Type I seesaw mechanism [1][2]. They have also been shown to play an important role in leptogenesis [3][4], and keV-scale sterile neutrinos could provide a warm dark matter candidate [5]. The focus of this review is a relatively light sterile neutrino that mixes significantly with ordinary neutrinos. There have been a number of recent experimental results that appear anomalous in the context of the standard 3-neutrino framework, but which can be explained by a sterile neutrino with a mass around 1 eV (summarized in a white paper[7] that provides a comprehensive summary of this topic). The mentioned whitepaper[7], along with the recent report of the Particle Physics Project Prioritization Panel (P5) [8] recommends construction of a short baseline neutrino oscillation experiment to clearly and unambiguously confront the hints of a 1 eV sterile neutrino.
Inclusion of a new, sterile neutrino , requires minimal 3+1 neutrino mixing model in which the sterile neutrino is acting as a perturbation on the standard three flavor mixing. In this picture, the active neutrino flavors , and are predominantly composed of three light massive neutrinos , and with masses , and . The sterile neutrino would mostly be composed of a heavy neutrino with mass , so that , implying that which is of order 1 eV2.
In the 3+1 neutrino mixing model, the survival probability in the very short baseline neutrino oscillation experiment is given by:
| (1) |
where .
There are pieces of experimental and observational evidence that either favor and disfavor a 1 eV sterile neutrino that mixes with the three active, light neutrinos. While a briefly review is presented here, a more complete review can be found in [7].
2.1 LSND and MiniBooNE
The first, and individually still most significant, experimental evidence in favor of a light sterile neutrino is the result of the LSND experiment at Los Alamos [16], where electron antineutrinos were observed in a pure muon-antineutrino beam. The most straightforward interpretation of the LSND result is antineutrino oscillation with mass squared difference . That value is incompatible with the mass squared differences implied by solar and atmospheric neutrino oscillations, so a fourth neutrino is needed to account for this result. Results on the invisible decay width of the Z boson from the CERN LEP collider imply that a light fourth neutrino would have to be sterile (i.e. it cannot couple to Z boson) if it exists. Support for the LSND result comes from the MiniBooNE experiment at Fermilab which has reported a 2.8 excess of events in the antineutrino mode [17] that is consistent with neutrino oscillations and the LSND antineutrino appearance signal. MiniBooNE also observes a 3.4 excess of events in the neutrino mode data at low energy [17]. On the other hand, the KARMEN experiment [18] saw no evidence of the disappearance of electron neutrinos, although probing a similar phase space as LSND. Other constraints disfavoring the sterile neutrino come from the non-observation of muon-neutrino disappearance by accelerator experiments like CDHSW [19] and MINOS [20]. Finally, two more recent accelerator neutrino experiments OPERA [21] and ICARUS [22] reported negative results in a search for electron neutrinos in a muon-neutrino beam from CNGS. However, these experiments did not test all regions of the relevant parameter space.
2.2 Reactor antineutrino anomaly (RAA)
For nearly three decades the expected nuclear reactor antineutrino flux has been calculated using a phenomenological model by conversion of the spectra from the thirty effective beta branches. The method relies on the measurement of the spectrum of fission induced electrons accompanying the antineutrino performed at ILL [30] [31] [32] [33].
A new calculation of the reactor antineutrino flux was conducted in 2011 [34] in preparation of the high precision search in the Double Chooz experiment. The new method relied on the detailed knowledge of the decays of thousands of fission products. Inherent uncertainties in this model came from the various transitions that are not experimentally constrained.
In addition to reducing the overall uncertainty of the expected antineutrino flux, the new calculation revealed a small overall increase in the expected flux at the level of 3.5%. When combined with small deficits in the detected antineutrino flux observed in near reactor experiments (between 15 m and 1.5 km), the deficit between observed and expected reactor antineutrino rate increases to 5.7% with the mean value of:
| (2) |
This amounts to a nearly 3 effect and the effect was named the Reactor Antineutrino Anomaly (RAA) by G. Mention et al. [25].
If the RAA is due to neutrino mixing, it would require additional neutrino species with eV2 with the mixing amplitude . The existence of this new massive sterile neutrino would enable oscillations of electron antineutrinos into sterile neutrinos at distances less than m from the reactor core accompanied by the flat suppression of the electron antineutrino rate and spectrum observed at distances above 15 m indicated by the RAA.
The RAA represents an independent hint of the existence of the new massive neutrino species potentially discernable at above 15 m baselines.
2.3 SAGE and GALLEX source calibrations
Calibrations with radioactive sources of 51Cr and 37Ar, which both decay via electron capture and emit mono-energetic electron neutrinos, were performed for the radio-chemical solar neutrino experiments based on gallium (SAGE[23], and GALLEX[24]). In both cases, a deficit of electron neutrinos of 25% was observed [25] at distances of a few meters. This result can be explained by a 1 eV sterile neutrino, which would allow some of the electron neutrinos from the source to “disappear” before they can interact. The effect depends on nuclear matrix elements, but recent measurements of the relevant Gamow-Teller transitions strengths [9] seem to support the gallium anomaly.
2.4 Cosmological evidence
Cosmological data, mainly from observations of the cosmic microwave background and large-scale structure, are sensitive to the possible existence of a light sterile neutrino. Cosmology is sensitive to the effective number of neutrino families Neff primarily because energy density in relativistic particles affects directly the universe’s expansion rate during the radiation dominated era. This results in sensitivity to light sterile neutrinos in cosmological observables such as the light elemental abundances from big-bang nucleosynthesis (BBN), the cosmic microwave background (CMB) anisotropies, and the large-scale structure (LSS) distribution. Until very recently, a combination of these observables tended to favor a scenario with a fourth sterile neutrino. However, recent Planck data [26] seems to rule out the possibility of a fully thermalized light neutrino spectrum, finding at the 95% confidence level. WMAP also published their limits based on the 7 years of data [10] and results vary depending on data sets included ( or + selected galaxy cluster abundances (SPTCL)): and . These results do not completely rule out the existence of a light sterile neutrino, because there are scenarios where sterile neutrinos would not have thermal energy spectra and number densities [27].
In summary, there are experimental results that appear anomalous (at the level) in the context of the standard three-neutrino framework which can be explained by a sterile neutrino with a mass around 1 eV. On the other hand, there are a number of results that are in conflict with this interpretation, also at the level. It should also be noted that the experimental evidence in favor of a light sterile neutrino is from effects that are purely in count rates. To clearly resolve this situation, new experiments are needed, particularly ones at short baselines that can observe the energy spectrum distortion implied by a light sterile neutrino in addition to the overall rate deficit. The most promising venues are experiments close to nuclear reactor cores, with very strong radioactive sources (144Ce – 144Pr and 51Cr) or at accelerators. The prospects of different experiments are discussed in detail in [36]. Experiments very close to nuclear reactors and with intense radioactive sources are likely to be the first to provide data in favor/against the existence of sterile neutrinos.
3 Short baseline reactor neutrino physics
3.1 Overview
Nuclear reactors are copious electron antineutrino sources in the range below 10 MeV. A 1 GWth nuclear plant produces about from the beta decays of the reactor fission products originating mostly from 235U, 238U, 239Pu and 241Pu. The knowledge of reactor core composition and burn-up level allows calculation of the neutrino spectrum and rate as a function of time. Since the spectrum and flux of reactor neutrinos are fairly well known, they are well suited for the study of the fundamental neutrino properties and neutrino oscillations in particular. In reactor neutrino experiments, the detected antineutrino rate and spectrum are compared with the expected spectrum and rate based on the reactor burn-up level. Detected rate deficit and spectrum shape distortion indicate disappearance of electron antineutrinos, interpreted as antineutrino oscillations.
Reactor neutrino experiments with very short baseline ( m) can test the 1 eV sterile neutrino hypothesis, as no other neutrino flavor oscillation can take place at such a short baseline. Several such experiments are coming on line in the current and following years. The complete list (to the best of our knowledge) is given in the Table 1.
| Project | Ref. | Dopant | Highly | Moving | Pth | L(m) | Mtarget |
| Segmen. | detector | (MW | (tons) | ||||
| Nucifer/FRA | [37] | Gd | 70 | 7 | 0.75 | ||
| Poseidon/RU | [39] | Gd | 100 | 1.5 | |||
| Stereo/FRA | [38] | Gd | X | 50 | 1.75 | ||
| Neutrino 4/RU | [40] | Gd | X | 100 | 2.2 | ||
| Hanaro/KO | [43] | Gd, 6Li | 2D | X | 30 | 6 | 0.5 |
| DANSS/RU | [41] | Gd | 2D | X | 3000 | 0.9 | |
| PROSPECT/USA | [44] | Gd, 6Li | 2D | 4 & 18 | 1 & 10 | ||
| SoLid/UK | [42] | 6Li | 2D | 3 | |||
| NuLat/USA | here | 10B, 6Li | 3D | X | 1500 | 1.0 |
All detectors listed in Table 1 detect reactor antineutrinos via the IBD reaction with an energy threshold of 1.8 MeV. IBD has a very prominent detection signature: prompt stopping and annihilation of the positron with an electron in the proton rich target medium, followed by a delayed event in which the thermalized neutron is captured on a nucleus with high neutron-capture cross-section that produces a unique taggable signature. Depending on the nucleus and level of loading in the target, the delayed event takes place on average from a couple of microseconds to a couple hundred microseconds later and has a well defined energy associated with: 1) the deexcitation gammas emitted in the neutron capture on gadolinium or hydrogen, 2) the generation/emission of 7Li nucleus, alpha, and gamma from neutron capture on 10B, or 3) alpha and triton generation from neutron capture on 6Li. The prompt-delayed events are correlated both spatially and temporally and can be readily identified.
A key issue for all of these experiments is the ability to discriminate IBD signals from cosmogenic and reactor induced backgrounds. While IBD correlated signal possesses a very strong discriminatory power, high rates of energetic gammas and neutrons can mimic the IBD random coincidence. The reactor core can generate correlated neutron and high-energy gamma backgrounds as well.
Very short baseline experiments have to operate in whatever space is available near the reactor core to preserve the needed short baseline, resulting in very small to non-existent overburden protection from any cosmic-ray induced backgrounds and very limited shielding from the reactor core. The backgrounds must be measured in advance and the detector protected with adequate shielding. As explained previously, the NuLat highly segmented detector design gives excellent spatial and energy resolution allowing in-depth topology studies to discern IBD events in the face of these backgrounds. Liquid-free (1% boron or lithium loaded plastic scintillator) compact design allows it to be placed uniquely close to extremely compact and powerful naval reactors (Table 1).
All of the planned experiments have baselines m to allow for detection of distortions in the antineutrino energy spectrum expected for a 1 eV sterile neutrino. To observe this distortion, compact reactor cores whose dimensions are m (such as a naval reactor) are preferred to large commercial reactors due to smearing of the electron antineutrino source that washes out the oscillation pattern in the data.
The impact of short baseline reactor experiments depends on the reactor core’s size and compactness, background levels, baseline, and detector design optimization. An illustrative plot demonstrating the interplay of statistics, energy resolutions, and baseline is given in figure 3 [46].

3.2 Detailed reactor neutrino flux measurement
Precision measurements of reactor neutrino fluxes continue to be of interest due to a peculiar and unexpected feature observed by the most recent set of reactor neutrino experiments (RENO[35], Double Chooz[13] and Daya Bay[11]). All three experiments observed an anomalous, wide peak at 5 MeV corresponding to an excess in the number of observed events compared to expectation. The RENO collaboration reported 3.6 , [35] significance of the excess. Double Chooz and Daya Bay experiments observed a prominent peak in the same region as well. The 5 MeV anomalous peak is not understood as of yet, and it may be due to an unaccounted for part of the reactor flux, but could also be due to a background or new physics. This 5 MeV peak is indicative of the power of precision neutrino experiment to uncover new phenomena. Resolution of the 5 MeV anomalous peak requires measurement at a shorter baseline, with a different reactor core composition and with high energy resolution. With its lattice configuration, close to a predominantly 235U reactor core, NuLat has excellent prospects for understanding this recently revealed puzzle.
4 Short baseline nonproliferation/national security with NuLat
Reactor electron anti-neutrino detection is a promising technique for nuclear
non-proliferation control. An abundant electron anti-neutrino flux is produced by all nuclear reactors and cannot be shielded or falsified. Therefore, monitoring the neutrino flux from a given reactor can verify the operational state of the reactor. For example, anti-neutrino monitoring can reveal if the fuel is changed frequently to enhance Pu production, provide estimate of the power output, and even determine U/Pu fuel mix (with sufficient statistics).
Monitoring reactors via their neutrino emissions has a long history starting from Reines and Cowan’s first detection of neutrinos in the 1950’s, followed by a dramatic progress in later decades in Russia. More recently, the SONGS group deployed a series of detectors at the San Onofre power reactor in Southern California [52]. Within the last decade, a small worldwide community has emerged, with the common goal of making detectors, which can easily be deployed near (cooperating) reactors, and contribute information to the International Atomic Energy Agency (IAEA) to assist in their treaty obligations to monitor reactors and reactor materials in treaty signatory states around the world. A detector for neutrino monitoring allows taking operations data from the reactor without any interference or risk to the reactor operations. As such, it has a potential to greatly benefit the anti-proliferation goals of the IAEA. Moderate range neutrino monitoring programs have been going ahead in Russia, France, Italy, Germany, England, Brazil, Japan, Korea, and China, as well as the USA. Their progress is reported annually at a series of meetings called AAP (Applied Antineutrino Physics), and is relatively modest. The detectors report significant backgrounds and require high reactor-off counts to be subtracted. Underground detectors work well, as they are shielded from the cosmic rays and the reactor induced backgrounds (neutrons and gammas). But operating close to the reactor costs doubly. Both reactor and cosmic ray induced backgrounds increase since almost all reactors are at the Earth’s surface resulting in a very significant cosmic-ray background.
Several agencies have taken an interest in reactor monitoring in the USA, aside from science funding agencies, for studying neutrino properties. The Department of Energy NNSA, has funded a series of experiments centered at LLNL. The NGA, because of interest in mapping world reactors, has funded studies of new types of potential reactor monitoring detectors and the miniTimeCube (mTC) in particular. The mTC has pioneered the use of very fine pixelization and fast timing to register neutrino interactions (and backgrounds) with unprecedented accuracy (mm scale) and with fast background rejection, on the fly. The mTC has a fiducial volume of only 1 liter (2 liters total), much smaller than other detectors tried or being tested for close in monitoring. Detector shielding is required at the current mTC commissioning site close to (2.5 m) the NIST 20 MWth to protect against reactor induced background. However, if mTC would be positioned at a large ( GWth) power reactor, it is designed to operate with no shielding while observing 10 neutrino events per day at 20 m distance. This powerful design feature of mTC is mainly made possible by its outstanding positioning accuracy and powerful background rejection, making the tiny mTC detector a competitive choice for unobtrusive reactor monitoring in cooperative situations.
4.1 Mobile detector for the monitoring of reactor power and cycles
The next step in scaling up the mTC is a meter scale detector. Such a detector could operate outside the containment facility for a reactor, sitting in a trailer, enabling mobile detector monitoring of nuclear reactors and their power cycles. Multiplying such a detector by a factor of ten or so, it could still be placed in a shipping container(s) or semi-trailer(s) for mobile operations out to greater distances, at a kilometer scale. Design of a simple, reliable and affordable meter scale detector, requires R&D, for which 3D segmentation of NuLat is a promising way forward.
4.2 Further Future Long Range Monitoring
In 2002, the mTC group began investigating an array of huge neutrino detectors to monitor reactors over large geographical regions since neutrino detection is completely passive and not jam-able. It is noteworthy that the KamLAND experiment in Japan, at 1000 tons, collected, prior to the 2011 earthquake, neutrinos from reactors all around Japan. A series of studies were performed on neutrino registration from hundreds to even a thousand kilometers distance and the project was titled NuDAR ([53]). The reason for this is that the well-understood oscillations characteristically distort the neutrino spectrum from the reactor, permitting determination of reactor range from even one detector location. Measurement of neutrino direction or the use of multiple detectors provides additional information to help determine reactor location. Moreover, the characteristic spectral signature of a reactor at a given distance allows one to deconvolve the signals of multiple reactors, or find a small reactor even in the presence of larger reactors in the neighborhood (refer to [53] for further details on this topic).
5 Neutron detection of Special Nuclear Materials (SNM)
A detector such as NuLat has a dual use: in addition to neutrinos, it has high efficiency for detecting neutrons due to the neutron capture nuclei loading in the scintillator. This feature allows for the detection of Special Nuclear Materials (SNM) due to their neutron radiation despite rather thick intervening material, such as shipping containers. Often, two successive scatters in a detector from an energetic neutron can be used to tag the first two scatters of energetic neutron, consequently extracting the locus of incoming directions. When a neutron in motion is deflected from a straight-line trajectory by scattering from a proton, the angle of the deflection may be calculated given the kinetic energy of the neutron prior to and immediately following the deflection. This simple relationship is expressed by Equation 3.
| (3) |
where is the neutron deflection angle, is the original neutron kinetic energy and the neutron kinetic energy after deflection; being the difference. is directly observable, however is not, and must be inferred via Equation 4:
| (4) |
where the post-scatter kinetic energy is calculated via the non-relativistic neutron velocity following deflection in Equation 5:
| (5) |
The times (, , …) and positions of neutron scattering events (, , …) allow reconstruction of the neutron energy , and direction after its first scatter. When combined with the energy deposition one sets the initial energy and a cone of possible incoming neutron directions. Figure 4 illustrates the described method that leads to determination of the and .

With this approach, one gets a number of such cones, and makes a “sky map” that can be analyzed with Hough Transforms (figure 5) for example. In any event, the surprising fact is that with reasonable resolution one can find sources with useful accuracy, within reasonable times. As an example, our calculations show that a m3 detector would have good ability to detect a passing truck with a kg of Pu on board.

Because of homeland security needs, many groups have come up with plans for neutron detectors, employing various media, densities and geometries. The detector design described in this white paper has some attractive features due to being solid plastic (no need for 3He, not pressurized, nor flammable) and being inherently wide-angle in response and relatively compact. Future versions will potentially be less expensive as well, particularly in the case of commercial production. In addition, due to the modular nature of the NuLat design the configuration can be optimized based on the deployment of the detector. This white paper focuses on the neutrino detection and background rejection for neutrino detection, though one should keep in mind the potential dual use. The present NuLat represents a new class of such detectors and this development for a short-term physics goal, has long-term importance in other areas.
6 NuLat Detector Design: The Raghavan Optical Lattice (ROL)
It is apparent from these arguments that an above-ground mobile cubic-meter scale antineutrino detector would be ideal for fundamental physics research (nuclear non-proliferation control and neutron detection of SNM). These drivers lead to the proposal of a compact, solid, highly-segmented, cellular antineutrino detector using the ROL design developed for the LENS Collaboration’s solar neutrino experiment.
Earlier reactor antineutrino detectors were deployed at distances over 10 m from the core, with the most recent experiments of Daya Bay, Double Chooz and RENO being meters from the reactor cores (measuring the antineutrino mixing angle at km distance). All previous neutrino oscillation measurements were further from the reactor cores than proposed for NuLat: m (and 30 m as explained later), and have been shielded with significant amounts of overburden, being underground at various depths.
A valid IBD produces a positron carrying most of the kinetic energy of the incoming neutrino, and a neutron receives most of the momentum. Thus, measuring the kinetic energy of the positron yields a good measure of the neutrino energy. The positron then rapidly annihilates with an electron at rest, forming two back-to-back 511 keV gamma rays. In very large detectors, such as KamLAND or Borexino, the energy from the two 511 keV gamma rays is integrated with the positron energy and can be simply subtracted from the measured energy. Unfortunately, in smaller detectors (on the ton scale), the gammas often deposit only a fraction of their energy before escaping the detector volume, thus adding large uncertainties to the deduced neutrino energy. (NuLat segmentation avoids this problem by cleanly separating the positron and annihilation radiation.) The subsequent delayed-neutron capture then provides a powerful coincidence signal for background rejection.
There are typically two approaches to addressing the background issues: shielding or discriminating event topology. Within mTC collaboration, the latter approach was tackled using first-light (defining a so-called “Fermat surface”) [56] from interactions in a solid scintillator, allowing millimeter reconstruction of events in a two-liter plastic scintillator detector. This is orders of magnitude better than one would expect from a medium where the characteristic scintillation decay time is many times the transit time of light across the detector. This was made possible by a combination of very highly-segmented photon detectors (256 pixels per side), fast ( 100 ps) electronics, and because the time of the first-light () is the most probable emission time from the exponential decay of scintillation light. Such event topology could in principle allow location and timing of discrete energy deposits within the detector resulting from a neutrino interaction (potentially including) the direction of the neutron recoil). However, based on the 12.5 cm cell results, without impractical numbers of pixels scaling up to a one-meter TimeCube it was found to be impossible to reliably identify and reject the Compton scatters of the departing 511 keV annihilation gammas, and thus uncertainty on the positron energy and vertex location increased significantly.
The mTC collaboration considered a classic tubular array detector geometry, but concluded that the tubular design also suffers the same problem as the open volume version: neutrino energy resolution suffering from escaping annihilation radiation (and inability to practically locate the neutron capture). Moreover, in both of these schemes it was difficult to contend with cosmic-ray muons with little or no overburden (about 100/sec in a cubic meter detector), tails of extensive air showers (EAS), energetic neutrons produced in the shielding and neighborhood which all contribute to the trigger rate. A fast trigger, which recognizes a high total-energy deposition and/or high photodetector multiplicity will eliminate a majority of these events, but may still allow an unacceptable rate leading to significant dead-time.
An example of a demonstrated tubular geometry detector is found in the Japanese PANDA Project [14]. They have operated a modest lattice (6x6) of tube style detectors (36 m from the core) outside a 3.4 GWth power reactor in Japan, where they observed events /day in excess for reactor-on compared to events/day with reactor-off, for a S/N = 1/16. Due to necessary cuts on the data prior to this, the efficiency however was a modest 3.15%, making the net detected signal only 1/507 of neutrino-like triggers. They predict a factor of 3 improvement in efficiency with larger scale (10x10), however. This suffices to make one cautious about the background situation with such experiments. This is of course directly relevant to other detectors operating closer to test reactors as in Table 1, where the 1/distance2 gain is offset by decreased power, and things are made worse by the direct reactor background, from which PANDA is shielded by distance and the reactor containment vessel.
High background trigger rates are generally addressed by detector segmentation: by making the region to be monitored for an event of interest as small as possible and utilizing the rest of the detector as veto volume. In our case, the key is localizing the positron production and measuring the prompt signal energy for the prompt event. Using the nearby cells to register the delayed neutron capture, and constraining its association by time, space and energy separates an IBD event from the background. One can achieve this to a certain extent in the volumetric and tubular detector configurations, but the cellular design accomplishes the goal best, as discussed below.
0 developed by Raghavan’s and Vogelaar’s group at Virginia Tech for a solar neutrino experiment called the Low-Energy Neutrino Spectroscopy (LENS) experiment [55], which presented a much more challenging neutrino signal to background environment.
In the course of studying the LENS design the VT team has built several versions of the lattice, and deployed a prototype (MicroLENS) underground in the Kimballton mine near Blacksburg, VA. The LENS team at VT and collaborators at LSU and elsewhere, have made simulation programs and models, and studied the optics and overall detector response. The details of the ROL detector design as well as the details of previous constructions will be outlined below.
6.1 Design Principles
NuLat will employ a unique detector design, the ROL, as a means to separate the energy deposits of IBD positrons from the deposits of their annihilation gammas and to cleanly tag the delayed neutron to suppress random coincidences with the prompt signal. The ROL detector design uses complete 3-D optical segmentation, instead of typical 2-D segmentation and time-of-flight methods, for precision localization of events in a large volume detector. The segmentation of ROLs creates a detector composed of independent cells. Since the cells in a ROL detector are independent, short ranged events can be localized in a cell, thus the position resolution of a ROL detector is equal to the cell’s size. Furthermore, ROLs allow for the topology of multiple deposits to be analyzed. The optical 3-D segmentation of ROLs is accomplished using low-index of refraction barriers that allow for optical channeling of scintillation light down the primary coordinate axes. Since the lattice is constructed of a low-index of refraction material in a higher index medium, the channeling comes from total internal reflection (TIR) and Fresnel reflections. Figure 2 shows a simulation of this concept in 3-D.
ROL detectors rely on the low-index barrier to channel light via TIR, but the choice of the barrier material depends on balancing several factors: generating a maximum of channeled light, generating a maximum of total light, and minimizing effects for varied propagation paths of the light. Depending on the specific indices of the bulk scintillator and the barrier, light will be: (1) channeled out directly along the primary Cartesian axes of the lattice into the PMTs that view the cell, (2) sprayed out into the three orthogonal planes containing the cell, (3) propagated out of the corners of the cell into other planes, or (4) trapped in the cell until absorbed by the scintillator. From these considerations ROLs are best designed with a minimum of trapped light and a minimum of unchanneled light since increasing the trapped light reduces the total light collected and increasing the unchanneled light makes the analysis of the event topologies more complex. From a geometric analysis a provides 100% light channeling with minimal light trapping, and a provides 0% light trapping with minimal unchanneled light. A second issue to consider is that as the percent difference of the scintillator index of refraction and barrier index of refraction increases, the Fresnel reflection at the scintillator-lattice interface increases. This reflection can become appreciable, on the order of a few percent at each lattice interface, and it grows proportionally to the number of cells in the lattice. These reflections affect the time structure of the pulses with a smaller critical angle giving more pulse time dispersion.
6.2 Previous Constructions
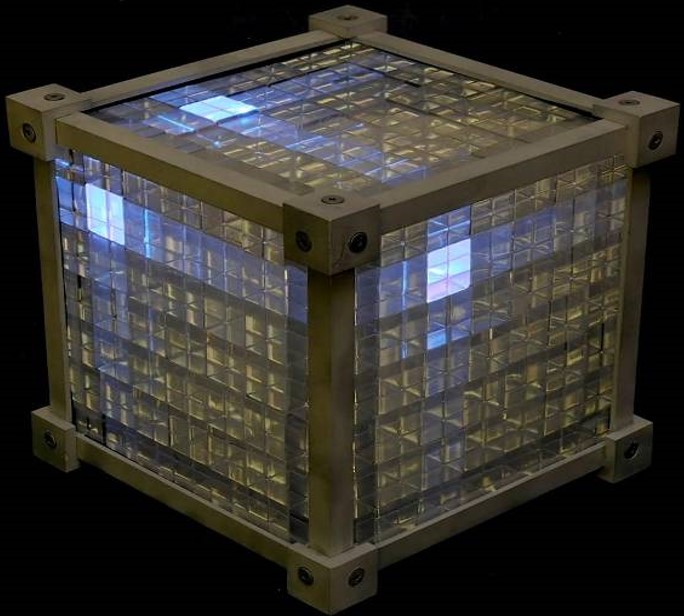
Solid ROL detectors were conceived in the past, but never built past the demonstrator phase due to the higher cost of plastic scintillator for a large (100 ton) LENS scale detector. However, a solid ROL demonstrator was built previously by the VTech group and is shown in figure 6.
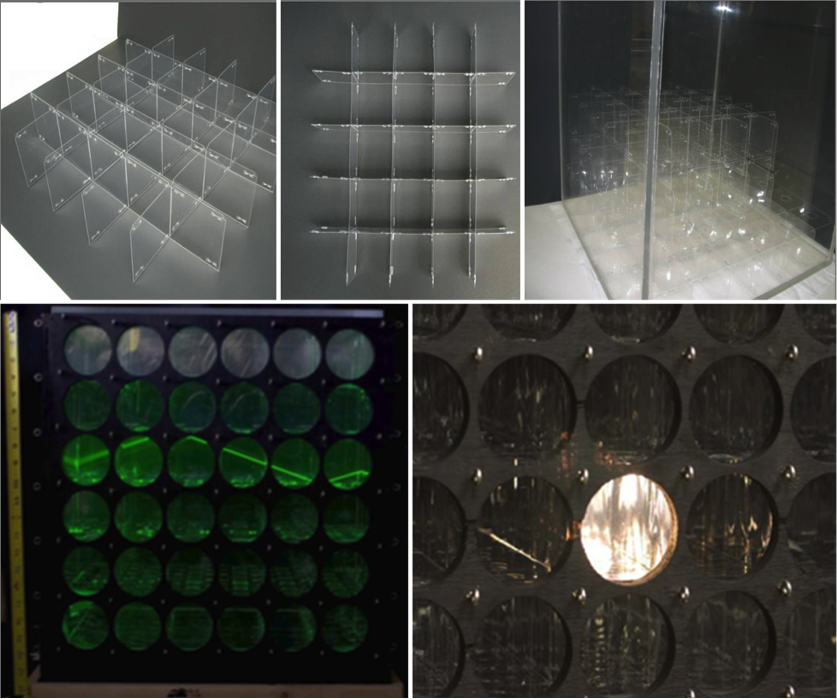
Development continued on designs segmenting liquid scintillator volumes with films or trapped gas gaps. The most successful of these designs were ROLs made from Teflon FEP films (see figure 7). The microLENS detector and various ROL construction techniques for solid and liquid detection media are discussed in greater detail in the appendix.
6.3 ROL Detector Construction for NuLat
Due to the potential deployment of NuLat beside a naval reactor, safety concerns are an important consideration in the design. For this reason, a liquid scintillator based ROL detector would be problematic, but since the size of a reactor-based detector is much smaller, the higher cost of the plastic scintillator is not a large factor in the design. Therefore, a ROL made from a boron-loaded or (even better) a 6Li loaded plastic scintillator will be used. This choice also simplifies the construction, since the plastic scintillator cells are easily machined and polished to be optically flat, and they can be stacked with small reflective spacers to ensure a low-index barrier is maintained without significantly affecting the light transport in the detector.
The nominal design of NuLat is a lattice composed of 151515 cubic array having 3375 cubes of EJ-254 boron-loaded (or as soon as available Eljen 6Li-loaded 111Eljen gives availability estimates as of early 2015.) plastic scintillator 2.5” (6.35 cm) on a side, and spaced 0.01” apart in . The base plastic for these is polyvinyl toluene (PVT), which has an index of refraction of [47]. As described earlier, a gap index between 1.12 and 1.29 would be optimal for a PVT ROL, and NuLat has several options for the gap material that are nearly optimal. These include: air, perfluoroctane (PFO), and water, and their indices are roughly: 1.0, 1.255, and 1.33 respectively. For simplicity in construction the nominal design will use air gaps (39∘ critical angle). Thus NuLat will have the vast majority of the light going to six PMTs that view the cell, with some light trapping and no unchanneled light.
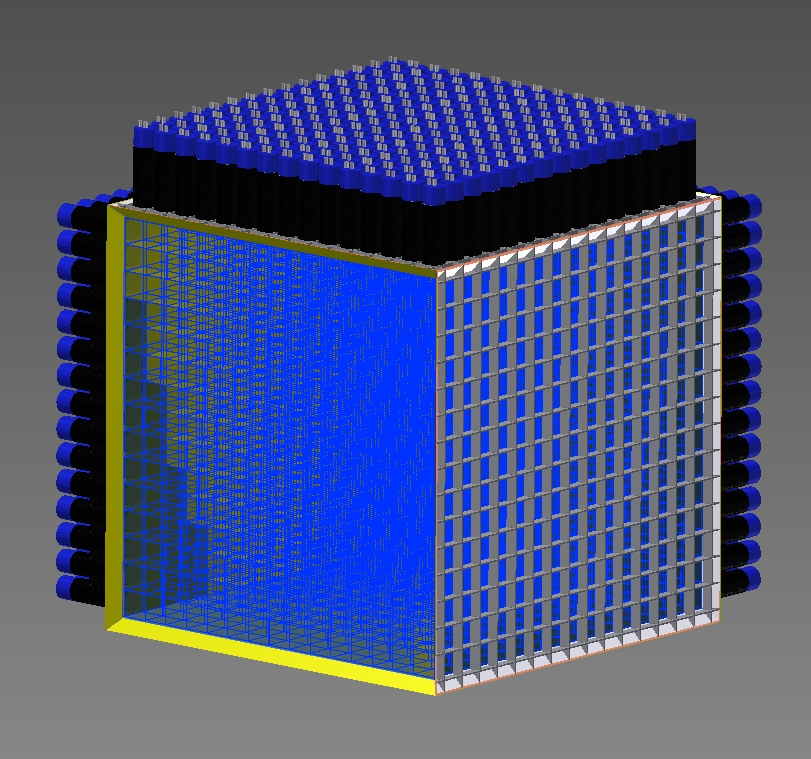
NuLat will be instrumented with 2” photomultiplier tubes (PMTs) connected to a short (1.5” long) square channel to round photo-cathode light guide (LG) that will each view a single lattice channel. The LGs serve as an efficient means to couple the square cross section of the lattice channels to the circular photocathode. More detail on the use of LGs in ROLs can be found in the appendix. The full instrumentation will require a total of 1350 PMTs and LGs. Figure 8 shows a CAD drawing of the NuLat detector with PMTs attached (without LGs) and interior of the cube partially exposed for better visualization.
7 NuLat Detector Simulation and Event Reconstruction
To better understand the unique capabilities of the ROL detector and the NuLat experiment, the detector was simulated using the GEANT4 toolkit [50] and in-house light transport software. The result of these simulations and their impact on the reconstruction of the IBD positron’s energy are discussed below.
7.1 IBD Events in a NuLat Detector: Concepts
For reactor sources of IBD events, the positron will almost always deposit its energy in one cell, occasionally two cells, and very rarely in more than two cells. The annihilation gammas will typically scatter around the detector, and deposit their energy in a few cells around the vertex. This allows for the positron’s kinetic energy to be reconstructed separately from the total energy of the prompt signal (i.e. the vertex cell contains mostly the energy from the positron with little contamination from the annihilation gammas). This is a unique feature of NuLat, and more specifics of positron events in NuLat will be detailed below. The neutron tag topology in the nominal NuLat detector is fairly simple since the IBD neutron will likely capture near the vertex cell, with a mean capture time of a few microseconds. For capture on 10B a small light pulse is seen in the capture cell from the 1.47 MeV alpha and the 0.84 MeV 7Li nucleus; 94% of the time this is accompanied by a 477 keV gamma [48] from the de-excitation of the 7Li nucleus. The gamma will then deposit its energy in other cells as it scatters around the detector. On the other hand, neutron capture on 6Li produces a 2.05 MeV alpha and a 2.73 MeV triton which will produce signal in the capture cell of about 483 keVee making it well localized. Another aspect of the neutron tag is the average capture time between the prompt and delayed event. The capture time depends on the nuclei and level of loading in the scintillator, and this is especially important in the high background environment, where shorter capture times greatly improve background suppression of IBD. Outcome of the initial discussions with Eljen is that they can guarantee 1% 10B loading with capture time of the order of 10 s.
Finally, NuLat plastic test samples will be tested for the ability to discriminate neutron by pulse shape discrimination which has been demonstrated in 6Li doped plastic scintillator by Laurence Livermore National Laboratory (LLNL) group[bib:Z]. Since this feature has not yet been utilized in plastics, NuLat baseline design does not rely on it. If proven successful, it would add additional neutron discriminating power to NuLat.
Other neutron capture nuclei such as Gd have been proposed for very short baseline experiments, and its tag signature is noted here for completeness. Neutron capture on Gd produces about 8 MeV of gammas with a multiplicity of . While the total energy of the tag is well above possible backgrounds, the leakage of the gammas is potentially problematic in a small detector. This reduces the effectiveness of the tag. Regardless of the neutron capture nuclei, the ROL design provides a unique means to detect the neutron tag from IBD events because the capture is constrained to a very limited 5-dimensional phase space (in , , , , & E).
7.2 Simulation of Positron Events in NuLat: Concepts
The current simulations use the minimal NuLat design with three sides of the detector mirrored and the other three side instrumented. The mirroring reduces the number of PMTs, electronic channels, and the space required for the NuLat detector. For the optical properties of the scintillator, the nominal figures in the EJ-254 scintillator’s data sheet [47] are adopted, with an optical attenuation length of 3 m. These numbers reflect our current best estimates for these parameters in NuLat.
7.3 Positron Event Reconstruction
This section will demonstrate the power of NuLat to measure the positron’s energy with high resolution. The event reconstruction algorithm currently implemented uses only the PMT charges and the simulated detector non-uniformity to do a minimization of the energy deposits in each cell of the NuLat detector. To illustrate the algorithm 2 MeV positrons were simulated uniformly throughout the minimal NuLat discussed above.
The event reconstruction algorithm starts with the PMT charges and determines, cell-by-cell, if there was possibly some energy in that cell. Requiring three orthogonal PMTs that view the cell to have light in them achieves this goal. Then using the simulated non-uniformity of the detector, the minimum energy deposit needed to produce the observed signal in the PMTs is logged in the cell. Once all the cells have been checked, the expected PMT charges from these deposits are determined using simulation data. A is calculated from the sum of the squared residuals from the expected PMT charges and the observed charges. This is then minimized in a gradient search in energy over the cells that have energy deposits.
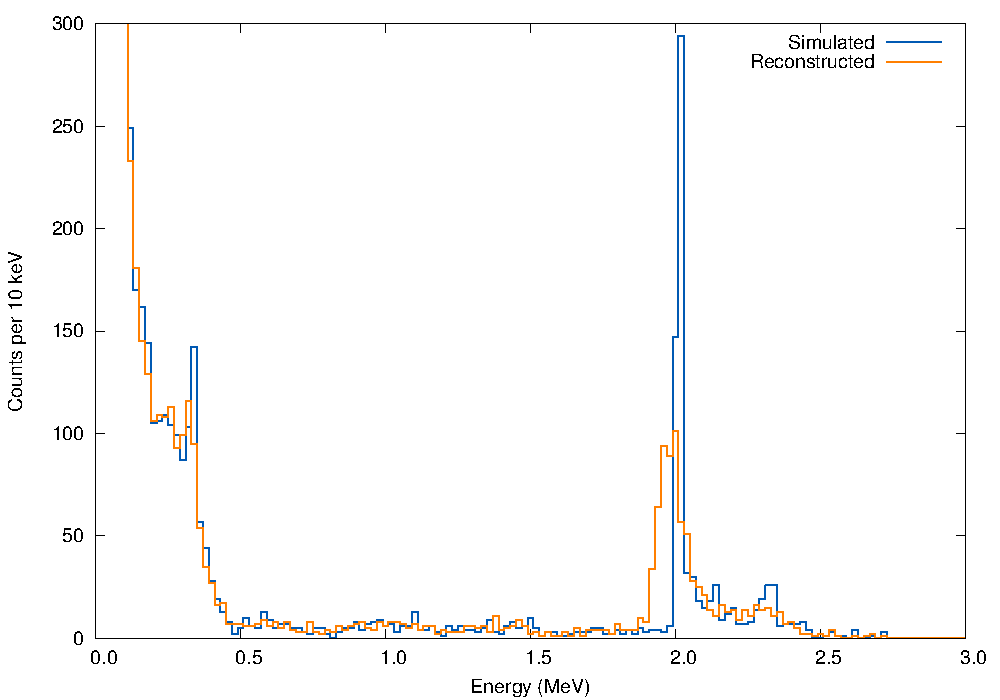
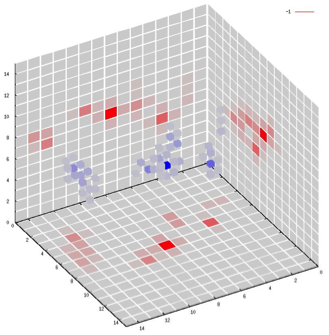
True energy deposits (blue) in the cells of the lattice are compared with the reconstructed cellular energy deposits (orange) in figure 9. Both histograms show the Compton edge for 511 keV gammas at 340 keV, the positron energy at 2 MeV, and annihilation gamma contamination to the positron energy in the counts above 2 MeV; the reconstruction gives a full width half maximum (FWHM) of keV at 2 MeV. Figure 10 of a reconstructed 2 MeV positron event.
Next, the reconstruction of the total energy for 2 MeV positrons stopping and annihilating in the detector is shown in figure 11. The total energy reconstructs in a range from about 1.9 to 3.1 MeV. The majority of this broad width is due to leakage of the annihilation gamma’s energy from the detector. However, this produces some interesting features in the spectrum. Peaked at about 3 MeV is the full energy deposit for the positron and about 500 keV below this peak is another peak that corresponds to the escape of one of the 511 keV annihilation gammas from the detector. There are not many events past the single escape peak because the back-to-back emission of the annihilation gammas makes the loss of both gammas unlikely; however, there is a small feature at 2 MeV that corresponds to the double escape of the annihilation gammas. Past this, there are very few counts, which indicates how unlikely the positron is to escape from the detector.

The event reconstruction is not limited to the total energy deposit, because the spatial resolution afforded by the ROL detector design allows independent analysis of events on a cell-by-cell basis. Since the 2 MeV positron will be contained in 1 to 2 cells and the annihilation gammas scatter and deposit their energy in several cells surrounding the vertex cell, the positron energy can be reconstructed more precisely by looking at the cell with the highest energy deposit and its largest deposit neighbor. These plots are shown in figure 12; column (a) (the blue histogram) is the energy of the cell with the largest reconstructed deposit; column (b) (the green histogram) is the combined energy of the cell with the largest energy deposit, and its neighboring cell with the largest deposit; column (c) (the orange histogram) is the total reconstructed energy. In the plot, the 2 MeV positron’s reconstructed energy using only the largest deposits (blue) is slightly less than 2 MeV, which is due to the leakage of the positron into an adjacent cell. Furthermore, there are more counts to the left of the peak relative to the plot in column b and less counts to the right. The counts to the right are events in which there is annihilation gamma contamination in the vertex cell. Therefore, inclusion of the largest neighbor cell to the vertex roughly doubles the annihilation gamma contamination. It is clear by comparing the two histograms that the centroid of the reconstructed positron peak shifts toward higher energies, thus indicating that the positron’s energy was fully contained in the two adjacent cells and the reconstruction gives a FWHM resolution of about 8% at 2 MeV.
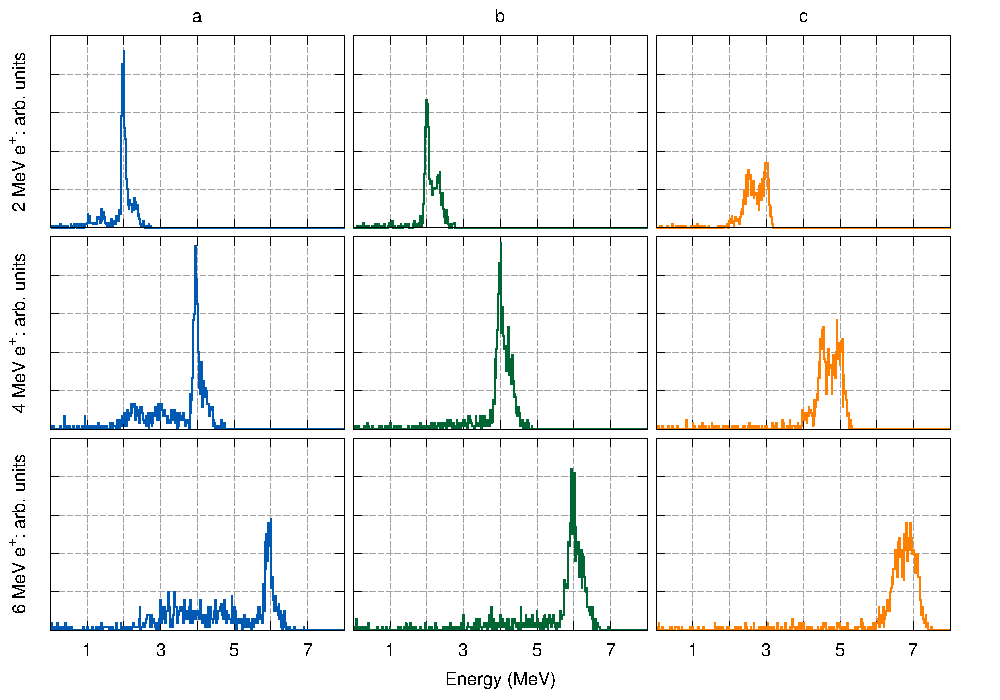
Simulation of positrons at 4 and 6 MeV further illustrates the need for the inclusion of the largest neighboring deposit to the vertex cell for the positron’s energy determination. These plots are also shown in figure 12 with the columns defined in the same way as above. As the positron energy increases it is more likely to deposit energy in a neighboring cell, and by comparing peaks one can see that the number of counts to the left of the peak in column (a), grows as the energy increases. These counts move to higher energies, as before, when the largest neighbor cell is included.
Lastly, the expected positron spectrum based on the Gösgen reactor experiments [49] is simulated with and without the best fit sterile oscillations in figure 13 and figure 14.
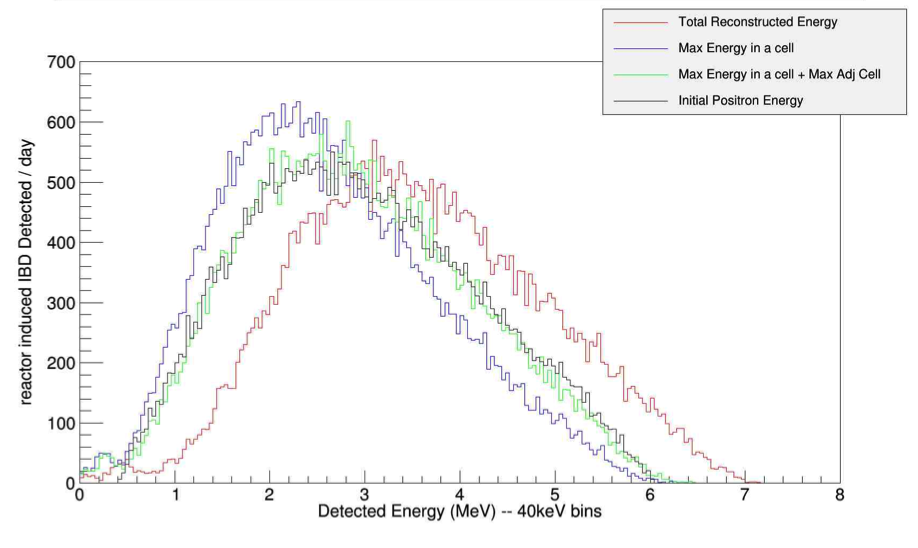
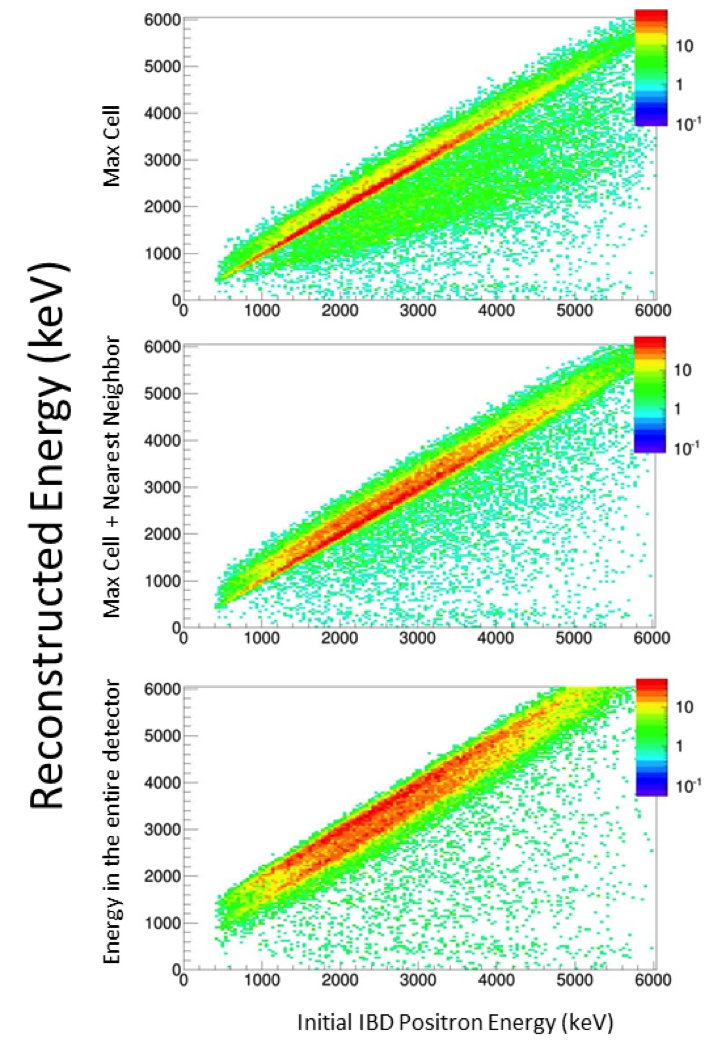
NuLat is unique among the proposed very-short baseline experiments because of FWHM energy resolutions of 8% for positrons can be obtained. These tight energy resolutions are due to the ability of NuLat to separately reconstruct the positron’s energy from the annihilation energy, which is afforded by the ROL segmentation.
8 Sensitivity to Sterile Neutrinos
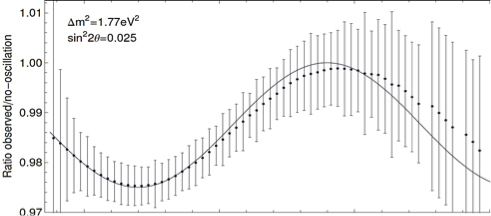
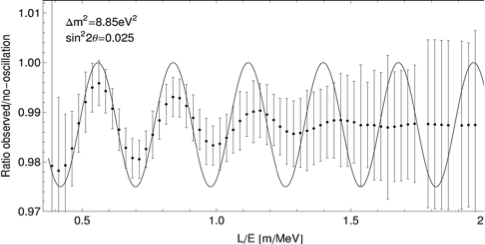
Figure 15 shows oscillation pattern for different choices of sterile neutrino mass difference assuming point like reactor source. Excellent ability to observe oscillations even at close to 10 eV2 can be noted. Figure 16 shows the sensitivity of NuLat for testing RAA. Projected sensitivity is based on 1535 2.5” cells and a 0.53 m3 cubic-reactor core with uniform power density. Calculations were done 3.5 and/or 7.0 m from the core, with 1% or 10% uncertainty in the spectral shape. While the sensitivity is comparable to those of other short baseline reactor experiments (such as PROSPECT [44]), the clear advantage of NuLat originates from its unique lattice design that ensures a more powerful background rejection, vertex and energy resolution and a much shorter exposure time if operated at the US naval reactor of 1.5 GWth. While the sensitivity plot refers to a 1 year exposure at 100 MWth reactor, this translates to just 24 days and one station (or 12 days at each of two stations) in the vicinity of a 1500 MWth US naval reactor.

8.1 Deployment Plan
Two types of reactor sites have been identified for the NuLat experiment. The first type is a research reactor, in particular the NIST research reactor and the DOE Advanced Test Reactor (ATR) in Idaho. Their detailed features are described in [46]. While compact and fueled with 235U, they both have relatively low power, and being at the Earth’s surface, very little shielding from reactor related backgrounds or cosmic rays. The second type is a US naval reactor on the newest generation of US aircraft carriers that are very compact, well shielded and powerful: 1.5 GWth. Because of the naval reactor compactness, NuLat can assess baselines between m with a high neutrino flux.
The NuLat detector will be first deployed at NIST, ATR or possibly ORNL, for initial commissioning and data taking and then taken to a US Navy reactor for its final run. The final run is anticipated to take less than a year, allowing NuLat to collect a large data sample of IBD events, for a precise test of the RAA in a short time.
9 Summary of NuLat Project
The Neutrino Lattice design is unique among very short baseline reactor neutrino experiments in search of evidence for sterile neutrinos, and will produce superior results in signal and removal of background due to the high level of 3D voxelization. This detector has multiple other uses, including investigating the peculiar MeV spectral bump seen in the RENO, Double Chooz and Daya Bay experiments, precise measurement of reactor neutrino flux, and being useful as a reactor monitor and as a neutron detector.
Most of the resources have been identified and are starting construction in early 2015, with the goal of testing at NIST in late 2015 and going to a USN reactor in 2016.
10 Appendix A: ROL Design
10.1 MicroLENS
MicroLENS was a prototype ROL detector built by the LENS collaboration as a test bed for lattice construction, filling, and operating. The lattice for microLENS was made from 0.002” thick Teflon FEP strips and sheets. The strips were creased and then woven around 0.5 mm quartz rods. These strips defined the sides for a layer of cells in microLENS. The layers had a sheet of FEP placed above and below; these sheets defined the top and bottom of the lattice’s cells.
Teflon FEP has an index of refraction of 1.34 compared to typical scintillator of 1.5, thus giving a . This means that the Teflon FEP lattice has significant spray light; however, it gives much more total light than a comparable air gap lattice. Given the greater light yield and relative ease of construction microLENS was built with an FEP lattice. Details available in [57][58].
10.2 Other ROL Construction Techniques
The microLENS prototype was constructed using the strips of film, but this method is not suited to the construction of vapor gap ROLs. In addition to this, the microLENS construction method was time consuming due to the difficulty of working with such thin films and fragile quartz rods. Therefore, the LENS collaboration developed the slat method of construction. This method is essentially a 3-D weave of low index material that subdivides a volume into cells. The cells are defined by slats placed in the , , and directions. The concept is illustrated in figure 17.
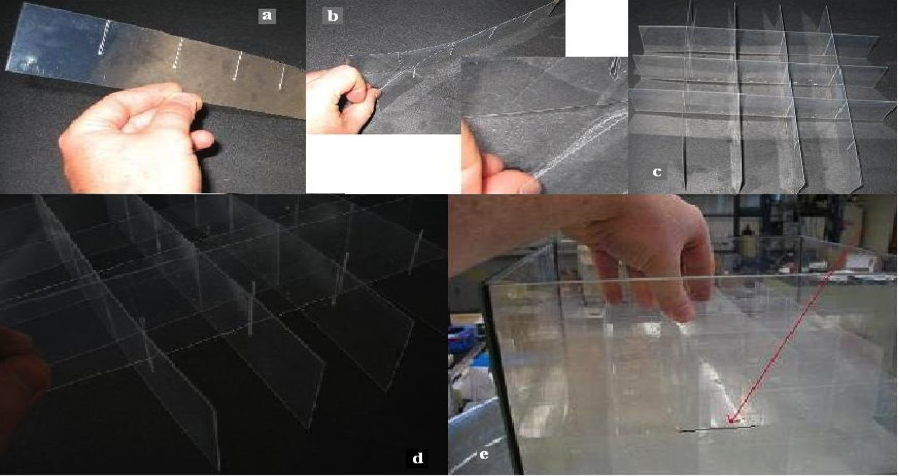
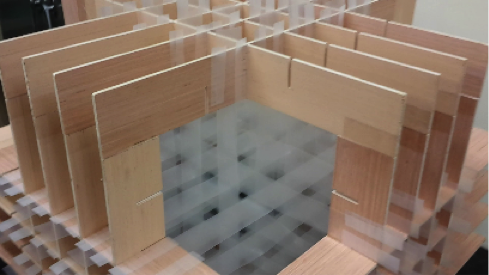

To use the slat construction method for a Teflon FEP ROL, a thin coating on a stiff acrylic plastic substrate was investigated, but the coating FEP onto acrylic is problematic due to the temperatures involved. An alternative to the coating is to couple a thin sheet of FEP to the acrylic backing; however, the resulting lattice strip’s planarity was not sufficient and the concept was abandoned. The best method for producing a FEP lattice using the slat method is to simply use strips of Teflon FEP with tensioners to keep the films flat.
The slat construction method is also suited to the building of vapor gap ROLs. These ROLs can be made by taking two sheets of thin (0.015”) acrylic and bonding with a frame of acrylic. This leaves a 0.015” vapor gap between the outer sheets of acrylic. The gap can be filled with the desired material—air or perfluorooctane (PFO)—for example. The drawback to this construction method is that since the slats are fairly thick they introduce significant lattice channel cross talk. This cross talk can be eliminated, but at the expense of the light yield. Moreover, for long-term deployment there is no guarantee that the integrity of the slats will be maintained. Details in [57][58].
10.3 NuLat Light Guides (LGs)
LGs can have various roles in a ROL detector that depend on the detector’s specific construction and deployment. However, for all ROL detectors LGs provide an efficient means of light collection from the lattice’s square cross section to the round cross section of a PMT’s photocathode. It should be noted that these LGs are especially efficient because the light from the lattice is primarily moving along the LG’s longitudinal axis; hence, their transport efficiency is not as affected by Liouville’s theorem.
ROL detectors that employ Teflon FEP as the low index barrier in a liquid scintillator produce a sizeable fraction of light that is not channeled. In order to maintain the best position resolution possible, (at the expense of energy resolution), it is necessary to remove this unchanneled, or “spray” light. The simplest solution is to use an external light guide that has first a square cross section that matches the dimension of the lattice cells with an approximately 2 cell dimension length. The LG then transitions down to the round cross section of the PMT. The square section is optically coupled to Teflon, which is then optically coupled to a light absorbing material, so that the channeled light continues to be channeled while unchanneled light passes through the Teflon and is absorbed. The same effect can be produced, and space saved, if inserts of a similar construction to the square section of the LG are placed in the outer most layer of the lattice. However, to get the same reduction in spray light the insert must be sub-divided into smaller square cross sections. This is needed to ensure that any unchanneled light has at least one or two chances of being absorbed. The inserts are also problematic because they introduce extra light blocking and additional complications in event reconstruction. ROL detectors that use air for the low index barrier produce little spray light and thus do not require the specialized LGs just discussed.
LGs can be made of a variety of materials, and their construction can be optimized to the specific deployment of the detector. For example, if a shielding liquid, like water or mineral oil surrounds the detector, then LGs can be constructed from clear or reflective films that transport light via TIR or specular reflection. These LGs allow for a low mass, and hence higher radiopurity, solution for low background applications. In the case of a ROL detector deployed in air it is best to construct the LGs from solid acrylic bars. These LGs transport light via TIR and are easily machined to have a square-to-round transition.
VTech, over the past few years, has developed expertise in modeling, constructing, and testing LGs. A simulation package has been written for modeling LGs with various cross-sectional shapes, including the square-to-round transitions described above, and for various constructions made from solids or films. For testing LGs, VT has developed a well-characterized robotic light source that has a time-averaged behavior of an isotropic point source of light mimicking isotropic scintillation light, for realistic evaluation of the LG performance.
11 Appendix B: Detector Optical Performance
There are several techniques with many possible materials to construct the NuLat optical lattice. Simulations of the light output and efficiencies of several of the material options for NuLat have been performed using the GEANT4 toolkit [50]. Some simulation results plus the pros and cons of representative designs are presented below.
Before going into the simulation results, a preliminary discussion of total internal reflection and its application to the NuLat detector is warranted. There are several competing factors to detecting scintillation light in NuLat: generate a maximum of channeled light, generate a maximum of total light detected, and minimize effects for varied propagation paths of the scintillation light as it leaves the detector. Balancing these factors depends on what materials are used to construct NuLat.
The first issue considered is the channeling of light out of the detector. For scintillation light that is emitted isotropically from scintillator with index of refraction, , in a cubical lattice of index of refraction, , total internal reflection will occur if the angle from the normal of a plane, , for each face of the cube is greater than . Assuming isotropically emitted scintillation light and total internal reflection for each face of a unit cell, the fraction of the scintillation light can be calculated: (1) channeled out directly along the axes of symmetry of the lattice into six PMTs that define the vertex cell, (2) channeled out in the three planes defined by a cell and not into the direct PMTs, (3) sprayed out of the corners of the cell into other planes, or (4) that which is trapped in a cell until reabsorbed by the scintillator itself. In order to get perfectly channeled light with no leakage into the plane or out of the corners of a cell the index of refraction ratio should be . But this leads to of the light getting trapped in the detector. To have no trapped light requires an index of refraction ratio to be . But some fraction of light is no longer channeled, but rather sprays out of the channel, making analysis of the event topology more difficult.
The second issue to consider is that as the difference between the scintillator and lattice index of refraction increases, the reflection at the scintillator-lattice interface, , increases as , for incident light perpendicular to the surface of the lattice. The effect becomes appreciable with increasing indices of refraction ratio - on the order of a few percent at each lattice interface. This effect also increases proportionally to the number of cells in the lattice. This light is not necessarily lost, but adds to delayed light.
Lastly, if some lattice material other than air is chosen and not all of the light is channeled, then the edge of NuLat behaves as a single cell of an optical lattice and this complicates the interpretation of the channeled scintillation light.
First, several of the possible NuLat design options were simulated a positron with an energy distribution from keV to MeV approximating the distribution found from the positron spectrum measured at Gösgen [49] and generated in the center cell only. The positron proceeds to annihilate into two keV -rays and this process is simulated in GEANT4. For the present discussion the subsequent neutron capture was not simulated. The fact that events are generated in the center cell is not a limiting factor since it is easy to determine where the positron is created due to the light channeling of the NuLat detector. For all of the simulations in this section, scintillation absorption length of meters is assumed. This is shorter than for most of the actual materials, but it is instructive to compare the different materials of NuLat on a more equal footing in order to evaluate the lattice light propagation effectiveness. Increasing the absorption length increases the amount of light detected in every NuLat design. For the air gap and perfluorooctane (PFO) medium simulations, there is also a cut requiring no large energy detected in the outer layer of the NuLat detector, which increases the uniformity of light detected by the detector. This cut is not possible for the water filled lattice due to the spray of light out of the plane of detection. Lastly in these simulations, light guides have not been used. This reduces the channeled light collected by 40%. More detail of the impact of the light guides is discussed in section 10.3.
For comparison of all of the possible detector materials, two histograms are considered, each of which can be used to estimate the energy of the positron. First, large amounts of light emanating from a single cell were considered, more than can possibly be created by a single -ray energy deposition. This is referred to as a large amount of light in each of the histograms. The actual value of large depends upon each NuLat design and sets the minimum energy of a positron that can be detected in NuLat. The second histogram shows the total amount of light detected by the entire detector. These two plots form a basic evaluation of channeling and total light output of each particular NuLat setup. The large light histogram is a good way to directly estimate the positron kinetic energy, while the total light histogram is a good way to estimate the energy of the positron plus the two 511 keV -rays, because the -ray energy is, likely to be detected in several cells instead of concentrated in a single cell. Subtracting this expected keV -ray energy from the total energy is another way to estimate the positron initial kinetic energy.
For all of the simulations a 151515 lattice was chosen with (2.5” or 6.35 cm)3 cells. The three sides of the detector were mirrored. The mirror reduces the number of PMT plus electronics and reduces the space required for the NuLat detector. The non-mirrored design can only exceed the performance of the mirror design, thus all the minimal requirements derived from the mirrored simulations will certainly hold for the non-mirrored case. And for all of the following simulations, the light guides were skipped and results are described in section 10.3. This reduces the light detected by approximately and increases the resolution of the simulation results accordingly.
11.1 Light Channeling in Solid Detection Medium
The NuLat lattice made up of solid doped scintillator such as EJ-254 (which is the default design option) has been considered first. This is an off-the-shelf material with index of refraction of 1.58 and a density slightly over 1.02 g/cc depending on the exact boron concentration. Possible lattice optical barriers include air (n = 1.0), PFO (n = 1.255), and water (n = 1.33). For all of these solid NuLat designs a lattice gap of is used.
Since the solid scintillator (EJ-254) and air gap optical barrier is the easiest to build and is the basis of the proposed experiment, thus a more detailed analysis than for the other design options has been considered. This includes more details of energy deposits per cell and a preliminary energy estimation technique of the positron initial energy.
-
1.
Index of scintillator nscint = 1.58 (EJ-254) and index of optical barrier nlat = 1.0 (Air)
The light channeling is the best for the air optical lattice, rad, which means all the light is channeled from the cell of energy deposit directly to the three PMTs that look at the cell. However, there is also a fair amount of trapped light. When compared to other design choices this setup has a large amount of back reflected light, with an at each cell lattice interface. The number of PEs detected in large PE PMT is shown in figure 19. The positron energy is easily determined down to approximately 600 keV. In figure 19, even lower values of positron energy can be determined, if the signal can be distinguished from the background. More detailed analysis of the signal is expected to result in better event reconstruction, but this simple event evaluation demonstrates the power of the segmentation of the NuLat detector.
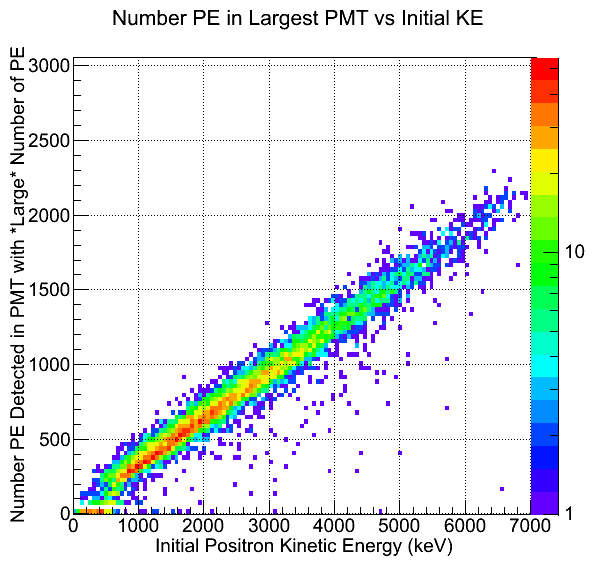
Figure 18: Histogram of the light detected by all PMTs which detect more than 100 PEs per PMT vs. the positron initial kinetic energy. The histogram has been generated for EJ-254 solid with air filled gaps around each cell of the NuLat detector. Both figures have the same y-axis scale for easy comparison. 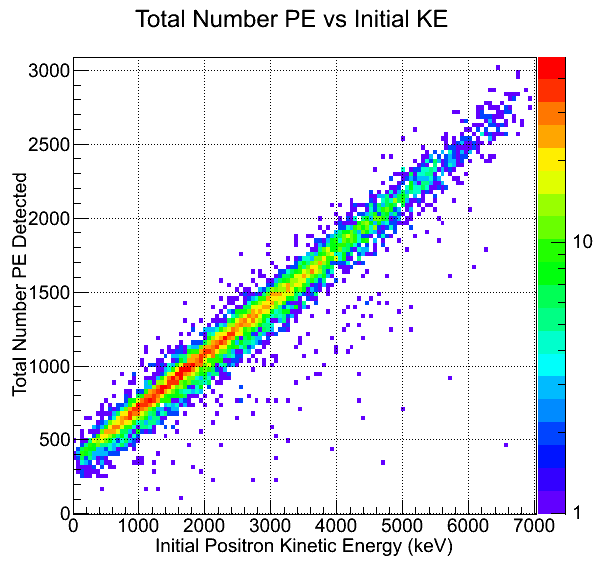
Figure 19: Histogram of the total amount of light detected by all PMTs vs. the positron initial kinetic energy. The histogram has been generated for EJ-254 sold with air filled gaps around each cell of the NuLat detector. Both figures have the same y-axis scale for easy comparison. A 2 MeV positrons interaction with the NuLat detector was examined. First, the energy deposit per cell, both the recorded, as shown in figure 21, and the detected optical energy (photo-electrons or PE) in a single PMT, as shown in figure 21 were analyzed. The particles that deposit energy are easily identified by the amount of energy deposited in individual NuLat cells. The low energy is energy deposited by the 511 keV -rays in a single cell. The Compton edge at 340 keV is clearly seen. All other energies are deposited either by the positron in one or more cells or by the positron and a -ray in a single cell. Selecting PMTs that see at least slightly more energy than the Compton edge for 511 keV -rays produces a good measurement of the positron energy. It can be seen from figure 21 that it corresponds to about 60 PEs for the solid scintillator cubes with air gap NuLat design option.
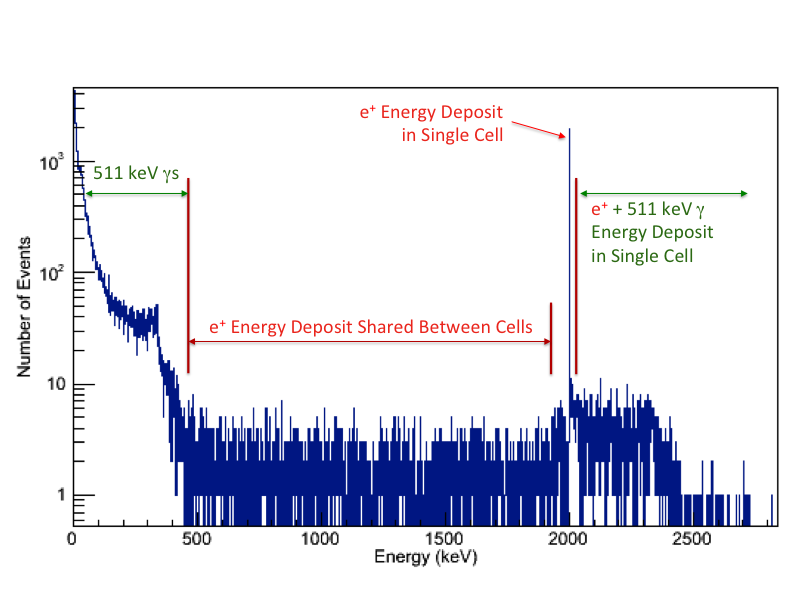
Figure 20: Recorded energy per cell in the GEANT4 simulation. The 511 keV Compton edge is clearly visible at 340 keV. The partial and full 2 MeV positron energy deposits and the full positron energy deposit plus a 511 keV Compton edge are also clearly recognizable. The simulation has been performed for a single cell of EJ-254 solid scintillator with air filled gaps around each cell of the NuLat detector. 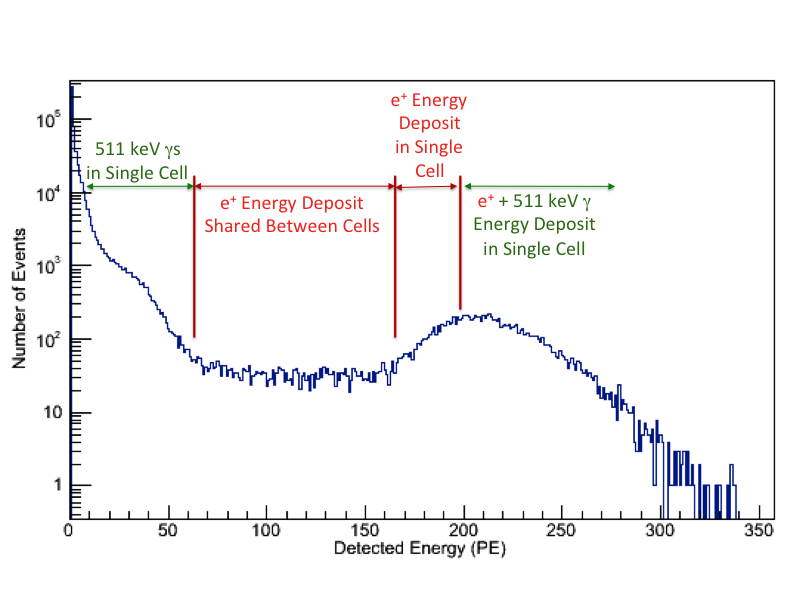
Figure 21: The number of PEs detected in a PMT proportional to detected energy, for all individual PMTs. This graph is effectively the energy deposit shown in figure 21 smeared by the single PMT energy resolution. The simulation has been performed for a single cell of EJ-254 solid scintillator with air filled gaps around each cell of the NuLat detector. A cut on the energy detected by a single PMT of greater than 60 PEs and sum all of these PMTs together for the 2 MeV positron is shown in figure 22 in red. This positron energy estimate is referred as the ”large PE PMT energy estimate”. The full width half maximum (FWHM) of the reconstructed energy is about . When the light guides are modeled the energy resolution improves enough to separate out the Compton energy deposits in the same cell as the positron and hence improve the energy resolution and efficiency for the positron energy estimate. Another route to estimating the positron energy is to subtract the 1.022 MeV -ray energy from the total energy deposit of an event. This plot for a 2 MeV positron is also shown in figure 22 but in blue. This is referred to as ’total energy deposit’ technique. It is interesting to note that the total energy deposit technique tends to slightly underestimate the positron energy (because of undetected -ray energy) while the large PE PMT method tends to slightly overestimate the positron energy (due to Compton scattering of -rays in the positron cell). These methods are complimentary to each other.
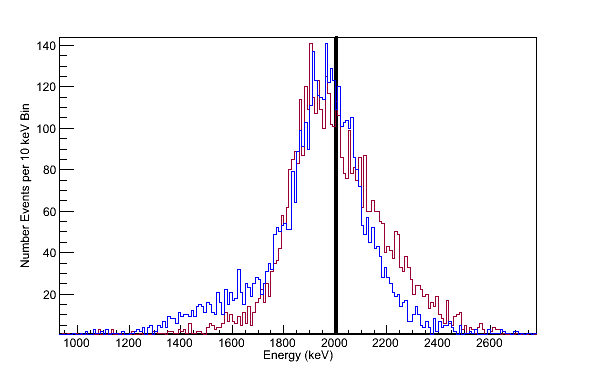
Figure 22: Simulated energy deposition of a 2 MeV positron in a single cell for the EJ-254 with air gaps around each cell of the NuLat detector. Recorded initial positron energy deposit (black), the large PE PMT reconstructed energy of the positron (red), and reconstructed energy of positron by subtracting out the 1.022 MeV energy from the total detected light (blue). The last energy resolution item analyzed is the simulation of the full expected positron spectrum based on the Gösgen reactor experiments [49] and the reconstruction of the positron energy based on the above basic algorithms. The results are shown in figure 24. Since this is a smooth spectrum and the positron energy resolution is at worst FWHM, the evaluated spectrum looks promising. Using the large PE PMT method and ignoring background contamination, NuLat is capable of measuring positron energies down to keV.
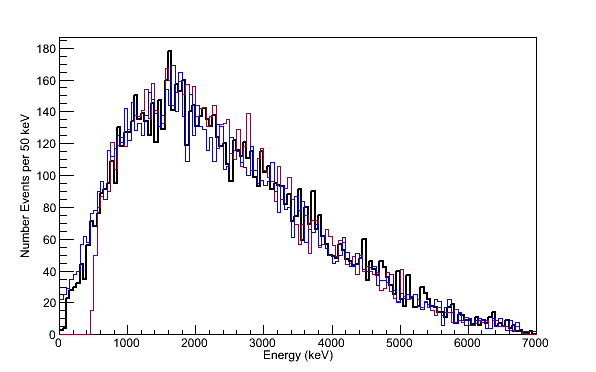
Figure 23: Simulated energy deposits for inverse beta decay positrons in a single cell for the EJ-254 with air filled gaps around each cell of the NuLat detector. Recorded initial positron energy deposit (black), the large PE PMT reconstructed energy of the positron (red), and reconstructed energy of positron by subtracting out the 1.022 MeV energy from the total detected light (blue). One last interesting observation about the minimum number of PE detected is how many PMTs see that much energy per event. This is a direct measure of the positron’s original location. If the light is completely channeled and the positron deposits energy in only one cell then only 3 PMT (6 in an non-mirrored detector design) should detect a large amount of energy. A complementary way to think about this is that each cell is effectively an independent detector that has 3 PMT watching it. But each PMT watches more than one cell so when two adjacent cells have large energy deposits only 5 PMT will see large amounts of light, not the naively expected PMT for the mirrored design. For a 2 MeV positron the number of PMT that see more than 60 PE are shown in figure 23 in red and the number of PMT that see any amount of light are shown in figure 23 in blue. Notice it is most likely that either 3 or 5 PMT see large amounts of light. For higher energy positrons it is common to see 7 PMT that detect large amounts of light.
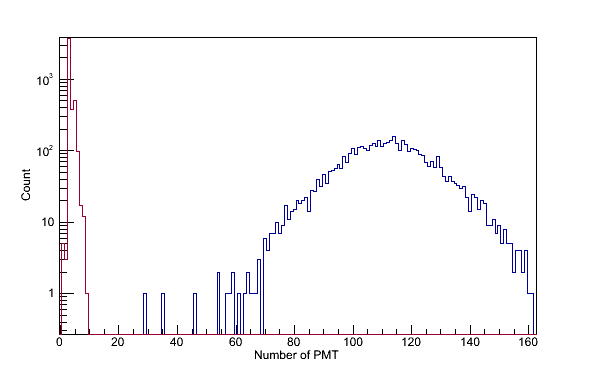
Figure 24: The number of PMTs that detect light for 2 MeV positrons for the EJ-254 with air filled gaps around each cell of the NuLat detector. The number of PMTs that detect a large amount of light (more than 60 PEs) are shown in red and the number of PMT that detect any amount of light are shown in blue. The large light PMT are related to the number of cells that the positron deposits energy, discussed in the text. -
2.
Index of scintillator nscint = 1.58 (EJ-254), index of optical barrier nlat 1.255 (PFO)
For the PFO optical lattice, the best channeling is achieved, rad, but there is also light sprayed into the plane, however no light gets trapped. Comparing the total number of PE in both figure 26 and figure 26, there is more light produced in the total PEs histogram per energy and in the large number of PEs PMT when compared to the air gap construction light output.
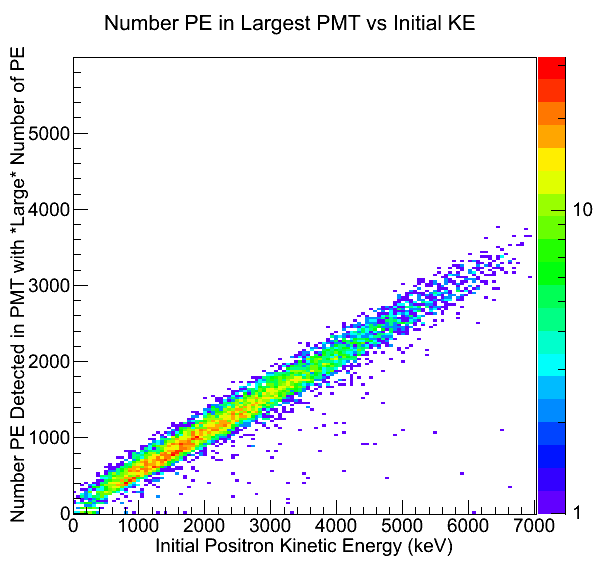
Figure 25: Histogram of the light detected by all PMTs which detect more than 100 PEs per PMT vs. the positron initial kinetic energy. Histograms for EJ-254 solid with PFO filled gaps around each cell of the NuLat detector. Both figures have the same y-axis scale for easy comparison. 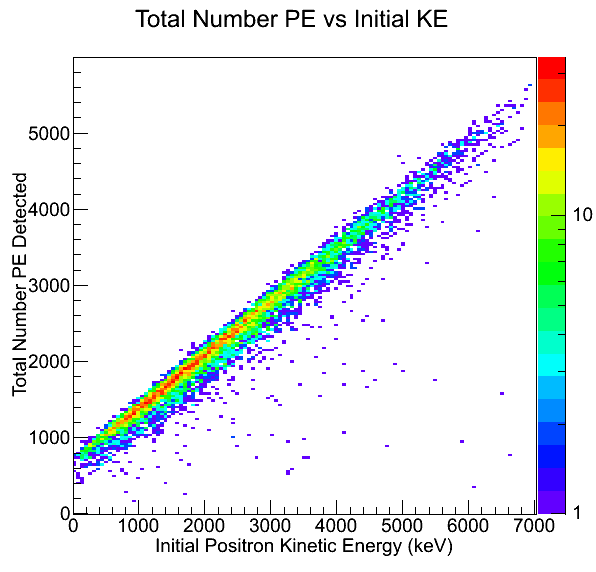
Figure 26: Histogram of the total amount of light detected by all PMTs vs. the positron initial kinetic energy. Histogram generated for EJ-254 solid with PFO filled gaps around each cell of the NuLat detector. Both figures have the same y-axis scale for easy comparison. -
3.
Index of scintillator nscint = 1.58 (EJ-254), index of optical barrier nlat = 1.33 (Water)
For the water optical lattice, the best channeling of all the solid scintillator options is achieved, rad, but there is also light sprayed into the plane and into the corner PMTs of the detector. However no light gets trapped. Comparing the total number of PEs in both figure 28 and figure 28, there is more light produced in the total PEs histogram per energy, but less in the large number of PEs PMT histogram when compared to the air gap construction light output.
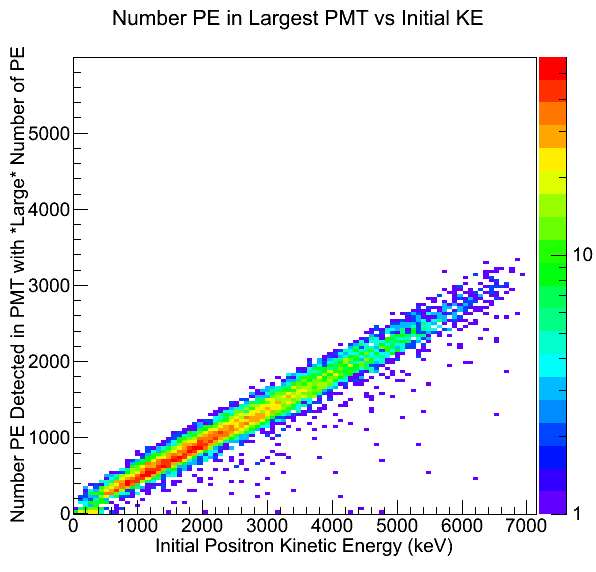
Figure 27: Histogram of the light detected by all PMTs which detect more than 100 photo-electrons per PMT vs. the positron initial kinetic energy. Histograms for EJ-254 solid with water filled gaps around each cell of the NuLat detector. Both figures have the same y-axis scale for easy comparison. 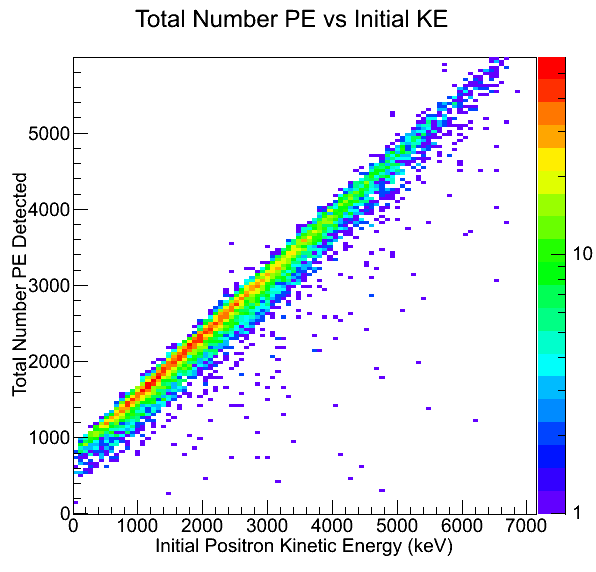
Figure 28: Histogram of the total amount of light detected by all PMTs vs. the positron initial kinetic energy. Histograms for EJ-254 solid with water filled gaps around each cell of the NuLat detector. Both figures have the same y-axis scale for easy comparison. Pros: Ease of construction Safety, no flammable liquids Complete channeling of optical light (Air) Up to more dense than liquid scintillator Cons: Large back reflection at cell interfaces (Air) Cost Reduced total light collected (Air) Reduced channeling of optical light (Water, PFO) Edge effects (Water, PFO) Table 2: Pros and cons of the solid scintillator NuLat detector design.
11.2 Light Channeling in Liquid Detection Medium with Single and/or Double Layer Barrier NuLat
The basic doped liquid scintillator such as EJ-339 is considered next. This off the shelf material has an index of refraction of 1.415 and a density slightly over 0.92 g/cc depending on the doping concentration. Possible lattice optical barriers include air (n = 1.0), PFO (n = 1.255) and Teflon (n = 1.34). The air gap is considered only, as the others have much reduced channeling of light because of the lower index of refraction of the scintillator. Construction of the lattice for liquid scintillators is challenging and even the best construction techniques have measurable light leakage into the adjacent channels. For all of the liquid setups a lattice gap of acrylic and air gap is used.
-
1.
Index of detection medium nscint = 1.415 (EJ-339), index of optical barrier nlat = 1.0 (Air)
For the air optical lattice, the best channeling is obtained, rad, which means light is channeled down the lattice and very little into the plane. Comparing the total number of PEs in both figure 30 and figure 30, there is more light produced in the total PEs histogram per energy but less in the large number of PEs PMT histogram when compared to the air gap construction light output.
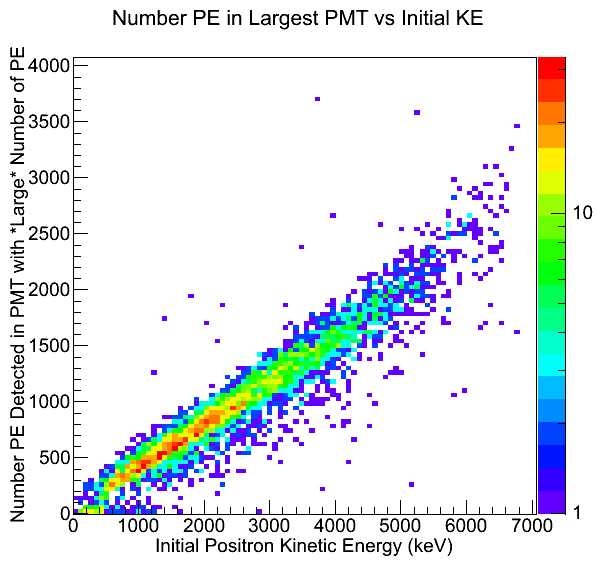
Figure 29: Histogram of the light detected by all PMTs which detect more than 100 PEs per PMT vs. the positron initial kinetic energy. Histogram for EJ-339 liquid with air filled gaps between acrylic layers around each cell of the NuLat detector. Both figures have the same y-axis scale for easy comparison. 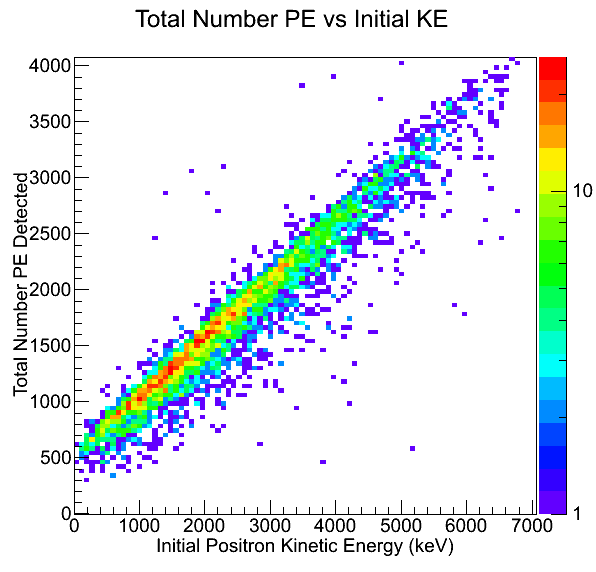
Figure 30: Histogram of the total amount of light detected by all PMTs vs. the positron initial kinetic energy. Histograms for EJ-339 liquid with air filled gaps between acrylic layers around each cell of the NuLat detector. Both figures have the same y-axis scale for easy comparison. Table 3: Pros and cons of the liquid scintillator NuLat detector design. Pros: Cost of liquid scintillator Almost optimal channeling of optical light (Air) Construction already demonstrated with Teflon and LAB scintillator () [51] Increased total light collected compared to Solid+Air NuLat Cons: Liquids more difficult and more costly to handle, flammable Construction of lattice with gas interface challenging to build Reduced channeling of light (PFO, Teflon) Short Absorption Length (Teflon) Edge effects (Water, PFO, Teflon)
11.3 Simulation outcomes
Initial simulations of 2 MeV positrons show that both solid and liquid scintillators and different barrier choices have their advantages and disadvantages. Solid detectors do not suffer from sprayed light and therefore have the most digital like signature. And while the overall amount of light reaching PMTs is less, there is still enough light to detect 600 keV positrons, below the IBD threshold. Even with a very simple energy reconstruction, NuLat can easily achieve 15% to 20% energy resolution at FWHM (
References
- [1] R. N. Mohapatra and G. Senjanovic, Phys. Rev. Lett. 44, 912 (1980)
- [2] J. Schechter and J. W. F. Valle, Phys. Rev. D22, 2227 (1980)
- [3] M. Fukugita and T. Yanagida, Phys.Lett. B174, 45 (1986)
- [4] S. Davidson, E. Nardi, and Y. Nir, Phys. Rept. 466, 105 (2008), arXiv:0802.2962 [hep-ph]
- [5] T. Asaka, S. Blanchet, and M. Shaposhnikov, Phys. Lett. B631, 151 (2005), arXiv:hep-ph/0503065
- [6] ”Sterile Neutrinos at the Crossroads” Workshop, Sept. 2011, Virginia Tech Center for Neutrino Physics, Blacksburg, VA; http://www.cpe.vt.edu/snac/
- [7] K.N. Abazajian et al., arXiv:1204.5379 (2012)
- [8] “Report of the Particle Physics Project Prioritization Panel (P5)”, 2014, http://www.usparticlephysics.org/p5/
- [9] D. Frekers, et al., Phys. Lett. 706B, 134 (2011)
- [10] Z. Hou et al. http://arxiv.org/abs/1212.6267 (2012)
- [11] Daya Bay Collaboration, Phys. Rev. Lett. 108, 171803 (2012)
- [12] RENO Collaboration, Phys. Rev. Lett. 108, 191802 (2012)
- [13] Double Chooz Collaboration, Phys.Rev.Lett. 108 (2012) 131801
- [14] S. Oguri et al. http://arxiv.org/abs/1404.7309 (2014)
- [15] A. Aguiler-Areval et al. (LSND Collaboration), Phys. Rev. D 64, 112007 (2001)
- [16] A.A. Aguiler-Arevalo et al. (MiniBooNE Collaboration) Phys. Rev. Lett. 102, 101802 (2009)
- [17] A.A. Aguiler-Areval et al. (MiniBooNE Collaboration), Phys. Rev. Lett. 110, 161801 (2013)
- [18] B. Armbruster et al. (KARMEN Collaboration), Phys. Rev. D65, 112001 (2002), arXiv:hep-ex/0203021 [hep-ex]
- [19] F. Dydak et al., Phys. Lett. B134, 281 (1984)
- [20] P. Adamson et al. (MINOS Collaboration), Phys.Rev.Lett. 107, 011802 (2011), arXiv:1104.3922 [hep-ex]
- [21] N. Agafonova et al. (OPERA Collaboration), JHEP 07 004 (2013)
- [22] E. Segreto et al. (ICARUS Collaboration), J. Phys. Conf. Ser. 447, 012064 (2013)
- [23] J. Abdurashitov et al. (SAGE Collaboration), Phys.Rev. C59, 2246 (1999), arXiv:hep-ph/9803418 [hep-ph]
- [24] P. Anselmann et al. (GALLEX Collaboration.), Phys.Lett. B342, 440 (1995)
- [25] G. Mention, M. Fechner, Th. Lasserre et al., Phys. Rev. D 83, 073006 (2011)
- [26] P. A. R. Ade et al. [Planck Collaboration], “Planck 2013 results. XVI. Cosmological parameters,” arXiv:1303.5076 [astro-ph.CO]
- [27] G. Fuller, talk at “Fundamental Symmetries, Neutrinos, Neutrons and related Nuclear Astrophysics” Long-Range Plan Town Meeting, Chicago, Illinois, Sept. 2014; https://fsnutown.phy.ornl.gov/fsnuweb/
- [28] A.A. Aguiler-Arevalo et al. (MiniBooNE Collaboration) Phys. Rev. Lett. 105, 181801 (2010)
- [29] J. Beringer et al. (Particle Data Group), Review of Particle Physics, Phys. Rev. 86, 010001 (2012)
- [30] K. Schreckenbach et al.. Phys. Lett. 99B, 251 (1981)
- [31] K. Schreckenbach et al.. Phys. Lett. 160B, 325 (1985)
- [32] F. von Feilitzsch, A. A. Hahn and K. Schreckenbach, Phys. Lett. 118B, 162 (1982)
- [33] A. A. Hahn et al., Phys. Lett. 218B, 162 (1989)
- [34] Th. A. Mueller, D. Lhuillier et al., arXiv:1101.2663
- [35] RENO Collaboration, report at Neutrino 2014 conference, Boston June 2014
- [36] Th. Lasserre, arXiv:1404.7352v1, Proceedings of the TAUP 2013, Monteray, California, September 2013
- [37] A. S. Cucoanes et al., J. Phys. Conf. Ser. 375, 042063 (2012)
- [38] K. N. Abazajian et al., arXiv:hep-ph/1204.5379
- [39] A. V. Derbin et al., arXiv.org/pdf/1204.2449
- [40] A. P. Serebrov et al., arXiv:hep-ph/1205.2955; arXiv:hep-ph/1310.5521
- [41] I. Alekseev et al., arXiv:hep-ph/1305.3350
- [42] A. Vacheret et al., AAP2013 conference
- [43] Hanaro Collaboration, http://indico.cern.ch/event/245969/session/0
- [44] Z. Djurcic et al., arXiv:hep-ph/1309.7647 (2014)
- [45] D. Lhuillier, ”Future Short-Baseline Sterile Neutrino Searches with Reactors”, http://neutrino2014.bu.edu/program/, Neutrino 2014 conference, Boston (June 2014)
- [46] K. M. Heeger, M. N. Tobin, B. R. Littlejohn, H. P. Mumm, arXiv:hep-ex/1212.2182
- [47] http://www.eljentechnology.com/index.php/products/loaded-scintillators/78-ej-254 Retrieved 09/10/2014
- [48] C.D. Bass et al., App. Rad. and Iso. 77, 130 (2013)
- [49] G. Zacek et al. Phys. Rev D34, No. 9, 262, (1986)
- [50] Allison, J. et al. Nuclear Science, IEEE Transactions on 53, 270-278, (2006)
- [51] Private Communication from LENS Group
- [52] A. Bernstein, https://str.llnl.gov/str/JanFeb06/pdfs/01_06.4.pdf
- [53] G. R. Josher et al., arXiv:1307.2832 [physics.ins-det], Physics Reports, Volume 527, Issue 3, (2013) 131
- [54] M. Apollonio et al., Phys.Rev.D61:012001, (2000)
- [55] C. Grieb et al., ”Measuring the Neutrino Luminosity of the Sun with LENS & the MINILENS prototype”, Volume 221, December 2011, Pages 349, The Proceedings of the 22nd International Conference on Neutrino Physics and Astrophysics (2006)
- [56] mTC Collaboration, ”miniTimeCube: A Portable, Compact Neutrino Detector” presented at Advances in Neutrino Technology (ANT) (2014)
- [57] J. Blackmon, et al., LENS collaboration, in preparation
- [58] S.D. Rountree, Science and Technology of a Low-Energy Solar Neutrino Spectrometer (LENS) And Development of the MiniLENS Underground Prototype, etd-05192010-144208, (2010)
- [59] N. Zaitseva, et al., Nuc. Instrum. and Meth., A729 747–754 (2013)