Electronic and Spin States of SrRuO3 Thin Films: an X-ray Magnetic Circular Dichroism Study
Abstract
We report a study of the local magnetism in thin films of SrRuO3 grown on (111) and (001) oriented SrTiO3 substrates using x-ray magnetic circular dichroism spectroscopy (XMCD) at the Ru- edges. The application of the sum rules to the XMCD data gives an almost quenched orbital moment and a spin moment close to the value expected for the low spin state . Full-multiplet cluster calculations indicate that the low spin state is quite stable and suggest that the occurrence of a transition to the high spin state in strained thin films of SrRuO3 is unlikely as it would be too expensive in energy.
pacs:
75.70.Ak, 75.47.Lx, 78.70.Dm, 72.80.GaDespite being investigated already for about five decades the physical properties of SrRuO3 keeps fascinating the scientific community. SrRuO3 is one of the few known 4 transition metal oxide ferromagnets with Tc as high as 160 KCallaghan66 ; Longo68 . Its non-integer magnetic moment has been interpreted in terms of a surprising rare example of itinerant ferromagnetism in oxidesSingh96 ; Allen96 . More recently, the possibility of employing thin films of SrRuO3 as conducting layer in epitaxial heterostructures of functional oxides has aroused a wide attention from the applied science communityKoster12 .
SrRuO3 is a perovskite compound with an orthorhombic GdFeO3 type structure Bouchard72 ; Jones89 . The orthorhombic distortion arises from the zig-zag tilting, along the -axis, and rotation, around the -axis, of the corner-sharing RuO6 octahedra. Despite this distortion the RuO6 octahedra remain nearly regular Jones89 ; Gardner95 ; Bushmeleva06 . In a localized picture, the strong crystal field at the octahedral site splits the Ru 4 bands of the Ru4+ ions into and levels, leading to a low spin (LS) configuration with . Theoretical calculationsLaad01 ; Jeng06 ; Rondinelli08 ; Kim14 and a X-ray magnetic circular dichroism (XMCD) studyOkamoto07 suggest that the orbital moment in SrRuO3 should be quenched. High magnetic field measurements on a bulk single crystal give a saturated magnetization of 1.6 /Ru ionCao97 , a value similar to the ordered magnetic moment determined by neutron diffraction experimentsLongo68 ; Bushmeleva06 .
While the technology for growing high quality SrRuO3 thin films on (001) oriented SrTiO3 substrates, SRO/(001)STO, was developed long time ago and is well knownKoster12 , the systematic growth of thin films on (111) oriented SrTiO3 substrates, SRO/(111)STO, is quite recentChang09 ; Grutter10 . Very surprisingly the first SQUID measurements of SRO/(111)STO films have provided a saturated moment of 3.4 /Ru ion Grutter10 ; Grutter12 , a value that is much higher than that observed in bulk SrRuO3 and exceeds the atomic moment of 2 /Ru ion expected for a spin state. In order to explain the SQUID results it has been proposedGrutter12 that the trigonal compressive strain induced by the (111)STO substrate onto the film would stabilize the high spin state (HS) , which is very surprising as a HS state is unusual in oxides. Even more intriguing, an unquenched orbital moment of about 0.32 has been reported for these strained films on the basis of XMCD measurements at the Ru edgesGrutter12 . However, theoretical studies, which investigated the effect of substrate-induced compressive strain on the physical properties of SrRuO3 could not find evidence in support of the alleged stabilization of a HS state or even suggested the reduction of the magnetic moment from bulk valuesKim14 ; Zayak08 . Further, a very recent studyLee14 on SRO/(111)STO has reported magnetization values suggesting a LS state, in contradiction with the results published earlierGrutter10 ; Grutter12 . Understanding the stability of the magnetic ground state of SrRuO3 is obviously a very important aspect for controlling the magnetic properties of heterostructures involving SrRuO3 as conducting layer.
In this work we address two questions: 1) whether compressive strain can induce a spin state transition in SRO/(111)STO and 2) whether the orbital moment is quenched. To this end, we have performed an investigation of the XMCD signal at high magnetic field at the Ru edges of SrRuO3 films under different compressive strains (trigonal strain for the case of (111)STO substrate and tetragonal strain for the case of (001)STO substrate) compared with the case of a SrRuO3 single crystal. XMCD is a well-established technique to study local magnetic properties. The XMCD signal can be analyzed by means of sum rulesthole92a ; Carra93 , allowing for a direct experimental determination of the desired quantum numbers and . The energy separation between Ru and edges of about 150 eV is much larger than the multiplet effects (a few eV), and therefore the spectra are very suitable also for spin sum rule analysisCarra93 . In addition, the signal-to-background ratio at the edges is higher than at the edges. We would like to stress that obtaining a reasonable degree of circular polarized light at the photon energies of the edges of elements is challengingTomaz98 and only thanks to the development of the new BOREAS beamline this XMCD investigation of the Ru edges has been possible. In addition, a comparison of the line shape to full-multiplet theory can be made to unravel details of the wave functions forming the ground state.
Single crystalline thin films of SrRuO3 were grown on SrTiO3 substrates with different orientations by metalorganic aerosol deposition. Thin SrRuO3 films grown on (001) and (111) oriented substrates were determined by X-ray diffraction (XRD) to have (100)c and (111) orientation, respectively. (In this report, we use pseudocubic notation for SRO films. (110)orthorhombic and (101)orthorhombic is equivalent to (100)c and (111) in the pseudocubic notation). The XRD results show that the films grown on (111) oriented substrates exhibit an elongation of the out-of-plane lattice constant (3.946(1) and 3.950(1) Å for the 80 and 27 nm thick films, respectively) compared to bulk SrRuO3 ( ÅGrutter12 ). This systematic evolution of the out-of-plane constant with film thickness (the thinner the film, the larger the out-of-plane constant) is an effect of the strain: under compressive in-plane strain the in-plane lattice constant shrinks, while the out-of-plane lattice constant becomes elongated, in order to roughly preserve the unit cell volumeLee14 . The thickness of the SrRuO3 films was determined by small-angle X-ray scattering. Details of their preparation and structure characterization are reported in Ref. 24. Large single crystals of SrRuO3 were grown by floating zone technique. The purity and quality of the crystal were checked by x-ray diffraction. Susceptibility measurements using a MPMS squid magnetometer show a bulk ferromagnetic transition at = 160 K for the single crystal, and between 154 K and 147 K for the films depending on the film thickness. The x-ray linear dichroism (XLD) and x-ray magnetic circular dichroism (XMCD) experiments at the Ru- edges (2800-3000 eV) were performed at the BL29 Boreas beamline at the ALBA synchrotron radiation facility in Barcelona. The energy resolution was 1.4 eV and the degree of circular polarization delivered by the Apple II-type elliptical undulator was adjusted to 70% as balanced trade off between degree of polarization and photon flux required when working at high photon energies and high undulator harmonics. The degree of linear polarization for XLD is close to 100%. The XMCD signal was measured using a magnetic field of 6 Tesla with the sample at a temperature of 50 K. The spectra were recorded using the total electron yield method (by measuring the sample drain current) in a chamber with a vacuum base pressure of 2x10⁻¹⁰ mbar. The single crystalline sample was cleaved in situ to obtain a clean sample surface normal to the (110) direction. The XAS spectra were collected in both = 6 T and -6 T applied fields and in groups of four or quartet ( or , where and indicate photon spin parallel or antiparallel to the applied field, respectively) in order to minimize the effect of any time dependence in the X-ray beam on the measured spectra.
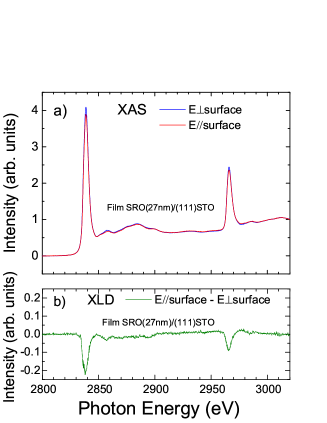
In Fig. 1 we report the Ru- XAS measured on a 27 nm SRO/(111)STO film for linearly polarized light coming in with the electric field vector E normal [dark (blue) lines] and parallel [light (red) lines] to the film surface. The Ru core-hole spin-orbit coupling splits the spectrum roughly in two parts, namely the (at 2840 eV) and (at 2970 eV) white lines regions. A clear linear dichroism (XLD) can be observed, which is an indication that the film is under in-plane compressive strain. In fact, in-plane compressive strain leads to a trigonal elongation of the RuO6 octahedron along the (111) axis. As consequence, the orbitals are split in and orbitals, with the orbital lying higher in energy and, hence, having more holes. The experimentally observed larger spectral weight for E normal to the film surface is a result of the uneven hole distribution among the orbitals induced by the strain.
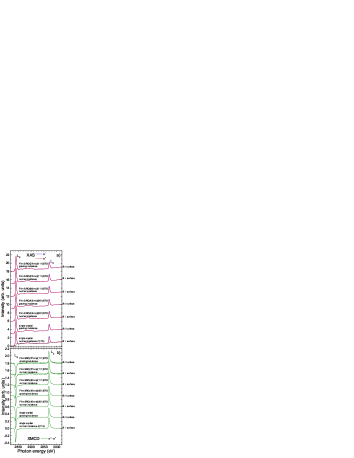
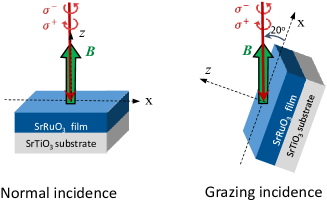
The top panel of Fig. 2 shows the Ru- XAS measured on SRO/(111)STO and SRO/(001)STO films and, for comparison, on a SrRuO3 single crystal. The XAS spectra were taken using circular polarized light with the photon spin parallel (, red curves) and antiparallel (, blue curves) aligned to the magnetic field. The difference spectrum (), i.e., the XMCD spectrum, is reported in the bottom panel of Fig. 2. The spectra were collected with the beam in grazing (surface) and in normal (surface) incidence, see Fig. 3 for experimental geometry. The XMCD signal is larger for surface than for surface by about 30% for the SRO/(001)STO film, and by about 5% for the 27 nm SRO/(111)STO film. The anisotropy of the XMCD signal agrees with the picture of an out-of-plane easy axis for SrRuO3 films grown on STO as reported in literature Grutter10 ; Lee14 . The reduced magnetic anisotropy shown by our XMCD measurements in the case of SRO/(111)STO films with respect to SRO/(001)STO film is in fair agreement with previous SQUID measurementsLee14 . Both XAS and XMCD spectra measured on the SRO/(111)STO and SRO/(001)STO films appear fairly identical to those measured on the bulk single crystal, without clear evidence of changes in the spectral lineshape and in the size of the XMCD signal that otherwise could suggest a different spin state.
| Sample | incidence | ||||
|---|---|---|---|---|---|
| Crystal | surface | 0.01 | 0.01 | 1.9 | |
| Crystal | surface | 0.01 | 0.02 | 1.7 | |
| SRO(45nm)/(001)STO | surface | 0.01 | 0.01 | 1.9 | |
| SRO(45nm)/(001)STO | surface | 0.01 | 0.02 | 1.5 | |
| SRO(80nm)/(111)STO | surface | 0.00 | 0.00 | 2.0 | |
| SRO(27nm)/(111)STO | surface | 0.01 | 0.03 | 1.9 | |
| SRO(27nm)/(111)STO | surface | 0.01 | 0.02 | 1.8 |
The material metallicity and life time broadening (2 eV) may limit the information that can be obtained from the lineshape about the Ru ground state. However, it is possible to use the sum rules for XMCD developed by Thole and Carra et al. thole92a ; Carra93 to extract from our XMCD data the orbital () and spin (2) moments:
| (1) |
| (2) |
For ions in octahedral symmetry the magnetic dipole moment is a small number and can be neglected compared to Teramura96 . The number of holes in the shell was estimated to be about by our cluster calculations, in agreement with previous estimatesGuedes12 , reflecting the highly mixed covalency of the ground state in SrRuO3. In estimating the XAS intensities, the edge jump background, described as arctan function, has been subtracted from the XAS spectra (dashed curve in Fig. 2). The results of the application of the sum rules are reported in table 1. The orbital moment is found to be almost quenched for all samples, including the SRO/(111)STO. The spin contribution to the magnetic moment in the 80 and 27 nm SRO/(111)STO films in normal incidence is found to be close to the value expected for a spin state and very similar to that found for the bulk single crystalspin . These results are in clear contradiction with the much larger saturated moment values reported earlierGrutter12 from SQUID measurements on SRO/(111)STO films.
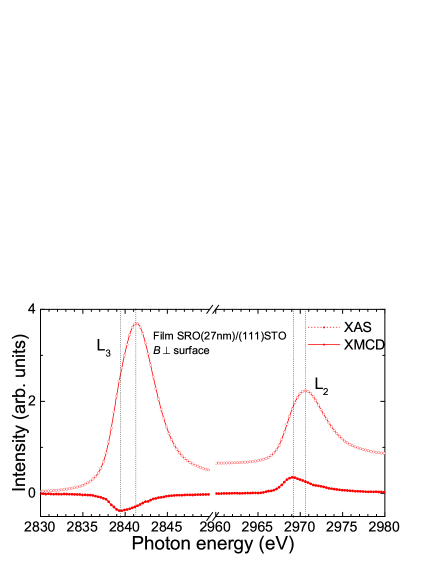
As mentioned before, the spectra seem to be rather featureless, but a closer look reveals that for both and edges the maximum in intensity of the XAS spectrum lies 1.5 eV higher in energy position than that of the XMCD spectrum (see Fig. 4). We see exactly the same difference in energy position in the spectra of all samples. A similar energy shift of the XMCD peak with respect to the XAS peak was previously observed for the Ru- edgesOkamoto07 and can be understood considering that only the orbitals contribute to the XMCD signal, while both and orbitals contribute to the XAS spectrum with the XAS maximum corresponding to the signal from the unoccupied levels. Therefore, this energy position difference provides a very important information as it reflects the crystal field splitting between the and orbitals. In order to determine quantitatively we have performed simulations of the XAS and XMCD spectra using the well-proven full-multiplet configuration-interaction approachdegroot94 ; thole97 . It accounts for the intra-atomic and Coulomb interactions, the atomic and spin-orbit couplings, the oxygen hybridization, and local crystal field parameters. In the simulations we considered a RuO6 cluster with a cubic symmetry as the octahedra in bulk SrRuO3 are fairly regularJones89 ; Gardner95 ; Bushmeleva06 . The calculations were performed using the XTLS 8.3 codeTanaka94 with the parameters given in Ref. 31. We applied to the spectra additional Gaussian (1.4 eV) and Lorentzian (2 eV) broadening in order to take into account experimental resolution and lifetime effects, respectively.
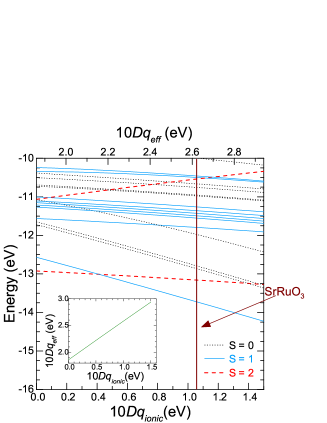
In Fig. 5 we report the energy level diagram of the Ru4+ ion as a function of the ionic crystal electric field 10 in a cubic local symmetry. The energy difference between the two levels with orbital occupation and (bottom and top red dashed line in Fig. 5, respectively) can be taken as a measure of the effective crystal electric field , i.e. the splitting between and levels including the effect of the hybridization with the oxygens. The diagram shows that for 2.15 eV ( 0.41 eV) the level with configuration is the lowest energy level (bottom solid blue line) and the ground state of Ru4+ ion has spin state. As the crystal field is reduced across the critical value of 2.15 eV ( 0.41 eV) the level (red dashed line) becomes the lowest energy level and the HS state is stabilized. The non-magnetic state (black dotted lines) lies always much higher in energy and never becomes the ground state for any value of the cubic crystal field.
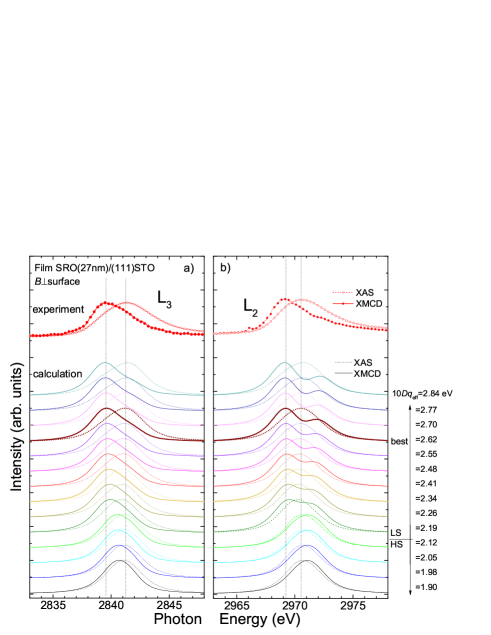
In Fig. 6 we show the comparison of the simulated XAS and XMCD spectra at the edges with the experimental spectra measured on SRO/(111)STO film. The simulated XAS and XMCD spectra were calculated for different values of the ionic and effective crystal field splitting. For the sake of clarity, the spectra were normalized to the height of the peak and the XMCD signal at the edge was reversed. The calculated spectra show that the peak position depends on the value of crystal field splitting. The experimental energy separation between the maxima of the XMCD and XAS spectra can be correctly simulated for 2.62 eV and the lineshape of the calculated spectra is fairly similar to that of the experimental spectra. For such a value of the Ru4+ ions are in a LS ground state. The HS spin state becomes stable only for smaller crystal field splitting, 2.15 eV. In the hypothesis of a HS spin state as a ground state the simulated XMCD spectrum looks very different from the experimental one: 1) at the and edge the XMCD lineshape is not anymore asymmetric; 2) at the edge the XMCD maximum occurs at higher photon energy than the XAS maximum, which is opposite to what has been experimentally observed. As it can be seen in the energy level diagram reported in Fig. 5 SrRuO3 is located very far from the stability region for the HS state.
To summarize, we have used XMCD spectroscopy to investigate the local magnetism in thin films of SrRuO3 grown on (111) and (001) oriented SrTiO3 substrates. We have found that the orbital moment is almost quenched and the spin is close to the value expected for a spin state. From a comparison of the experimental with simulated spectra we could determine the effective crystal field. The hypothesis of a compressive strain-induced spin state transition, as proposed in literature on the basis of SQUID measurements, can be ruled out as the stabilization of the high spin state with would be too costly in energy.
The XMCD experiments were performed at the BOREAS beamline of ALBA Synchrotron with the collaboration of ALBA staff. The research leading to these results has received funding from the European Community’s Seventh Framework Programme (FP7/2007-2013) under grant agreement n.o312284. Q. Liu received financial support from the European Union through the ITN Soprano Network (Grant No. PITN-GA-2008-214040). K.-T. Ko acknowledges support from the Max Planck-POSTECH Center for Complex Phase Materials (No. KR2011-0031558).
References
- (1) A. Callaghan, C. W. Moeller, and R. Ward, Inorg. Chem. 5, 1572 (1966).
- (2) J. M. Longo, P. M. Raccah, and J. B. Goodenough, J. Appl. Phys. 39, 1327 (1968).
- (3) D. J. Singh, J. Appl. Phys. 79, 4818 (1996).
- (4) P. B. Allen, H. Berger, O. Chauvet, L. Forro, T. Jarlborg, A. Junod, B. Revaz, and G. Santi, Phys. Rev. B 53, 4393 (1996).
- (5) see a review in Gertjan Koster, Lior Klein, Wolter Siemons, Guus Rijnders, J. Steven Dodge, Chang-Beom Eom, Dave H. A. Blank, and Malcolm R. Beasley, Rev. Mod. Phys. 84, 253 (2012).
- (6) R. J. Bouchard and J. L. Gillson, Mater. Res. Bull. 7, 873 (1972).
- (7) C. W. Jones, P.D. Battle, P. Lightfoot, and W. T. A. Harrison, Acta Crystallogr. Sect. C 45, 365 (1989).
- (8) S. Gardner, G. Balakrishnan, and D. Mck. Paul, Physica C 252, 303 (1995).
- (9) S. N. Bushmeleva, V. Y. Pomjakushin, E. V. Pomjakushina, D. V. Sheptyakov, and A. M. Balagurov, J. Magn. Magn. Mater. 305, 491 (2006).
- (10) M. S. Laad and E. Müller-Hartmann, Phys. Rev. Lett. 87, 246402 (2001).
- (11) Horng-Tay Jeng, Shi-Hsin Lin, and Chen-Shiung Hsue, Phys. Rev. Lett. 97, 067002 (2006).
- (12) James M. Rondinelli, Nuala M. Caffrey, Stefano Sanvito, and Nicola A. Spaldin, Phys. Rev. B 78, 155107 (2008).
- (13) Bongjae Kim and B. I. Min, Phys. Rev. B 89, 195411 (2014).
- (14) J. Okamoto, T. Okane, Y. Saitoh, K. Terai, S.-I. Fujimori, Y. Muramatsu, K. Yoshii, K. Mamiya, T. Koide, A. Fujimori, Z. Fang, Y. Takeda, and M. Takano, Phys. Rev. B 76, 184441 (2007).
- (15) G. Cao, S. McCall, M. Shepard, J. E. Crow, R. P. Guertin, Phys. Rev. B 56, 321 (1997).
- (16) J. Chang, Y.-S. Park, J.-W. Lee, and S.-K. Kim, J. Cryst. Growth 311, 3771 (2009).
- (17) A. Grutter, F. Wong, E. Arenholz, M. Liberati, A. Vailionis, and Y. Suzuki, Appl. Phys. Lett. 96, 082509 (2010).
- (18) A. J. Grutter, F. J. Wong, E. Arenholz, A. Vailionis, and Y. Suzuki, Phys. Rev. B 85, 134429 (2012).
- (19) A. T. Zayak, X. Huang, J. B. Neaton, and K. M. Rabe, Phys. Rev. B 77, 214410 (2008).
- (20) B. Lee, O.-U. Kwon, R. H. Shin, W. Jo, and C. U. Jung, Nanoscale Res. Lett. 9, 8 (2014).
- (21) B. T. Thole, P. Carra, F. Sette, and G. van der Laan, Phys. Rev. Lett. 68, 1943 (1992).
- (22) P. Carra, B. T. Thole, M. Altarelli, and X. Wang, Phys. Rev. Lett. 70, 694 (1993).
- (23) M. A. Tomaz, Tao Lin, G. R. Harp, E. Hallin, T. K. Sham, and W. L. O’Brien, J. Vac. Sci. Technol. A 16, 1359 (1998).
- (24) M. Schneider, V. Moshnyaga, P. Gegenwart, Journal of Physics: Conference Series 200, 012178 (2010).
- (25) Y. Teramura, A. Tanaka, and T. Jo, J. Phys. Soc. Jpn. 65, 1053 (1996).
- (26) E. B. Guedes, M. Abbate, K. Ishigami, A. Fujimori, K. Yoshimatsu, H. Kumigashira, M. Oshima, F. C. Vicentin, P. T. Fonseca, and R. J. O. Mossanek, Phys. Rev. B 86, 235127 (2012).
- (27) The spin contribution obtained by Okamoto et al.Okamoto07 from Ru- XMCD measurements is only 0.6 . However, as the authors admitted, the electron-core-hole interaction, which in the case of the edges mixes and components, the use of scraped surfaces of polycrystalline samples and the relative small magnetic field (2 T) might have caused an underestimation of the moment reported in the latter work.
- (28) F. de Groot, J. Electron Spectrosc. Relat. Phenom. 67, 529 (1994).
- (29) See the ”Theo Thole Memorial Issue”, J. Electron. Spectrosc. Relat. Phenom. 86, 1 (1997).
- (30) A. Tanaka and T. Jo, J. Phys. Soc. Jpn. 63, 2788 (1994).
- (31) = 3.0 eV, = 4.0 eV, = 2.19 eV, = -1.03 eV and = 1.0 eV. Slater integrals were reduced to 70 % of the Hartree-Fock values. The Ru 4 spin-orbit parameter was set to zero to avoid the (singlet) state to form the ground state, and instead, to allow the or states to become stable.