The 11.2m emission of PAHs in astrophysical objects
Abstract
The 11.2m emission band belongs to the family of the ‘Unidentified’ Infrared (UIR) emission bands seen in many astronomical environments. In this work we present a theoretical interpretation of the band characteristics and profile variation for a number of astrophysical sources in which the carriers are subject to a range of physical conditions. The results of Density Functional Theory (DFT) calculations for the solo out-of-plane (OOP) vibrational bending modes of large polycyclic aromatic hydrocarbon (PAH) molecules are used as input for a detailed emission model which includes the temperature and mass dependence of PAH band wavelength, and a PAH mass distribution that varies with object. Comparison of the model with astronomical spectra indicates that the 11.2m band asymmetry and profile variation can be explained principally in terms of the mass distribution of neutral PAHs with a small contribution from anharmonic effects.
keywords:
molecular processes – ISM: molecules – ISM: lines and bands1 Introduction
The discovery by Gillett, Forrest & Merrill (1973) of an emission feature near 11.2m in spectra of planetary nebulae opened a new era in the study of interstellar matter. It is now recognised as one of the strongest of the ‘unidentified infrared’ (UIR) or ‘aromatic infrared’ (AIB) bands that lie between 3 and 20m and which are generally attributed to vibrational transitions of polycyclic aromatic hydrocarbon (PAH) molecules (for a review see Tielens, 2008, and references therein). However, in no case has it proved possible to identify a specific PAH molecule. This is unfortunate because knowledge of PAH shape, size distribution and degree of hydrogenation and/or ionisation would allow much greater exploitation of the spectra as probes of astrophysical conditions and processes. The advent of infrared (IR) satellites including ISO, Spitzer (Werner et al., 2004a) and AKARI (Murakami et al., 2007) has revealed the richness of the AIB spectrum and also significant differences in the profiles of individual bands (e.g. van Diedenhoven et al., 2004; Berné et al., 2007; Rosenberg et al., 2011, 2012; Boersma, Rubin & Allamandola, 2012; Boersma, Bregman & Allamandola, 2013). Interpretation of these variations in terms of the physical and chemical properties of PAHs and the astronomical objects in which they are found could assist in the identification of PAH sub-groups, and thus narrow down the number of possible PAHs as carriers of AIBs.
In this paper we focus on the 11.2 m feature, which is one of the most distinctive bands in the AIB spectrum. It has been assigned to the C-H out-of-plane (OOP) bending mode of solo-containing neutral PAHs (Hony et al., 2001; van Diedenhoven et al., 2004; Bauschlicher, Peeters & Allamandola, 2008; Ricca et al., 2012), although their precise molecular shapes and size distribution has not been established. Weaker emission features around 11.0 m are generally attributed to the same type of transition in PAH cations (Sloan et al., 1999; Hudgins & Allamandola, 1999; Boersma, Bregman & Allamandola, 2013). We present here an emission model based on Density Functional Theory (DFT) calculations of vibrational transitions and intensities for a set of PAH molecules. The model considers the emission process following optical/UV excitation using the relevant stellar spectral energy distribution (SED) and includes the temperature dependence of the emission wavelength (band position) as the PAH molecule cools through emission of IR photons. The results are used to explore the variation of the 11.2m profile in a range of astronomical objects with particular reference to the influence of the PAH mass distribution.
The paper is arranged as follows. In Section 2 the characteristics of the 11.2m band are reviewed. The theoretical approach and the results of a series of DFT calculations are presented in Section 3 and the emission model is described in Section 4. Sections 5 and 6 contain the results and discussion of their astrophysical implications. A possible contribution from acenes to the 11.0m feature in the Red Rectangle is also discussed.
2 Characteristics of the 11.2m band
2.1 Classification of the 11.2m band
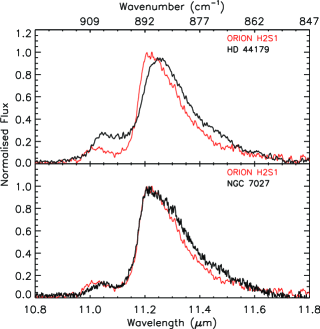
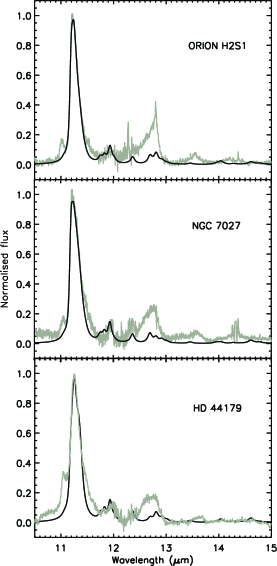
The 11.2m feature has an asymmetric shape with a steep blue side and an extended red tail (Roche, Aitken & Smith, 1989; Witteborn et al., 1989). Following analysis of ISO observations of objects in the Galaxy, van Diedenhoven et al. (2004) proposed two classes of 11.2m sources (A11.2 and B11.2) and introduced a description using a tail-to-top ratio, i.e. the strength of the red wing relative to the peak intensity of the overall profile with maximum near 11.2m. Sloan et al. (2007) introduced a third class, C11.2. The class characteristics, illustrated with examples in Fig. 1, are:
- A11.2
-
- the most common, with a peak wavelength ranging between 11.20 and 11.24m and a relatively short red tail. Sources belonging to this class have a low value of tail-to-top ratio and comprise various types of interstellar matter - reflection nebulae, H ii regions and the general interstellar medium.
- B11.2
-
- less common, with a peak wavelength of 11.25 m and a long tail. Objects in this class, such as the Red Rectangle (HD 44179), have a high value of tail-to-top ratio and are usually associated with circumstellar matter.
- C11.2
-
- only a few examples, with peak wavelength ranging between 11.35 and 11.40m and an approximately symmetric shape. Bands belonging to this class are found in carbon-rich objects.
Some objects (mostly planetary nebulae) are classified as class A(B)11.2 and have a mixture of the characteristics of the A and B classes, with a peak wavelength of class A11.2 and a tail-to-top ratio of class B11.2 objects (see for example BD+30∘ 3639 in Fig. 1). Also, within the single reflection nebula NGC 7023, variation in the 11.2m spectra from type A to A(B) has been found (Boersma, Bregman & Allamandola, 2013). The A/B-type classification has also been applied to other spectral features in the 3m and 6-9m regions.
Based on a study of mid-IR Spitzer spectra of carbon-rich post-AGB stars in the LMC, Matsuura et al. (2014) have introduced separate classifications for the 6-9m and 10-14m regions, where the spectra for the latter region are classified as and . As the spectra we consider here are high-resolution data from ISO-SWS (de Graauw et al., 1996), we have elected to use the A11.2, B11.2 and A(B)11.2 classification of van Diedenhoven et al. (2004).
2.2 Asymmetry and peak wavelength of the 11.2m band
Interpretation of the shape and the variation in the profile of the 11.2m band is a significant challenge which requires an explanation of (a) the steep short-wavelength side, (b) the variable peak wavelength and (c) the extension to longer wavelength. Considering these in turn:
(a) The wavelength at half peak intensity () on the short-wavelength side of the 11.2m feature in 16 spectra of class A11.2 sources is almost invariant, which we determine to be 11.171 (2 = 0.002)m; the origin of this striking property is not understood. If the short-wavelength edge is considered to be part of a Lorentzian profile this would correspond to a FWHM of only c. 4 cm-1 which is narrow compared with other UIR bands.
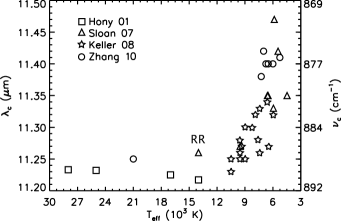
(b) The peak wavelength of the 11.2m feature has been found to depend on the effective temperature, Teff, of the exciting star (Sloan et al., 2007; Keller et al., 2008). Fig. 2 collects together data from various authors. The peak wavelength of the 11.2 m band is independent of temperature for class A11.2 objects (squares), but starting from class B11.2 ( triangle - The Red Rectangle) it shifts to longer wavelength with decrease in stellar temperature. This change has been interpreted in terms of relatively newly formed material near to low temperature carbon-rich or Herbig Ae/Be stars (class C11.2) compared with older processed material in the higher temperature environments of planetary nebulae and H ii regions (Sloan et al., 2007).
(c) Barker, Allamandola & Tielens (1987) suggested that the long red tail of the 11.2m band may be due to superimposed transitions between higher vibrational levels such as v = 2 1. In the absence of laboratory data this contribution was incorporated assuming that the v = 2 1 band falls at an arbitrarily chosen wavenumber 5 cm-1 lower than for the fundamental transition. More recently, van Diedenhoven et al. (2004) noted that while a feature of class A(B)11.2 could be considered as coming from the same PAH population distribution as that which gives rise to class A11.2 – but with higher internal energy, they commented that the difference between the A11.2 and B11.2 classes could not readily be explained by anharmonic effects alone. A contribution to emission in the red tail could potentially come from duo-Hs of compact PAH cations (Hudgins & Allamandola, 1999), C–H OOP transitions in PAH anions (Bauschlicher, Peeters & Allamandola, 2009) or from protonated PAHs (Knorke et al., 2009). In addition Wada et al. (2003) have discussed the possible role of 13C isotopic substitution. Blind spectral decomposition studies indicate that a contribution to the red wing of ‘11.2m’ emission arises in carriers well removed from the exciting star in e.g. NGC 7023; this emission has been ascribed to ‘Very Small Grains’ (VSGs) (Rapacioli et al., 2006; Berné et al., 2007; Rosenberg et al., 2011, 2012).
The shapes of the AIBs have been modelled (Schutte, Tielens & Allamandola, 1993; Cook & Saykally, 1998; Verstraete et al., 2001; Pathak & Rastogi, 2008); the most detailed study of the 11.2m band is that of Pech, Joblin & Boissel (2002) and includes both intermode anharmonicity (which from laboratory measurements of Joblin et al. (1995) allows the effect of cooling on emission wavelength and linewidth to be estimated), and intramode anharmonicity which is a contribution from vibrational transitions of the type with 2. A mass distribution for the PAHs was included of the form where is the number of carbon atoms. This affects the response of the PAHs to optical excitation and their subsequent cooling. However, in considering molecular diversity, it was assumed that all PAHs contributing to the 11.2m band profile had exactly the same infrared active mode frequency. It was deduced that the asymmetric profile appeared to be characteristic of the anharmonicity of molecular modes, and that including a spread of frequencies according to molecular size and geometry would lead to a change in overall band shape and consequent difficulty in achieving a good fit to the observed band. This contrasts with the work reported here where we find that the dependence of the vibrational transition frequencies on the masses of the 11.2m carriers and their relative abundance are key factors in determining the overall 11.2m band profile and its variation between objects.
3 DFT Calculations
3.1 Theoretical Approach
A large number of DFT calculations of PAH vibrational frequencies have been reported. Attention has generally been focused on neutral and singly ionised (i.e. radical cation) PAH molecules, with extension to hydrogenated, protonated, irregular and other closed-shell charged PAHs (Hudgins, Bauschlicher & Allamandola, 2001; Beegle, Wdowiak & Harrison, 2001; Pathak & Rastogi, 2005, 2006; Bauschlicher, Peeters & Allamandola, 2008, 2009; Bauschlicher et al., 2010; Ricks, Douberly & Duncan, 2009; Hammonds, Candian & Sarre, 2011; Ricca, Bauschlicher & Allamandola, 2011; Ricca et al., 2012; Boersma et al., 2014; Candian, Sarre & Tielens, 2014). The work reported here is in two closely related parts:
First, we report the results of DFT calculations on a set of medium-sized PAHs, inspired in part by the work of Pathak & Rastogi (2005) on a series of acenes up to heptacene (see their fig. 7 which shows convergence of the solo OOP wavelength at high mass). We have undertaken a systematic investigation to explore how the frequency and intensity of the out-of-plane (OOP) bending solo modes of neutral PAHs vary with PAH size and shape. The calculations were performed using Q–Chem (Shao et al., 2006) with the B3LYP functional (Becke, 1993; Stephens et al., 1994) and the 6–31G* basis set. Secondly, DFT calculations were carried out for selected highly symmetric compact large solo-containing PAHs and these results applied in the full spectral profile modelling. Gas-phase laboratory data were used to obtain mode-specific vibrational scaling factors.
| Molecule | Wavenumber | Wavelength | Intensity | |
|---|---|---|---|---|
| (cm-1) | (m) | (km mol-1) | ||
| (a) | ||||
| (3,1) | C14H10 | 876.7 | 11.410 | 55.0 |
| (4,1) | C18H12 | 895.3 | 11.169 | 69.3 |
| (5,1) | C22H14 | 901.7 | 11.090 | 87.8 |
| (6,1) | C26H16 | 905.7 | 11.041 | 106.7 |
| (7,1) | C30H18 | 906.6 | 11.030 | 124.8 |
| (8,1) | C34H20 | 906.6 | 11.030 | 146.2 |
| (3,2) | C22H12 | 875.2 | 11.426 | 96.9 |
| (4,2) | C28H14 | 881.8 | 11.340 | 109.3 |
| (5,2) | C34H16 | 886.5 | 11.280 | 123.4 |
| (6,2) | C40H18 | 888.1 | 11.300 | 133.7 |
| (7,2) | C46H20 | 888.1 | 11.300 | 172.0 |
| (3,3) | C32H14 | 884.2 | 11.310 | 123.0 |
| (4,3) | C40H16 | 890.5 | 11.230 | 155.4 |
| (5,3) | C48H18 | 891.3 | 11.220 | 185.0 |
| (6,3) | C56H20 | 891.3 | 11.220 | 204.6 |
| (7,3) | C64H22 | 891.3 | 11.220 | 231.8 |
| (b) | ||||
| C32H14 | 877.0 | 11.403 | 120.3 | |
| C42H16 | 882.2 | 11.328 | 154.3 | |
| C54H18 | 885.0 | 11.300 | 190.6 | |
| C66H20 | 887.9 | 11.262 | 203.61 | |
| C80H22 | 889.3 | 11.245 | 234.31 | |
| C96H24 | 891.1 | 11.222 | 265.16 |
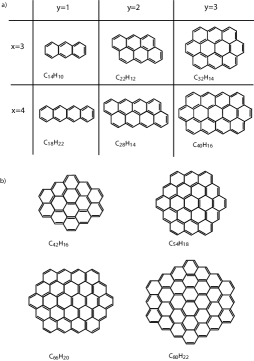
In the first part of the study PAH structures are labelled (, ) where is the number of 6-membered rings in a row and is the number of rows. Examples include anthracene (C14H10) for which = 3 and = 1 and anthanthrene (C22H12) for which = 3 and = 2 (see Fig. 3(a) and Tab. 1(a)). Vibrational frequencies computed in DFT calculations are systematically high and a scaling factor is often invoked to bring calculation and experiment into agreement. Here a scaling factor for the specific solo OOP mode was employed. For = 1, 2 and 3 PAHs a scaling factor of 0.987 was adopted in the modelling, determined by comparing the high-resolution gas-phase experimental value for anthracene of 876.7 cm-1 (Cané et al., 1997) with the unscaled DFT result of 888.2 cm-1.
The second part of our study focussed on large compact PAHs (see Fig. 3(b) and Tab. 1(b)). These molecules were chosen to investigate whether the OOP frequency shares a similar mass-dependent behaviour as for low-medium mass PAHs. The 11.2m band is generally attributed to large neutral PAHs (Hony et al., 2001; Bauschlicher, Peeters & Allamandola, 2008; Ricca et al., 2012), their compactness and high symmetry making them optimal candidates to survive in harsh astronomical environments. The study was again undertaken with B3LYP/6-31G*, using Gaussian 03 (Frisch et al., 2004). A scaling factor of 0.975 was used for these molecules, deduced by reference to the experimental gas-phase data for the solo OOP bending mode of ovalene (C32H14) (Joblin et al., 1994).
The use of a scaling factor is normal practice when comparing laboratory and DFT results. Typically, a scaling factor of 0.958 for B3LYP/4-31G is used for simplicity for the entire spectrum, based on comparison with matrix-isolation data. However, it is known that this technique introduces unpredictable shifts in the band positions (Langhoff, 1996). In contrast to previous studies, the scaling factor employed in this work is referenced to gas-phase data and is specific to the vibrational mode (solo OOP transitions of PAHs). For our analysis, this is preferable to the use of a generic scaling factor. At the present time there is insufficient laboratory gas-phase data on a range of PAHs to evaluate the applicability of the same scaling factor for all PAHs. However, the use of the well characterised B3LYP/6-31G* and the mode-specific scaling factor should reduce the uncertainty significantly.
3.2 Results & Discussion
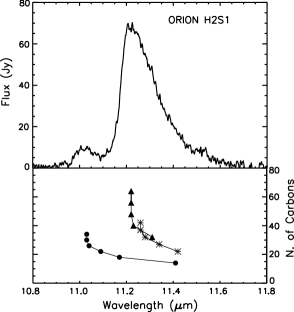
Tab. 1 collects together the computed intensities and unscaled vibrational wavenumbers of the studied molecules. Fig. 4 shows that for the acenes (, ) the wavelength decreases with increase in (or number of carbon atoms), converging towards a high-mass asymptotic value of 11.03m. A similar characteristic holds for zig-zag edge molecules with two rows (stars) and three rows (filled triangles), but they reach the high-mass limiting value at longer wavelength (Fig. 4, lower panel). In all cases, the wavelength for the solo OOP bending mode moves to shorter wavelength as the number of carbon atoms (i.e. the mass) increases (see Tab. 1 (a) and (b)). A similar dependence of the CH OOP frequency on PAH mass is found in the computed data of Bauschlicher, Peeters & Allamandola (2008) who used the B3LYP functional and a (smaller) 4-31G basis set; the values for C54H18 and C96H24 are 11.061 and 10.959m, respectively.
Larger PAH molecules with are needed to determine the value at the asymptotic limit but this was beyond our computational capacity. Hence a functional form was used to fit the available data (once scaled) from Tab. 1(b) and so deduce the asymptotic wavelength limit for the largest PAHs: , where is the mode wavenumber and the number of carbon atoms. The parameters of the best fitting are and the asymptotic value m (or cm-1). Thus, the inferred asymptotic limit for large PAHs falls to shorter wavelength compared with low-medium mass PAHs, i.e. PAHs with multiple rows with = 2 and 3 as shown in Fig. 3(a). The value of 11.21m falls within the range of peak wavelengths (11.20 to 11.24m) in class A11.2 objects (van Diedenhoven et al., 2004) and falls very close to the observed value of of 11.171 m discussed in Section 2.2(a).
Key results from these calculations are a) the more extended (acene) and larger PAH molecules have solo out-of-plane modes at the shortest wavelengths, b) the transition wavelengths for acenes and for large PAHs reach asymptotic values at high mass, c) increasing the number of rows (larger PAHs) results in a faster approach to the asymptotic limit than for the single-row acenes, d) the higher-mass acenes may contribute to 11.0m emission. The presence of a high-mass asymptote for the wavelength of the largest PAHs provides an attractive explanation for the steepness and wavelength invariance of the short-wavelength side () among class A11.2 objects. In the following sections we explore this further using a detailed theoretical model.
4 Emission Model
In this section we describe how the DFT results for frequencies and intensities are incorporated into a model for the AIB emission occurring in astrophysical environments. As far as we are aware this is the first attempt to include mass-dependence of the PAH emission wavelength into a model and using, where available, reference to experimental results. We have chosen to employ a model based on the thermal approximation (as employed by e.g. Pech, Joblin & Boissel, 2002; Pathak & Rastogi, 2008).
4.1 Theoretical Approach
Léger, d’Hendecourt & Defourneau (1989) proposed that the thermal approximation can be used to describe the infrared cooling of PAHs where this treatment assumes that a molecule can be considered as a heat bath with an average molecular energy and temperature . Following absorption of a UV photon, a PAH molecule has an internal energy , where is the (initial) peak temperature.
In the harmonic approximation, the internal energy can be written:
where is the wavenumber of the th vibrational mode and is the total number of modes of the molecule. The PAH molecule cools through its various vibrational modes, through a so-called radiative cascade. For the th mode the emission rate is given by:
where the Einstein coefficients for spontaneous emission can be calculated from the DFT transition intensities (Cook & Saykally, 1998).
The fractional energy emitted in the th mode, corresponding to a fall in internal energy , is:
The total emitted energy is obtained by integration over the temperature range from to 50 , and weighted by the rate of photon absorption
where is the frequency of the absorbed photon, is the frequency-dependent photo-absorption cross-section and 13.6 eV represents the high-energy cut-off in the radiation field. For each molecule was taken from the French-Italian database111http://astrochemistry.oa-cagliari.inaf.it/database. (Malloci, Joblin & Mulas, 2007). For a molecule (PAH1) for which there was no entry, the cross-section was estimated using data available for the molecule closest in size (PAH2), scaled by (Mulas et al., 2006). The excitation source is represented by a diluted Planck function (see Tab. 2). At high photon energy, photoionisation of the neutral PAH can also be significant and leads to a reduction in the quantum yield for IR emission. To take this process into account, we incorporated in our modelling the energy-dependent photo-yield using the empirical law given by Le Page, Snow & Bierbaum (2001) and ionisation energies (IE) from the French-Italian database. When experimental values were not available, a theoretical vertical IE was used.
4.2 Experimental input
Joblin et al. 1995 studied the influence of temperature on IR absorption spectra of gas-phase PAHs in the laboratory and found a linear dependence on temperature for both band position and band width, arising mostly from anharmonic coupling between modes. The following relations for the frequency , and width , were used in the modelling:
| (1) |
and
| (2) |
where can be considered to be an empirical red-shift (RS) between the calculated DFT frequency (at zero Kelvin) and the frequency , at zero Kelvin inferred from the experimental (laboratory) studies (Cook & Saykally, 1998). Tab. 3 collects the coefficients for the solo out-of-plane mode. We consider ovalene and anthracene to be representative of large and small (acene) PAH molecules, respectively. In the case of ovalene, was derived after removing the rotational contribution (see Fig. 8 of Pech, Joblin & Boissel 2002). For a molecule such as ovalene and based on experiments in absorption, it is expected that the emission will move to longer wavelength (lower ) as the cooling cascade occurs, and that the linewidth will increase.
| Large† | Acenes‡ | |
|---|---|---|
| (cm-1/T) | -0.0114 | -0.0065 |
| (cm-1) | -12.91 | -9.54 |
| (cm-1/T) | 0.0157 | – |
| (cm-1) | 0.54 | – |
Note: †Measurements on neutral gas-phase ovalene in the 550-820 K range and in a Ne matrix at 4 K (Joblin et al., 1994, 1995; Pech, Joblin & Boissel, 2002).
‡ Measurements on neutral gas-phase anthracene (Semmler, Yang & Crawford, 1991; Califano, 1962; Cané et al., 1997) and in an Ar matrix at 10 K (Hudgins & Sandford, 1998). No information is available on the temperature dependence of the linewidth; a value for anthracene in the gas phase (at 370 K) is known (Cané et al., 1997).
4.3 Single molecule calculation: influence of temperature?
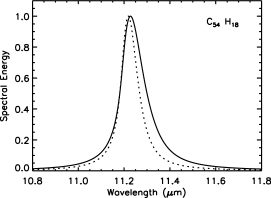
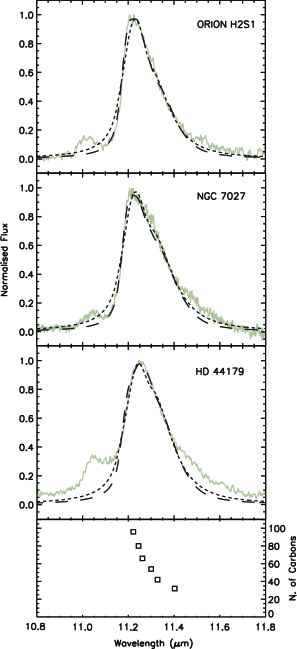
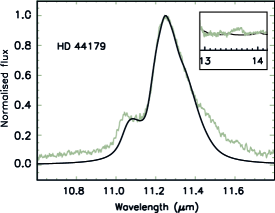
We consider here the emission profile resulting from the cooling cascade for a single PAH molecule, circumcoronene (C54H18, Fig.3 b), in radiation fields with Teff= 8,250 K and 160,000 K corresponding to HD 44179 and NGC 7027, respectively. The results are given in Fig. 5 and show that (a) the peak wavelength is red-shifted and (b) the redward side extends to longer wavelength for a PAH with a high initial internal temperature (i.e. irradiation as in NGC 7027). However, this is not in agreement with observation. The observed peak wavelength in NGC 7027 is lower and the red wing is no more extended than in HD 44179 (see Fig. 6). We also remark that a red tail originating from ‘hot-band’ emission from higher vibrational levels is difficult to reconcile with the presence of Class A11.2 features (with a low tail-to-top ratio) in many compact and extended H ii regions (van Diedenhoven et al., 2004).
We conclude that a factor other than the radiation temperature is responsible for the change in 11.2m profile between objects and, given the DFT results of Section 3., propose that the dependence of the emission wavelength on PAH mass is the largest single factor in determining the differences in the 11.2m profiles between objects. This is now explored through modelling of astronomical emission profiles which includes the wavelength dependence on PAH mass.
4.4 Summary of calculations
The procedure to calculate the energy E(T) emitted in a band is described in Sec. 4.1. Each E(T) is then associated with a Lorentzian profile so that the total energy emitted in the solo out-of-plane bending mode is described by:
where is the FWHM, is a multiplicative coefficient and is summed over the molecules considered. This calculation is then weighted by and a minimisation routine employed to determine the best fit to the astronomical ISO spectra of the three sources - Orion H2S1, NGC 7027 and HD 44179 (see Tab. 2) - with the smallest possible number of contributing molecules. The only variable in the minimisation is which is the number of molecules of type included in the fitting.
5 Astronomical profile Modelling
In this section we describe the results of modelling the 11.2m band for three profile classes: (A11.2, A(B)11.2 and B11.2). It was found that only four very symmetrical solo-containing molecules (C32H14, C42H16, C54H18 and C66H20, Tab.1 b) were needed to produce acceptable fits, the sole variable in the 2 optimisation being the relative proportions of these PAHs () which are taken to be representative of the PAH mass distribution. However, we emphasise that this does not represent identification of these particular four PAHs; rather the results show that solo-containing neutral PAHs in this absolute and relative size range provide a good fit to the 11.2m feature and its profile variation with object. This aspect is discussed further in Section 6.1. Two closely related models were developed.
5.1 Model 1: 11.2m modelling using temperature-dependent linewidths
In the first application of the above approach ( short-dashed line in Fig. 6), the experimentally-based temperature-dependence for the band frequency and width (Eq. 1. and 2. respectively - see Section 4.2) for ovalene were taken to hold for the larger molecules in the set (i.e. independent of PAH mass). However, as each molecule has a different initial peak temperature (determined by the stellar SED) and a different vibrational solo-OOP frequency according to molecular size, the cooling cascade and resultant emission profile necessarily differs in each case. A minimisation was undertaken with the only variable being the relative adundance of the four PAHs. This model provides a reasonable match with the peak wavelength and long-wavelength tails of the bands, but it does not account very well for the steep short-wavelength side seen in many astronomical spectra including Orion H2S1 and NGC 7027. This discrepancy falls in the part of the profile where high-mass PAHs are expected to contribute most strongly and lies near to the asymptotic limit discussed in Section 3.2.
Considering the experimental observations for the widths of the infrared active C–H stretch transitions in naphthalene, pyrene and coronene222Ovalene was not considered because the law was deduced from only two experimental points. (Equation 2), then for a given temperature the width of the band is found to decrease with increase in PAH mass (see Tab. 2 and Fig. 4 in Joblin et al., 1995); for example at 600 K the linewidth values for naphthalene, pyrene and coronene are 40, 26 and 15 cm-1, respectively. The solo-OOP transition linewidth behaves similarly; at 370 K the experimental solo-OOP linewidths in absorption for anthracene (Cané et al., 1997) and ovalene (Joblin, C., personal communication) are 25 cm-1 and 6 cm-1, respectively. Additionally, as higher mass PAHs do not reach as high an internal temperature – for the same exciting SED, high-mass PAHs have narrower absorption (and emission) band widths than their lower mass counterparts. This aspect is addressed in Model 2.
5.2 Model 2: molecule-dependent temperature-independent linewidths
Assuming that a Lorentzian profile describes the short wavelength side of the 11.2m band for Class A11.2 and A(B)11.2 objects, then from profile fitting of the short-wavelength part of the profile we obtain a Lorentzian peak wavelength of 11.198m (or 893.02 cm-1) and a FWHM of only 0.05m (or 4 cm-1). This FWHM represents the upper limit on the width of a single contribution to the shorter wavelength side of the 11.2m band. A similar value has been suggested by Cami (2011). Using this information, Fig. 6 shows the best minimised fit with constrained FWHM values of 10, 7.5, 5 and 4 cm-1 for C32H14, C42H16, C54H18 and C66H20, respectively. The value of 10 cm-1 was taken for ovalene with reference to the laboratory absorption data (at 600 K) and the 4 cm-1 value as constrained by the observational data (see above and Section 5.1). The fit to the steep short-wavelength side of the 11.2m band for the class A11.2 and A(B)11.2 objects is improved, while the long-wavelength tail does not change significantly. Thus an accurate description of the shorter wavelength side of the 11.2m band requires lower linewidths than experimentally found for the FWHM of e.g. ovalene. We also note the Red Rectangle, and in part NGC 7027, has a discrepancy in the 11.45-11.65m region in both models. We return to this in Section 6.2.
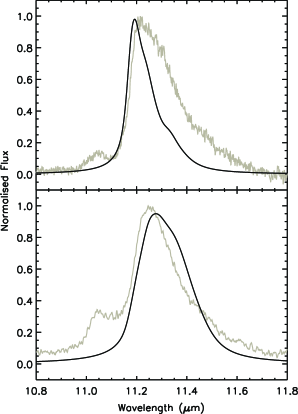
5.3 Effect of SED on computed 11.2m profiles
In section 4.3 it was shown that for a single PAH molecule, C54H18, the calculated emission profile with a low Teff SED is narrower than for higher Teff. To explore the effect of the excitation SED on computed 11.2m profiles, we have taken the (fixed) mass distribution which was determined for NGC 7027 using the SED for NGC 7027, and calculated the profile using a lower Teff SED - that of the Red Rectangle. The calculated result in Figure 7. (upper panel, full line) is qualitatively similar to the single-molecule calculation and gives a very poor match to the astronomical spectrum for NGC 7027 when compared with Figure 6. middle panel, Model 2. Similarly, taking the (fixed) mass distribution as deduced for the Red Rectangle, using a high-temperature SED (that of NGC 7027) also yields a poor match (Figure 7. lower panel, full line). Clearly the SED used in the calculation plays a role in determining a computed 11.2m profile but the SED is fixed for a given object and the observed profile is determined principally by the solo-containing PAH mass distribution.
6 Analysis and Discussion
6.1 PAH mass distribution and the 11.2m profile
Taking the sum of the contributions of the two lower mass PAHs (C32H14 and C42H16) to the 11.2m band fit in Model 2, and similarly taking C54H18 and C66H20 as representative of higher mass PAHs, an indicative low mass:high mass abundance ratio can be determined with the break falling at N50. Using the fitted results, this ratio is 1.8:1 for Orion H2S1, 2.4:1 for NGC 7027 and 3.7:1 for the Red Rectangle. From this we infer that the Red Rectangle PAH population comprises lower mass PAHs than for NGC 7027 and Orion H2S1. We deduce that the shape and peak wavelength of the 11.2m feature can be described principally in terms of the PAH mass distribution, where high-mass PAHs are responsible for the steep short wavelength side. The low variance of and the steep blue side in A11.2 objects arise as a natural consequence of the asymptotic limit reached by the solo OOP mode in high-mass PAHs. In class B11.2 objects such as the Red Rectangle, the less steep short-wavelength side, the more extended redward tail and a band maximum at longer wavelength suggests that the PAH mass distribution is skewed towards lower masses than in class A11.2 objects. The class A(B)11.2 object NGC 7027 then falls between the class A and B extremes with a broad spread of PAH masses as suggested by the intermediate value of the mass distribution indicator introduced above. Using Spitzer observations of NGC 7023, Boersma, Bregman & Allamandola (2013) fitted the PAH emission spectra as a function of offset from the star HD 200775 using the NASA Ames PAH IR Spectroscopic Database (PAHdb) (Bauschlicher et al., 2010). The shape of the 11.2m feature evolves from class A11.2 relatively near the star (c. 20′′ offset) towards B11.2 as a denser region is approached at higher offset. It was concluded that the overall PAH spectra result from approximately equal proportions of large and small PAHs at Position I (a dense region) with larger PAHs being more prominent in the diffuse region (Position II). Our interpretation of the 11.2m band shape is consistent with these results, though our approach differs in that our inferred mass distributions hold specifically for neutral solo-containing PAHs.
6.2 Emission in the 11.4-11.7m region
The Red Rectangle and to a lesser extent Orion H2S1 and NGC 7027, have excess emission relative to the models in the 11.4-11.7m wavelength region. Based on the results of DFT calculations and the gas-phase experimental OOP value for anthracene of 11.4m (at 373 K, see Fig.6), it is suggested the excess in the Red Rectangle is due to emission from relatively low-mass PAHs which were not included in the modelling of the 11.2m feature presented here. The scaled DFT out-of-plane bending modes for anthracene C14H10 (; ) and anthanthrene C22H12 (; ) fall at 11.4m. This too is consistent with a PAH population of lower mass for the Red Rectangle deduced separately in section 6.1. Noting the usual redward shift that occurs in emission, these and similar molecules probably contribute to emission in the 11.4-11.7m region.
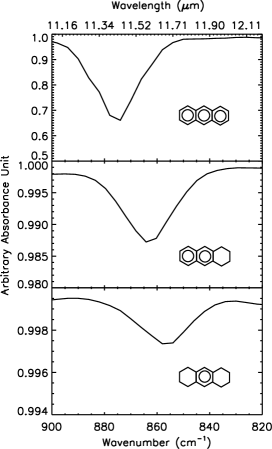
A second possible contribution to the ‘excess’ could arise from hydrogenated PAHs. Addition of hydrogen atoms to PAH molecules (H-PAHs) perturbs the C-H out-of-plane bending mode frequency, thus affecting the peak position. Fig. 8 shows gas-phase absorption spectra in the 11.4m region, recorded at 500 K (NIST MS Data Center / S. E. Stein, 2011) for the closely related molecules: anthracene (C14H10), 1,2,3,4-tetrahydroanthracene (C14H14) and 1,2,3,4,5,6,7,8-octahydroanthracene (C14H18). Starting with anthracene (upper panel), increasing the number of hydrogen atoms (middle and lower panels) moves the peak position for the solo C-H out-of-plane bending mode (Hs in the 9,10 positions) to longer wavelength. In a major study of infrared spectra of hydrogenated PAHs in an argon matrix it was found that aromatic C-H stretching bands near 3.3m weaken and are replaced with stronger aliphatic bands near 3.4m, and that aromatic C-H out-of-plane bending mode bands in the 11-15m region shift and weaken (Sandford, Bernstein & Materese, 2013). However, very few PAHs in the sample set had solo-hydrogens. We tentatively suggest that a signal identified by Rosenberg et al. (2011) could be due to solo-containing hydrogenated PAH molecules rather than ‘Very Small Grains’ - VSGs (see their Fig. 6); further assessment of this will be described elsewhere. Significantly, objects classified as A(B)11.2 and B11.2, show aliphatic bands at 3.4 and 3.52m (Geballe et al., 1985) as would be expected to appear when PAH hydrogenation levels are high; these bands appear in the experimental spectra of hydrogenated anthracene, but emission in the 6-9m region remains weak as for other neutral PAHs.
6.3 The 11-15m and wider spectral region
The molecules considered here give a strong contribution to the UIR bands in the 11-15m range (Schutte, Tielens & Allamandola, 1993). Fig. 9 shows the fingerprint region for the three prototype objects compared with the emission model results. Due to the lack of T-dependent experimental data for the position of and width of the bands in the fingerprint region, a single scaling factor of 0.979 and a fixed FWHM of 12 cm-1 were applied for all bands. To combine the fit for the 11.0-11.2m band region and the remaining bands in the fingerprint region, we assumed that the molecular contribution for the solo mode in a PAH can be modelled as a Lorentzian function peaking at the scaled (sf) DFT frequency but with a FWHM of 10 cm-1. The predictions for the bands in the fingerprint region are consistent with the astronomical spectra of the three objects, with no more than a small contribution to the 12.7m feature. The model slightly overestimates the flux of the 12.0m band for the Red Rectangle, which is generally ascribed to duo hydrogen modes (Hony et al., 2001). However, in SWS-ISO data, the region around 12m is sensitive to the way spectra are combined, thus introducing extra uncertainty of 20-30 percent (Hony et al., 2001). A further issue is placement of the continuum in the subtraction applied to the spectra. The lack of a detailed treatment of anharmonicity (temperature dependence) may also affect this modelled spectrum. It is notable that the model built on treatment of the 11.2m region does not introduce features which are not present in astrophysical spectra of the 11-15m region; this is also the case for the 6-11m region. For example, the strongest calculated vibration of C54H18 in the 6-9m region has a strength of 50 km mol-1 (Candian, 2012) compared with 191 km mol-1 for the solo OOP mode, i.e. an intensity ratio of 0.3. The effect of the radiative cascade during the PAH emission will reduce this ratio even more. Also, the 6-9m region is generally attributed to ionised PAHs, which show very strong C-C and C-H in plane stretching modes, compared to their neutral counterparts (Hudgins & Allamandola, 1999). As for the 3.3m band, it is known that DFT calculations overestimate the intensity of the C-H stretching modes (Langhoff, 1996), making it difficult to directly compare our model with the astronomical spectra.
6.4 Emission in the 11.0m region
6.4.1 Emission in the 11.0m region - a summary
Given the proximity of 11.0 m emission to the 11.2 m band, we review here whether there is significant evidence for a related origin. Roche, Aitken & Smith (1991) first identified a faint feature on the short-wavelength side of the 11.2 m band which appears quite prominently in spectra of a number of objects (Hony et al., 2001). The most commonly occurring band has an approximately symmetric shape centered at 11.05 m, a rather narrow FWHM of 0.1 m and an intensity which ranges between 2 and 10% of the 11.2 m feature. In a few cases a somewhat higher 11.0/11.2 ratio is found: two Herbig Ae/Be stars, MWC 1080 (Sakon et al., 2007) and HD 37411(Boersma et al., 2008), in the H ii region IRAS 18434-0242 (Roelfsema et al., 1996) and in two reflection nebulae, NGC 1333 SVS3 (Sloan et al., 1999) and NGC 7023 (Werner et al., 2004b; Boersma, Bregman & Allamandola, 2013).
Emission features in the 11.0m region have been described as ‘blue outliers’ of the 11.2 m band by Sloan et al. (1999). On increasing distance from the hot star SVS3 it was found that a shorter wavelength part at 10.8 m disappeared first, whereas 11.0 m emission was more persistent. Using the results of theoretical calculations by Langhoff (1996), Sloan et al. (1999) considered whether the ‘11.0 m’ emission might be due to neutral acenes, such as anthracene or pentacene, but following comparison with IR matrix data they concluded that this was unlikely and PAH cations were preferred as carriers. Hudgins & Allamandola (1999) discussed this in some detail and extended consideration across the 11-14 m region. The idea of a cationic origin gained support from DFT calculations on large solo-containing PAHs (Bauschlicher, Peeters & Allamandola, 2008; Ricca et al., 2012) where the (scaled) solo wavelengths for the cations were found to fall to wavelengths shorter than that for neutrals. Werner et al. (2004b) and Sakon et al. (2007) found that the c. 11.0 m emission reduces in intensity moving away from the exciting star in NGC 7023 and MWC 1080, respectively, a result for NGC 7023 recently reinforced by Spitzer observations (Boersma, Bregman & Allamandola, 2013).
The most commonly discussed carrier of the c. 11.0 m emission carrier is PAH cations. However, Povich et al. (2007) observed a lack of variation in the shape and/or intensity of the 11.0 m band in the photodissociation region M17-SW, even where the level of the ionisation in the gas varied with position. Moreover, in recent work on the evolution of the 11.2 m and 11.0 m features SE of the Orion Bright Bar (Boersma, Rubin & Allamandola, 2012), the integrated strength of the main 11.2 m feature dropped by a factor of 5.7 between 2’.6 and 5’.7 whereas the 11.0m feature dropped by a factor of 2.7. This result was described as ‘counterintuitive’ in terms of the 11.0m emission being due to PAH cations but rationalised as being influenced by the degree of hydrogenation. In a recent Spitzer study of the mid-infrared structure of the massive star-formation region W49A further puzzles have emerged; the 11.0/11.2 ratio is found to be constant across the whole region and with a very low value of 0.01 (Stock et al., 2014). The ratio is more commonly in the range 0.02-0.2 as discussed by Stock et al. (2014). In a recent study fitting the spectrum of NGC 7023 with the NASA AMES PAH database, Boersma, Bregman & Allamandola (2013) noted that the 11.0 m band could be reproduced by ionised nitrogen-containing PAHs. In summary there are many questions as to the origin(s) of feature(s) in the 11.0 m region.
6.4.2 Red Rectangle emission in the 11.0m region
It was inferred earlier that the Red Rectangle has a population of lower-mass PAHs than for Orion H2S1 and NGC 7027 (Section 6.1), so it is of interest to explore whether low-mass PAHs including acenes might contribute to the 11.0m region in this object. It is notable that DFT calculations predict an asymptotic wavelength for the longer acenes which falls at a shorter wavelength than the 11.2 m band (Section 3.2). We have conducted a Model 2-type calculation including acenes which yields the result shown in Fig. 10. The fit to the 11.0m region is improved and the 11.2m profile is not affected, suggesting that, at least for this object, the acene series may make a significant contribution to 11.0m emission. The lack of a very good fit between the 11.0m feature and larger acenes may be due to the underestimation of the frequency of the OOP solo mode transition for these molecules. We are exploring this further by undertaking DFT calculations which include anharmonicity explicitly.
The IR vibrational spectrum of neutral, long acenes is dominated by strong C-H oop modes (solo and quarto) (Pathak & Rastogi, 2005). We therefore checked the contribution of the acene quarto modes by modelling them (Model 2) and compared the result with the emission in the Red Rectangle (Fig.10, small insert). Clearly, the prediction is consistent with the astronomical spectrum. The overall result that the Red Rectangle has a population of relatively low mass PAHs may be of significance in determining the origin of the strong unidentified optical emission bands seen in this object (Warren-Smith et al., 1981).
7 Conclusions
Based on the results of DFT calculations, we created a detailed emission model and applied it to a small set of PAH molecules with the aim of understanding profile and profile variations in the 11.2m band.
The model shows that the 11.2m feature, regardless of the A/B classification, can be fitted by a mass distribution of a few, large neutral PAHs containing solo hydrogens. We infer that the mass distribution is principally responsible for the red tail of the feature and the steep short-wavelength side, and hence offers a good explanation for the 11.2m band asymmetry and its variation between and within objects. In this picture, large neutral solo-containing PAHs dominate class A11.2 objects and smaller PAHs class B11.2 objects, whereas class A(B)11.2 possesses a more even mass distribution. We also note that a PAH mass range of 30-70 carbon atoms compares favourably with the masses of fullerenes, recently discovered in several objects (e.g. Cami et al. 2010; Sellgren et al. 2010). The present model gives a more detailed description of the different physical effects (anharmonicity, photo-ionisation and astronomical environment) involved in building up the feature.
In this paper we described the results of a detailed emission model applied to the solo mode in PAHs and compared them to astronomical data. Based on the results we find that the profile of the 11.2m band and its variation are well described principally in terms of the mass distribution of neutral solo-containing PAHs.
Acknowledgments
We thank Dr. Amit Pathak for useful discussions, Dr. Christine Joblin for unpublished information on the temperature dependence of the ovalene spectrum, and Dr. Jesse Bregman for very helpful comments. AC acknowledges STFC for a studentship and The University of Nottingham and the Royal Astronomical Society for financial support. PJS thanks the Leverhulme Trust for award of a Research Fellowship and the Leiden Observatory for hospitality that allowed completion of this work. All quantum chemical calculations were performed using the University of Nottingham High Performance Computing Facility. ISO is an ESA project with instruments funded by ESA Member States (especially the PI countries: France, Germany, The Netherlands, and the UK) and with the participation of ISAS and NASA.
References
- Barker, Allamandola & Tielens (1987) Barker J.R., Allamandola L.J., Tielens A.G.G.M., 1987, ApJL, 315, L61
- Bauschlicher, Peeters & Allamandola (2008) Bauschlicher C.W., Peeters E., Allamandola L.J., 2008, ApJ, 678, 316
- Bauschlicher, Peeters & Allamandola (2009) Bauschlicher C.W., Peeters E., Allamandola L.J., 2009, ApJ, 697, 311
- Bauschlicher et al. (2010) Bauschlicher C.W., et al. 2010, ApJ, 189, 341
- Becke (1993) Becke A.D., 1993, J.Chem.Phys., 98, 5648
- Beegle, Wdowiak & Harrison (2001) Beegle L.W., Wdowiak T.J., Harrison J.G., 2001, Spectroc. Acta A, 57, 737
- Beintema et al. (1996) Beintema D.A. et al., 1996, A&A, 315, L369
- Berné et al. (2007) Berné O. et al., 2007, A&A, 469, 575
- Boersma et al. (2008) Boersma C,. Bouwman J., Lahuis F., van Kerckhoven C., Tielens A.G.G.M., Waters L.B.F.M., Henning T., 2008, A&A, 484, 241
- Boersma, Rubin & Allamandola (2012) Boersma C., Rubin R.H., Allamandola L.J., 2012, ApJ, 753, 168
- Boersma, Bregman & Allamandola (2013) Boersma, C., Bregman, J.D., Allamandola, L. J., 2013, ApJ, 769, 117
- Boersma et al. (2014) Boersma, C., Bauschlicher, C.W., Jr., Ricca, A., et al., 2014, ApJS, 211, 8
- Bujarrabal et al. (2001) Bujarrabal V., Castro-Carrizo A., Alcolea J., Sánchez Contreras C., 2001, A&A, 377, 868
- Califano (1962) Califano S., J.Chem.Phys., 36, 903
- Cami et al. (2010) Cami J., Bernard-Salas J., Peeters E., Malek S.E., 2010, Sci., 329, 1180
- Cami (2011) Cami J., 2011, in PAHs and the Universe, C. Joblin and A.G.G.M Tielens Eds, EAS Publications Series vol. 46, 117
- Candian (2012) Candian, A., 2012, PhD Thesis, University of Nottingham (UK),
- Candian et al. (2012) Candian, A., Kerr, T. H., Song, I.-O., McCombie, J., & Sarre, P. J., 2012, MNRAS, 426, 389
- Candian, Sarre & Tielens (2014) Candian, A., Sarre P. J. & Tielens, A.G.G.M, 2014, ApJ, 791, L10
- Cané et al. (1997) Cané E., Miani A., Palmieri P., Tarroni R., Trombetti A., 1997, J.Chem.Phys., 106, 9004
- Cook & Saykally (1998) Cook D.J., Saykally R.J., 1998b, ApJ. 493, 793
- Frisch et al. (2004) Frisch M.J. et al., 2004, Gaussian 03, Revision D.01
- Geballe et al. (1985) Geballe T.R., Lacy J.H., Persson S.E., McGregor P.J., Soifer B.T., 1985, ApJ, 292, 500
- Gillett, Forrest & Merrill (1973) Gillett F.C., Forrest W.J., Merrill K.M., 1973, ApJ, 183, 87
- de Graauw et al. (1996) de Grauuw T et al.,1996, A&A, 315, L49
- Hammonds, Candian & Sarre (2011) Hammonds M., Candian A., Sarre, P.J., 2011, in PAHs and the Universe, C. Joblin and A.G.G.M Tielens Eds, EAS Publications Series vol. 46, 191
- Hony et al. (2001) Hony S., Van Kerckhoven C., Peeters E., Tielens A.G.G.M., Hudgins D.M., Allamandola L.J., A&A, 370, 1030
- Hudgins & Sandford (1998) Hudgins D.M., Sandford S.A., 1998, J.Phys.Chem. A, 102, 329
- Hudgins & Allamandola (1999) Hudgins D.M., Allamndola L.J., 1999, ApJL, 516, L41
- Hudgins, Bauschlicher & Allamandola (2001) Hudgins, D.M., Bauschlicher, C.W., Jr., & Allamandola, L.J., 2001, Spectrochimica Acta, 57, 907
- Joblin et al. (1994) Joblin C., d’Hendecourt L., Léger A., Défourneau D., 1994, A&A, 281, 923
- Joblin et al. (1995) Joblin C., Boissel P., Léger A., d’Hendecourt L., Défourneau D., 1995, A&A, 299, 835
- Keller et al. (2008) Keller L.D. et al., 2008, ApJ, 684, 411
- Knorke et al. (2009) Knorke H., Langer J., Oomens J., Dopfer O., 2009, ApJL, 706, L66
- Langhoff (1996) Langhoff S., 1996, J.Phys.Chem., 100, 2819
- Léger, d’Hendecourt & Defourneau (1989) Léger A., d’Hendecourt L., Defourneau D.,1989, A&A, 216, 148
- Le Page, Snow & Bierbaum (2001) Le Page V., Snow T.P., Bierbaum V.M., 2001, ApJ, 132, 233
- Le Page, Snow & Bierbaum (2003) Le Page V., Snow T.P., Bierbaum V.M., 2003, ApJ, 584, 316
- Malloci, Joblin & Mulas (2007) Malloci G., Joblin C., Mulas G., 2007, A&A, 332 353
- Matsuura et al. (2014) Matsuura, M., Bernard-Salas, J., Lloyd Evans, T., et al., 2014, MNRAS, 439, 1472
- Men’shchikov et al. (2002) Men’shchikov A.B., Schertl D., Tuthill P.G., Weigelt G., Yungelson L.R., 2002, A&A, 393, 867
- Mulas et al. (2006) Mulas G., Malloci G., Joblin C., Toublanc D., 2006, A&A, 446, 537
- Murakami et al. (2007) Murakami H. et al., 2007, PASJ, 59, S309
- O’Dell (2001) O’Dell C.R., 2001, ARA&A, 39, 99
- Pathak & Rastogi (2005) Pathak A., Rastogi S., 2005, Chem. Phys., 313, 133
- Pathak & Rastogi (2006) Pathak A., Rastogi S., 2006, Chem. Phys., 326, 315
- Pathak & Rastogi (2008) Pathak A., Rastogi S., 2008, A&A, 485, 735
- Pech, Joblin & Boissel (2002) Pech C., Joblin C., Boissel P., 2002, A&A, 388, 639
- Povich et al. (2007) Povich M. et al., 2007, ApJ, 660, 346
- Rapacioli et al. (2006) Rapacioli M., Calvo F., Joblin C., Parneix P., Toublanc D., Spiegelman F., 2006, A&A,460,519
- Ricca, Bauschlicher & Allamandola (2011) Ricca A., Bauschlicher C.W., Allamandola L.J, 2011. ApJ, 727, 128
- Ricca et al. (2012) Ricca A., Bauschlicher C.W., Boersma C,. Tielens A.G.G.M., Allamandola L.J., 2012, ApJ, 754, 75
- Ricks, Douberly & Duncan (2009) Ricks A.M., Douberly G.E., Duncan M.A., 2009, ApJ, 702, 301
- Roche, Aitken & Smith (1989) Roche P.F,. Aitken D.K., Smith C.H., 1989, MNRAS, 236, 485
- Roche, Aitken & Smith (1991) Roche P.F,. Aitken D.K., Smith C.H., 1991, MNRAS, 252, 282
- Roelfsema et al. (1996) Roelfsema P.R. et al., 1996, A&A, 315, L289
- Rosenberg et al. (2011) Rosenberg M.J.F., Berné O., Boersma C., Allamandola L.J., Tielens A.G.G.M., 2011, A&A, 532, A128
- Rosenberg et al. (2012) Rosenberg M.J.F., Berné O., Boersma C., Allamandola L.J., Tielens A.G.G.M., 2012, A&A, 537, C5
- Sakon et al. (2007) Sakon I., Okamoto Y.K., Kataza H., Onaka T., Kaneda H., Honda M., 2007, Advances in Geosciencies, Anil Bhardwaj et al. Eds, WSPC, vol.7, p.146
- Sandford, Bernstein & Materese (2013) Sandford, S.A., Bernstein, M.P., Materese, C.K., 2013, ApJS, 205, 8
- Schutte, Tielens & Allamandola (1993) Schutte W.A., Tielens A.G.G.M., Allamandola L.J., 1993, ApJ, 415, 397
- Sellgren et al. (2010) Sellgren, K., Werner, M.W., Ingalls, J.G., Smith, J.D.T., Carleton, T.M., Joblin, C., 2010, ApJ, 722, L54
- Semmler, Yang & Crawford (1991) Semmler J., Yang P.W., Crawford G.E., 1991, Vibr. Spec., 2, 189
- Shao et al. (2006) Shao Y. et al., 2006, PCCP, 8, 3172
- Sloan et al. (1999) Sloan G.C., Hayward T.L,. Allamandola L.J., Bregman J.D., Devito B., Hudgins D.M., 1999, ApJL, 513, L65
- Sloan et al. (2007) Sloan G.C. et al., 2007, ApJ, 664, 1144
- NIST MS Data Center / S. E. Stein (2011) NIST MS Data Center / S. E. Stein, 2011, ‘Infrared Spectra’ in NIST Chemistry WebBook, NIST Standard Reference Database Number 69, Eds. P.J. Linstrom and W.G. Mallard, National Institute of Standards and Technology, Gaithersburg MD, 20899, http://webbook.nist.gov, (retrieved August, 2011).
- Stephens et al. (1994) Stephens P.J,. Devlin F.J., Chabalowski C.F,. Frisch M.J., 1994, J.Phys.Chem., 45, 11623
- Stock et al. (2014) Stock, D.J., Peeters, E., Choi, W.D.-Y., Shannon, M.J., 2014, ApJ, 791, 99
- Tielens (2008) Tielens A.G.G.M., 2008, ARA&A, 46, 1, 289 and references therein.
- van Diedenhoven et al. (2004) van Diedenhoven B., Peeters E., Van Kerckhoven C., Hony S., Hudgins D.M., Allamandola L.J., Tielens A.G.G.M., 2004, ApJ, 611, 928
- Verstraete et al. (1996) Verstraete L., Puget J.L., Falgarone E., Drapatz S., Wright C.M., Timmermann R., 1996, A&A, 315, L337
- Verstraete et al. (2001) Verstraete L., Puget J.L., Falgarone E., Drapatz S., Wright C.M., Timmermann R., 2001, A&A, 372, 981
- Wada et al. (2003) Wada S., Onaka T., Yamamura I., Murata Y., Tokunaga A.T., 2003, A&A, 407, 551
- Warren-Smith et al. (1981) Warren-Smith, R. F., Scarrott, S. M., & Murdin, P. 1981, Nat., 292, 317
- Werner et al. (2004a) Werner M.W. et al., 2004a, ApJS, 154, 10
- Werner et al. (2004b) Werner M.W., Uchida K.I,. Sellgren K., Marengo M., Gordon K.D., Morris P.W., Houck J.R., Stansberry J.A., 2004b, ApJS, 154, 309
- Witteborn et al. (1989) Witteborn F.C., Sandford S.A., Bregman J.D., Allamandola L.J., Cohen M., Wooden D.H., Graps A.L., 1989, ApJ, 341, 270
- Zhang, Kwok & Hrivnak (2010) Zhang Y., Kwok S., Hrivnak B.J., 2010, ApJ, 725, 990