Unconventional Strong Spin-Fluctuation Effects around the Critical Pressure of the Itinerant Ising-Type Ferromagnet URhAl
Abstract
Resistivity measurements were performed for the itinerant Ising-type ferromagnet URhAl at temperatures down to 40 mK under high pressure up to 7.5 GPa, using single crystals. We found that the critical pressure of the Curie temperature exists at around 5.2 GPa. Near , the -coefficient of the Fermi-liquid resistivity term below is largely enhanced with a maximum around 5.2-5.5 GPa. Above , the exponent of the resistivity deviates from 2. At , it is close to , which is expected by the theory of three-dimensional ferromagnetic spin fluctuations for a 2nd-order quantum-critical point (QCP). However, disappears as a 1st-order phase transition, and the critical behavior of resistivity in URhAl cannot be explained by the theory of a 2nd-order QCP. The 1st-order nature of the phase transition is weak, and the critical behavior is still dominated by the spin fluctuation at low temperature. With increasing pressure, the non-Fermi-liquid behavior is observed in higher fields. Magnetic field studies point out a ferromagnetic wing structure with a tri-critical point (TCP) at 4.8-4.9 GPa in URhAl. One open possibility is that the switch from the ferromagnetic to the paramagnetic states does not occur simply but an intermediate state arises below the TCP as suggested theoretically recently. Quite generally, if a drastic Fermi-surface change occurs through , the nature of the interaction itself may change and lead to the observed unconventional behavior.
pacs:
71.27.+a, 75.30.Kz, 75.30.Mb, 75.40.-sI Introduction
Since the 1960-1970s, the understanding of dynamic critical phenomena and physical properties of itinerant spin-fluctuation systems has been one of the main topics in the fields of magnetism in condensed matter physics Doniach_PRL_1966 ; Berk_PRL_1966 ; Beal-Monod_PRL_1969 ; Moriya_PRL_1970 ; Moriya_JPSJ_1973 ; Moriya_JPSJ_1995 . This is because these questions lead to understand not only weak itinerant magnetism in - and -electron systems but also recently observed anomalous non-Fermi-liquid (NFL) behaviors and magnetically mediated Cooper instabilities SpinFluctuation_Moriya ; Moriya_RepProgPhys_2003 caused by spin fluctuations near quantum-phase transitions (QPTs).
So far, it was widely believed that both itinerant ferromagnetic (FM) and antiferromagnetic (AF) compounds usually have the quantum-critical points (QCPs), where a 2nd-order phase transition occurs at by tuning some physical parameter, such as pressure, or atomic substitution, etc. The self-consistent-renormalized (SCR) theory by Moriya and his coworkers gives a theoretical base to describe NFL behaviors of itinerant FM and AF metallic systems near QCPs Moriya_JPSJ_1995 ; SpinFluctuation_Moriya ; Moriya_RepProgPhys_2003 . Furthermore, critical phenomena around magnetic QCPs were investigated theoretically using the renormalization-group method by Hertz Hertz_PRB_1976 , and Millis Millis_PRB_1993 . Actually, some itinerant AF compounds obey the Moriya-Hertz-Millis theory for critical behaviors near QCPs Lohneysen_RevModPhys_2007 .
However, for FM quantum criticality, the situation is different. Surprisingly, it has been reported that an almost FM helimagnet, MnSi Pfleiderer_PRB_1997 ; Pfleiderer_Nature_2001 , and several ferromagnets, such as UGe2 Pfleiderer_PRL_2002 ; Taufour_PRL_2010 , and ZrZn2 Uhlarz_PRL_2004 ; Kabeya_JPSJ_2012 , do not show the QCP at zero field but show a 1st-order phase transition when is suppressed by applying pressure. To explain these behaviors, recently specific attentions were given to new quantum treatment for FM QPT; for example, Belitz and Kirkpatrick considered particle-hole excitations from a Fermi surface with a low frequency and a long wavelength (soft mode), which couples to the order parameter Belitz_PRL_1999 ; Belitz_PRL_2005 . They showed that a 2nd-order phase transition at high temperature changes to a 1st-order transition below a tri-critical point (TCP) with 1st-order wing planes, which terminate at zero temperature in a finite magnetic field, i.e. at a quantum-critical-end point (QCEP) Belitz_PRL_1999 ; Belitz_PRL_2005 . Previously, it has also been discussed that the TCP emerges due solely to the thermal spin fluctuations Yamada_PRB_1993 ; Yamada_PhysicaB_2007 and the magneto elastic coupling Mineev_JPhysConfSer_2012 ; Gehring_EurophysLett_2008 .
So far, the quantum criticality around the QCEP with the metamagnetic transition has been classified into the same criticality as the QCP for an Ising-type transition Millis_PRL_2002 . However, there is no symmetry change around a QCEP, whereas the symmetry of the ordered phase is clearly distinguished from the paramagnetic (PM) phase for a QCP. It has recently been pointed out theoretically that the quantum criticality of the metamagnetic transition accompanied with the Fermi-surface change (Lifshitz transition) has another universality class, which differs from other symmetry-breaking phase transitions Yamaji_JPSJ_2007 ; Imada_JPhysC_2010 . Also, as unconventional superconductivity associated with FM order has been discovered only in uranium materials (UGe2 Saxana_Nature_2000 , URhGe Aoki_Nature_2001 , and UCoGe Huy_PRL_2007 ), it is intriguing to study the quantum criticality and the spin-fluctuation effects around the FM QPT for itinerant uranium compounds.
Recently, a FM wing structure and a QCEP have been reported for UCoAl, which shows a 1st-order metamagnetic transition at 0.7 T with a FM moment of 0.3 U at low temperature Andreev_SovPhys_1985 ; Matsuda_JPSJ_1999 ; Aoki_JPSJ_2011 . This compound has a hexagonal ZrNiAl-type structure with space group , in which there is no inversion symmetry. The uranium atoms form a quasi-Kagomé lattice, thus magnetic frustration effects are possibly expected. From high-pressure studies, it is considered that in UCoAl a TCP exists at negative pressure of 0.2 GPa Mushnikov_PRB_1999 , and the metamegnetic transition can be explained by the FM wings Aoki_JPSJ_2011 . Since the TCP in UCoAl is estimated to exist at a negative pressure, it is not observable from hydrostatic-pressure measurements. In order to understand the critical phenomena near the itinerant FM QPTs, further experimental examples are necessary.
In this paper, we report pressure-induced quantum criticality of a itinerant Ising-type FM compound, URhAl, which has the same crystal structure as that of UCoAl. URhAl shows a FM transition at 25-27 K at ambient pressure Veenhuizen_J_de_Physique_1988 ; Javorsky_PRB_2004 ; TristanCombier_Dr_Thesis_2014 , and the FM moment ( 0.9 /U) is strongly Ising-type with the magnetization-easy axis along , similar to the Ising-type metamagnetism in UCoAl. The atomic radius of Rh is larger than that of Co, so the -electronic state in URhAl may correspond to a state in which negative pressure is applied for UCoAl Andreev_JAlloysComp_1999 . Therefore, the high-pressure study of critical behaviors for URhAl can help to understand the metamagnetism in UCoAl as well as the general problem of FM quantum criticality.
II Experimental Procedures
Single crystals of URhAl were grown by the Czochralski pulling method in a tetra-arc furnace. Resistivity measurements under high pressure were performed by using diamond-anvil cells with an in situ pressure-tuning device Salce_RevSciInstrum_2000 ; Demuer_JLTP_2000 . We measured resistivity of samples ( and ) which were less than the size of 200 100 30 m3. The sample geometry did not allow a precise determination of the form factor of resistivity. Therefore, we extrapolated linearly to 0 GPa, and obtained absolute values of and by normalizing the extrapolated value [] to the zero-pressure value ( = 0.27 cm/K2 for ), since the pressure variation of -coefficient is almost linear for 4.8 GPa.
The low- measurements were carried out for sample using a 3He-4He dilution refrigerator in temperatures down to 40 mK and in fields up to 7 T under high pressures up to 7.5 GPa. Here, the magnetic field was applied almost along the -axis (easy-magnetization axis) and the current was applied perpendicular to the field direction. The high- measurements under high pressure were performed at zero magnetic field using 4He cryostat for sample as well as to check the reproducibility.
As a pressure transmitting medium, liquid argon was used, and pressure was determined with the ruby fluorescence technique. For high- measurements, since there is a volume increase of helium gas in bellows of the pressure-tuning device above liquid-helium temperature, this may cause a slight change of the force, which is applied to the pressure cell. Then, the determination of pressure is more precise for low- measurements below 4 K than for high- measurements above 5 K.
III Results and Discussion
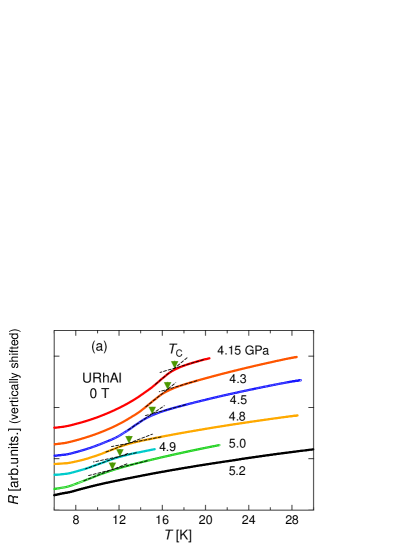
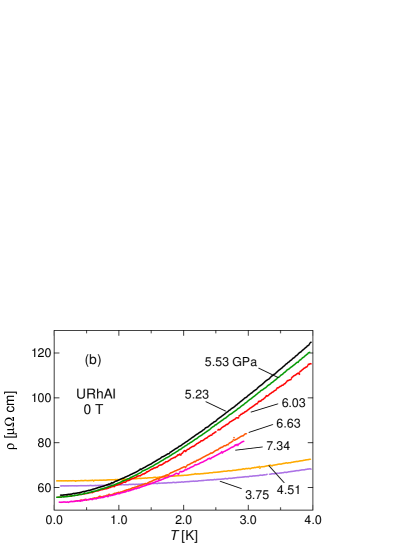
In order to examine the pressure dependence of the Curie temperature of URhAl, we first show the temperature dependence of the resistance at various pressures (shifted vertically) between 6 and 30 K in Fig. 1(a). One can see the clear kink anomaly in the resistivity curves due to the FM transition at the Curie temperature (), as indicated by the arrows [Fig. 1(a)]. shifts to lower temperature with increasing pressure, and the kink anomaly becomes too broad to determine for 5.0 GPa.
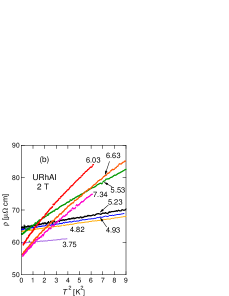
Figure 1(b) shows results of resistivity measurements below 4 K at high pressures from 3.75 to 7.34 GPa. At 3.75 and 4.51 GPa, is 19 and 17 K, respectively, and URhAl is FM in the temperature range of Fig. 1(b) at these pressures. The variation of resistivity is small at low temperature in the FM state. On the other hand, from 5.2 to 7.3 GPa, the variation of resistivity is very large compared to that at 3.75 and 4.51 GPa. Since we did not observe the kink anomaly in the resistivity due to the FM transition above 5.2 GPa, URhAl appears to be PM in the high-pressure region above 5.2 GPa.
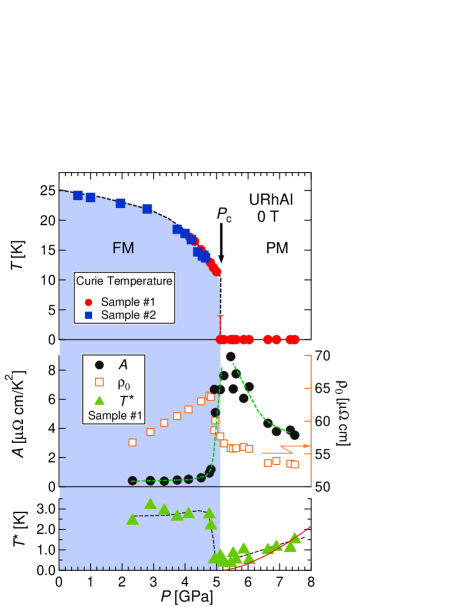
Figure 2 shows the obtained - phase diagram at zero field. There is no significant sample dependence of . suddenly disappears above 5.0 GPa. Our results suggest that the FM critical pressure exists at 5.2 GPa.
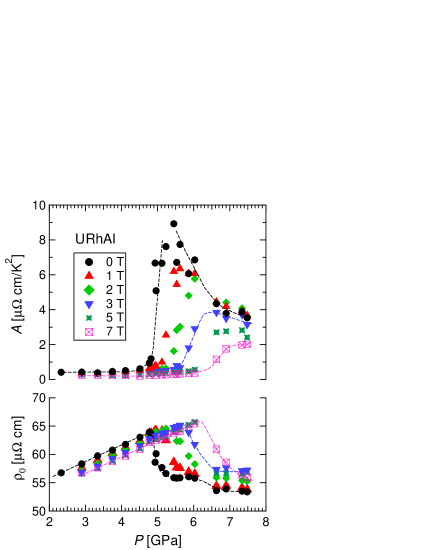
In Fig. 2, we also plot the -coefficient and the residual resistivity as a function of pressure, where . The pressure variation of the -coefficient is very small ( 0.4-0.5 cm/K2) for 4.8 GPa, whereas it shows a drastic increase above 5.0 GPa. The -coefficient becomes a maximum ( 9 cm/K2) at around 5.2-5.5 GPa, suggesting a large enhancement of the density of states at Fermi energy [] of itinerant electrons above . Interestingly, the large increase of the -coefficient (4 cm/K2) beyond indicates that the large enhancement of remains up to 7.5 GPa (Fig. 2). The behavior of the residual resistivity, , accompanies the behavior of the -coefficient, . Below 4.8 GPa, increases with increasing pressure almost linearly, then suddenly decreases with increasing pressure above 4.9 GPa. At 0 T shows a step-like behavior at 4.8 GPa slightly below 5.2 GPa.
We also plot , the maximum temperature for the -regime, in the 3rd panel of Fig. 2. is about 2-3 K in the low-pressure region below , but it suddenly decreases at , where shows a minimum ( 0.4 K), and then gradually increases with increasing pressure.
In FM spin fluctuation frame with a 2nd-order QCP, and are predicted to vary as and , respectively, leading to ; in other words, is constant Millis_PRB_1993 ; Flouquet_ArXiv_2005 . For URhAl, we obtain cm/K2 and K at , leading to 4.3, and cm/K2 and K at 7.5 GPa, leading to 4.6. This rough estimation suggests that the observed large -coefficient emerges due to the FM spin-fluctuation effects. However, we would like to point out the peculiarity of critical behavior of the FM QPT in URhAl; as shown in the 3rd panel of Fig. 2, does not vary as (the solid curve) and does not go to zero as . Also, the fact that is finite at conflicts with presence of a 2nd-order QCP in URhAl.
| [GPa] | |||||
|---|---|---|---|---|---|
| URhAl | 0 (FM) | 0.27 | 75 | 4.810-5 | |
| 5.2 | 8 | ||||
| UCoAl | 0 | 0.28 | 75 | 5.010-5 | |
| 0.54 | 0.2 | 0.7 | |||
| 1.5, 7 T | 0.4 | 1.4 | |||
| UGe2 | 0 | 0.007 | 30 | 7.810-6 | |
| 1.3 | 0.1 | 110 | 8.310-6 | 14.3 |


The maximum value of 9 cm/K2 in URhAl near is quite large for uranium intermetallic compounds. While the heavy-electron superconductor UBe13 shows the exceptionally large -coefficient ( 90-100 cm/K2) Remenyi_JPhysique_1986 ; KodowakiWoods_SolidStateCom_58_1986 , a lot of uranium compounds show the -coefficient of less than 1 cm/K2 as summarized in the Kadowaki-Woods plot KodowakiWoods_SolidStateCom_58_1986 . Table I shows the -coefficient, the electronic specific-heat coefficient (), and the ratio for URhAl TristanCombier_Dr_Thesis_2014 , UCoAl Aoki_JPSJ_2011 , and UGe2 Tateiwa_JPhysC_2001 . Besides, indicates the ratio of divided by the -coefficient at 0 GPa and zero field, i.e. . As for UCoAl, the -coefficient is cm/K2, and the electronic specific-heat coefficient is 75 mJ/K2mol Aoki_JPSJ_2011 . The -coefficient of UCoAl increases near the QCEP ( 1.5 GPa, 7 T) Aoki_JPSJ_2011 , but the enhancement of is not so large compared to the pressure-induced large -coefficient in URhAl. Also, the -coefficient of UGe2 increases 14-fold under high pressure, but the maximum value of -coefficient is not so large ( 0.1 cm/K2) at 1.3 GPa Tateiwa_JPhysC_2001 . On the other hand, a large -coefficient ( 5 cm/K2) near the critical pressure has been reported in an itinerant heavy-electron FM compound U4Ru7Ge6 Hidaka_JPSJ_2011 . The observed large -coefficient in URhAl near is comparable with the value observed in cerium heavy-electron compounds such as CeCu2Si2 KodowakiWoods_SolidStateCom_58_1986 ; Holmes_PRB_2004 . From the comparison with other heavy-electron materials using the Kadowaki-Woods relation, the quantum critical region in URhAl may be described grosso modo by the strongly correlated heavy quasiparticle with the large caused by spin fluctuations. However, we should be careful about the above discussion since the value of is not universal depending on the correlation of the system EndoNote_KadowakiWoods ; Miyake_SolidStateCom_1989 ; Morales_Thesis_2014 .
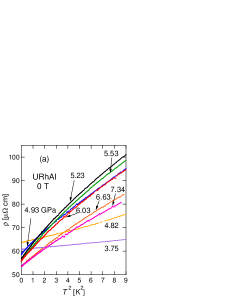
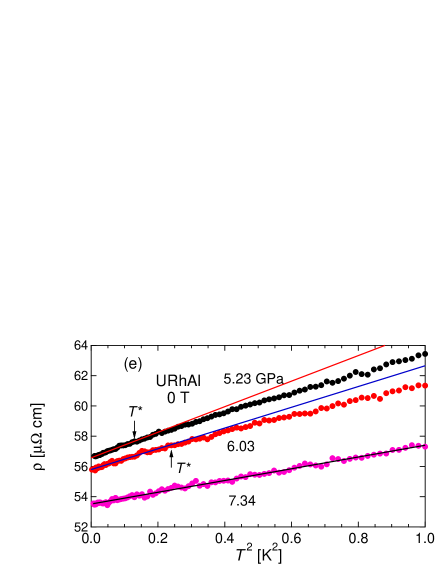
Next, we shall see low- curves in zero field and magnetic fields. Figures 3(a), (b), (c), and (d) show the resistivity vs under high pressures from 3.75 to 7.34 GPa for 0, 2, 4, and 7 T, respectively. For zero field, at lower pressures than 4.8 GPa, we find behavior, as predicted for an itinerant FM state at low temperature ( ) Ueda_JPSJ_1975 . On the other hand, the resistivity shows a remarkable variation with a large increase of the slope (-coefficient) at 0 T between 4.82 and 4.93 GPa. Around 5-6 GPa, the temperature region where the resistivity can obey the expression is much smaller than at 4.82, and 3.75 GPa. In Fig. 3(e), we show the enlarged figure of curves for 0 T measured at 5.23, 6.03, and 7.34 GPa as a function of . The arrows indicate the temperature, (Fig.2), below which the -regime works. For an applied field of 2 T, the large -coefficient is suppressed at 4.93, and 5.23 GPa, and shows the -temperature dependence, similar to that at 4.82, and 3.75 GPa. On the other hand, the slope of becomes large at around 6-6.6 GPa at 2 T. For 4 T, and 7 T, the variation of at high-pressure region above 6.6 GPa becomes larger than for pressures below 6.0 GPa.
In Fig. 4, we summarize the pressure dependence of the -coefficient and the residual resistivity of URhAl (sample ), obtained from the expression, , in zero and magnetic fields. With increasing magnetic field, the divergence of the -coefficient is suppressed, and the step-like behavior of becomes broad (Fig. 4).
Since the behaviors of the -coefficient and above 5.0 GPa differ evidently from those below 5.0 GPa in the FM state, it is considered that URhAl is not in the FM state any more above 5.0 GPa. This is consistent with the fact that the anomaly due to the FM transition disappears above 5.0 GPa (Fig. 2). The Curie temperature, , possibly becomes a 1st-order phase transition, and then suddenly collapses above 5.0 GPa.
The experimentally observed large enhancement of the -coefficient suggests a large mass enhancement due to spin-fluctuation effects and/or a variation of Fermi surface. Generally, large fluctuation effects occur for a 2nd-order phase transition with a divergence of the correlation length of the magnetic order. In contrast, such an effect would not be expected for a 1st-order phase transition. Nevertheless, if the transition near the is only weakly 1st-order and the drop of the FM moment at the FM-PM phase transition is very small, the critical behavior becomes similar to that of a QCP, and then a large maximum in the -coefficient may emerge due to the increase of correlation length as .
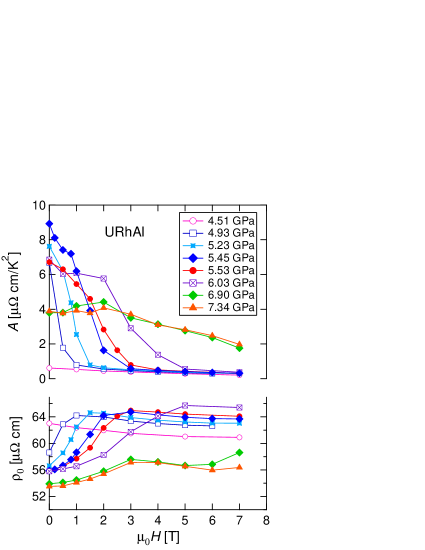
Figure 5 shows the -coefficient and the residual resistivity as a function of magnetic field. At 4.5 GPa, value is very small, and monotonically decreases with increasing field. At 5.0 GPa, the -coefficient begins to increase in zero and low fields, and is suddenly suppressed by magnetic field of 1 T. At around 5.2-5.5 GPa, the -coefficient is very large in zero field and remains large up to 1-1.5 T, then rapidly decreases at high fields (1.5-2 T). At 6.0 GPa, the decrease of occurs at higher field near 3 T. At 6.9 and 7.3 GPa, the value of -coefficient at 0 T becomes about half of the value at 5.5 GPa, and after showing a slight maximum at around 2 T, it monotonically decreases with increasing field. At 6.9 and 7.3 GPa, increases with increasing field, and shows a smooth maximum at around 3 T.
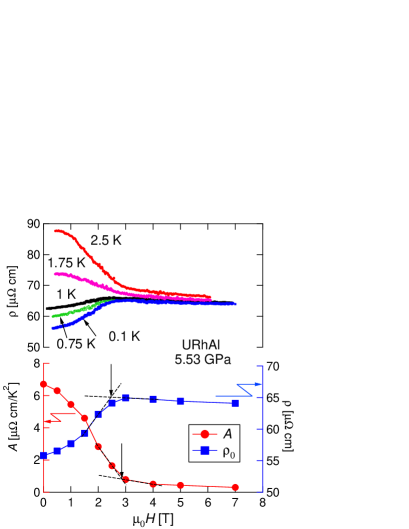
To search for the FM wing structure, we look at the magnetic field dependence of the resistivity [] under high pressure. Figure 6 shows under 5.53 GPa at 2.5, 1.75, 1, 0.75, and 0.1 K with and obtained from the temperature dependence of . curve bends at around 2.5-3 T for each temperature. We define the anomaly at at from and as indicated by the arrows in Fig. 6. At the low-field region below , the -coefficient is very large compared to the high-field region above . On the other hand, the high-field region above corresponds to the FM side, where the resistivity obeys with the small -coefficient.
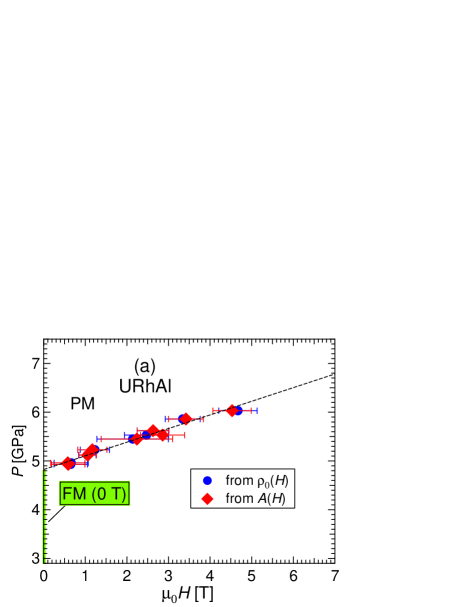
The anomaly in curves supports the presence of FM wing structure in URhAl. In Fig. 7(a), we plot the - phase diagram for obtained from the magnetic field dependences of -coefficient and . We obtain the relation 3.5 0.1 T/GPa. Then we estimate the TCP at 4.8-4.9 GPa, when , using the value of . In UCoAl, which has the same crystal structure as URhAl, a clear 1st-order metamagnetic transition is seen at due to the FM wing. According to high pressure studies Aoki_JPSJ_2011 , the metamagnetic transition field of UCoAl varies as 3.5 T/GPa Aoki_JPSJ_2011 , which is very similar to that of URhAl. We summarize the values of and in Table. II.
| [GPa] | [T/GPa] | |
|---|---|---|
| URhAl | 4.8-4.9 | 3.5 0.1 |
| UCoAl | 0.2 | 3.5 |
When we cross the FM wing, we expect the 1st-order PM-FM phase transition at . At the 1st-order transition in UCoAl, the -coefficient shows a step-like behavior as a function of magnetic field Aoki_JPSJ_2011 . On the other hand, the step-like behavior in the -coefficient of URhAl near is rather broad. This may indicate that the transition at is weakly 1st-order in URhAl. However, the sample quality can be the origin of the broadness of the transition.
We shall compare for URhAl with that for UCoAl. For UCoAl, a step-like behavior in at is seen under low pressure region below 0.54 GPa. For 0.54 GPa, the difference of pressure from the TCP (0.2 GPa ) is estimated to be 0.74 GPa. Since we estimate 4.8 GPa for URhAl in the present work, the pressure of 0.54 GPa in UCoAl may correspond to a pressure of 5.54 GPa in URhAl. At 5.5 GPa, we obtain T for URhAl from Fig. 7(a), which is close to the value of for UCoAl at 0.54 GPa.
In contrast, the enhancement of the -coefficient in URhAl is much larger than the value in UCoAl (see, Table I), suggesting that the density of states (mass enhancement and/or the change of Fermi surface) near the QPT is more drastic in URhAl than UCoAl. In URhAl, the -coefficient below at 5.0 GPa is about 20 times larger than the -coefficient above (Fig. 5). In UCoAl, on the other hand, the -coefficient in the PM state below is about only 2 times larger than the -coefficient above at 0 and 0.54 GPa Aoki_JPSJ_2011 .
The difference of the -coefficient between URhAl and UCoAl may be related to that of the magnetic ordered moments; the FM ordered moment in URhAl is 3 times larger ( 0.9 /U ) than the magnetic-field-induced FM moment ( 0.3 /U) in UCoAl. As shown theoretically by Yamada Yamada_PRB_1993 , thermally fluctuating magnetic moments enhance the scattering of quasiparticles in the PM state, and may cause such a large -coefficient. At present, the ordered moment near has not yet been studied for URhAl, so further studies are necessary to clarify this point.
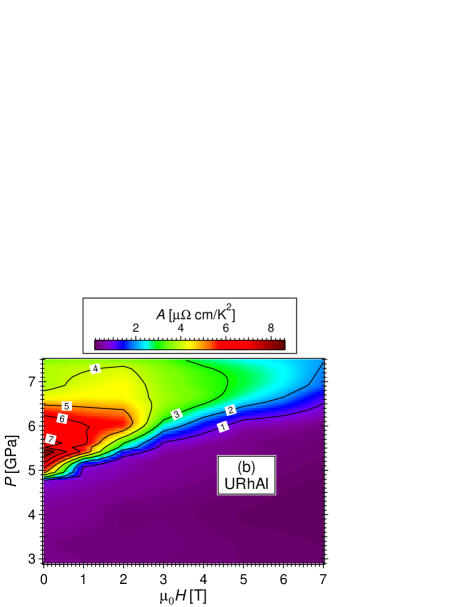
The behavior of the -coefficient changes in association with the wing structure. To see the relationship between the enhancement of -coefficient and the FM wing, it is intriguing to see the contour plot of -coefficient on the - phase diagram. Figure 7(b) shows the contour plot of the -coefficient on the - phase diagram, obtained from . The red-colored region in this plot shows the enhancement of the -coefficient, whereas the purple-colored region shows the small -coefficient. The -coefficient is largest at around 5.2-5.5 GPa in zero field. With increasing pressure and magnetic field, the -coefficient is suppressed. The large enhancement of -coefficient occurs outside of the FM wing (red region).
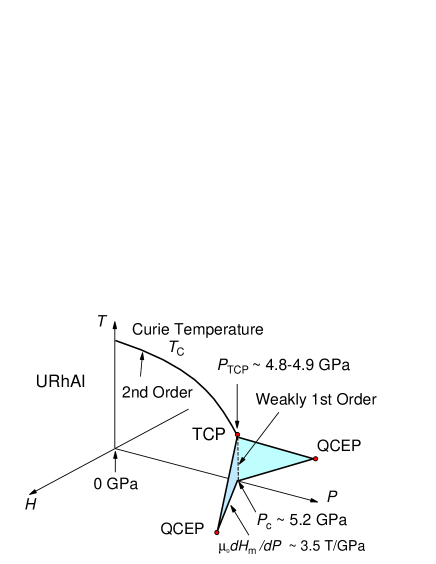
In Fig. 8, we plot the schematic -- phase diagram of the FM wings in URhAl [See also the top panel of Fig. 2 and Fig. 7(a)]. The theoretically suggested 1st-order wing planes terminate at the QCEP at zero temperature in a finite field. In UCoAl the magnetic-field dependence of coefficient shows a sharp maximum at the PM-FM transition near the QCEP ( 1.5 GPa in 7 T) Aoki_JPSJ_2011 ; TristanCombier_Dr_Thesis_2014 . Such a field enhancement in was not observed in the present work, suggesting that the QCEP of URhAl may exist above 7 T. Alternatively, the interplay between spin fluctuation and Fermi-surface instability can lead to complex phenomena as discussed later.
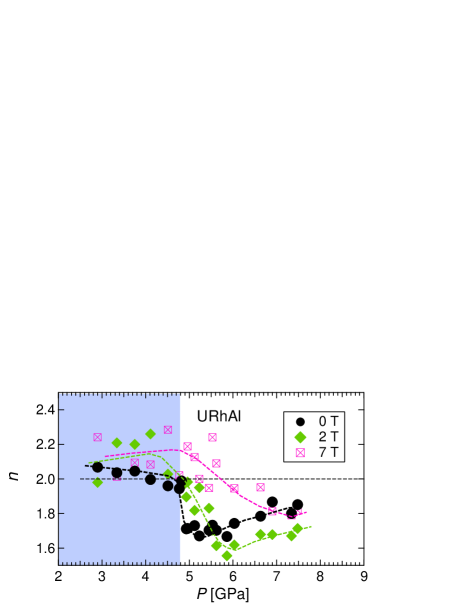
As close to the critical pressure, the temperature range for Fermi-liquid regime [] is found to be very small ( 0.4 K), an alternative description is to focus on the NFL behavior. We analyzed the resistivity data by the expression, . Here, the maximum temperature for the NFL regime , i.e., K at . Figure 9 shows the pressure dependence of the exponent of resistivity (). As seen in Fig. 9, at 0 T the exponent is about 2 below 4.8 GPa, whereas decreases with a step-like variation to a minimum at around 5.0-6.0 GPa. At around 5.0-6.0 GPa, the values of are about 1.6-1.8. At 2 T and 7 T, the step-like behavior and the minimum of the exponent shift to higher pressure regions. At 7 T, the dip of at around 7.0 GPa becomes shallow and broad, and the value of becomes slightly larger than at 0 T and 2 T.
The exponent (Fig. 9) varies as a function of pressure corresponding to the behavior of the -coefficient (Fig. 4). Above , the exponent is nearly 1.6-1.7, which is close to the value ( 5/3) suggested from the SCR theory for three-dimensional FM spin fluctuation near a QCP. However, this NFL behavior seems to conflict with the presence of the FM 1st-order wing structure in URhAl. A weakly 1st-order nature at the FM wing may explain the NFL behavior in the resistivity.
Hereafter, we note that the critical behavior around in URhAl is different from the theoretical suggestion for a 2nd-order FM QCP. It is suggested that the ratio of for the Fermi-liquid regime to for the NFL regime is enhanced as as approaching for a 2nd-order FM QCP Millis_PRB_1993 ; Flouquet_ArXiv_2005 . For URhAl, does not change clearly, i.e., K. In addition, is almost linear (Fig. 2). These experimental results for URhAl suggest that the spin-fluctuation effects cannot be explained simply by the 2nd-order FM QCP again.
In URhAl, the NFL properties (see Fig, 9) are observed far above , and the pressure domain of the enhancement of the -coefficient appears quite asymmetric around . Furthermore the enhancement of the -coefficient extends over a large window (5.5-7 GPa). Then the key question is if the switch from the FM state to the PM state simply occurs at or if there is a mark of a new pressure-induced phase intermediate between the FM and the PM phases.
Recently it has been shown theoretically that another new phase possibly stabilizes near the FM-PM QPT Maslov_PRB_2009 ; Chubukov_PRL_2009 ; Conduit_PRL_2009 ; Karahasanovic_PRB_2012 ; Thomson_PRB_2013 ; Pedder_PRB_2013 ; if there are quantum fluctuations in terms of fermionic particle-hole excitations on the Fermi surface, some deformations of the Fermi surface enhance the phase space available for the quantum fluctuations, and such a Fermi-surface instability causes another type of ordering to gain the free energy of the system Conduit_PRL_2009 ; Karahasanovic_PRB_2012 ; Thomson_PRB_2013 ; Pedder_PRB_2013 .
It has been shown that two cases of new ordering are possible near the FM-PM QPT: (i) spiral magnetic phase, and (ii) spin-nematic phase Karahasanovic_PRB_2012 . The energy scale of the spin-nematic phase transition is almost 10 times smaller than the case of spiral magnetic phase Karahasanovic_PRB_2012 , therefore a spiral magnetic phase might be more likely to occur. A spiral magnetic phase emerges below the TCP as an intermediate state between the uniform FM and the PM states Karahasanovic_PRB_2012 ; Thomson_PRB_2013 . The transition between the uniform FM and the spiral magnetic states occurs as a Lifshitz transition, whereas the transition between the spiral magnetic state and the PM state is of 1st-order Karahasanovic_PRB_2012 . Interestingly, an anisotropic dispersion for electron band changes the nature of the spiral-to-PM phase transition, and the transition possibly becomes 2nd-order Karahasanovic_PRB_2012 .
The possible presence of the intermediate new phase might explain why we cannot see a clear 1st-order transition between the FM and the PM states above , different from the case of UCoAl. In order to explore such a new phase around the QPT, further experimental studies are required. In particular, measurements of thermodynamic quantities and observation of Fermi-surface change through for URhAl, though experimentally challenging, would deepen the understanding the Fermi-surface instability and the nature of the FM QPT.
In URhAl, no superconductivity was observed under high-pressure up to 7.5 GPa at low temperature down to 0.1 K. At present we cannot rule out the possibility that the sample quality affects the emergence of superconductivity and the superconducting transition temperature is too low to be detected. However, even if a superconductivity does not occur, the FM system would resolve the instability due to the quantum fluctuation at 0 by the occurrence of another new phase associated with the Fermi-surface instability as mentioned just above.
It is interesting to consider why the intermediate phase possibly appears in URhAl. One may consider that the lack of local inversion center and/or the quasi-Kagome lattice in ZrNiAl-type structure can induce the intermediate phase. However, the ZrNiAl-type hexagonal symmetry structure (: ) does not lead to Dzyaloshinskii-Moriya interaction Kataoka_JPSJ_1981 , which could induce a helimagnetic order Dzyaloshinskii_JETP_1964 . Such an intermediate phase has not yet been observed in UCoAl, which has the same ZrNiAl-type structure, around the PM-FM phase transition induced by uniaxial stress along the -axis Ishii_PhysicaB_2003 ; Karube_JPSJ_2014 ; YShimizu_JPSJ_2015 . The relationship between the crystal structure and the occurrence of the intermediate phase remains open question. The authors in Ref. Karahasanovic_PRB_2012 suggest that the intermediate phase may generally occur even for a simple spherical Fermi surface due to the Fermi-surface instability accompanying the quantum fluctuations (particle-hole excitations on the Fermi surface). As seen in Fig. 9, the NFL behavior of the resistivity is remarkable in URhAl far above . Such strong quantum-fluctuation effects near the FM-PM QPT may invoke the intermediate phase in this material.
IV Conclusion
The quantum criticality of the three-dimensional-Ising-type itinerant FM compound URhAl was studied by low-temperature resistivity measurements under high pressure up to 7.5 GPa. The Curie temperature is suppressed with increasing pressure, and suddenly disappears above 5.0 GPa. Our resistivity results suggest the FM critical pressure of 5.2 GPa. Above 5.2 GPa, the ground state is not FM, and the -coefficient is largely enhanced at around 5.2-5.5 GPa in zero and low-field region. The characteristics of the temperature and the magnetic-field dependences of the resistivity may be consistent with the presence of a FM wing structure with an estimated TCP at 4.8-4.9 GPa. At least with the present quality of the crystal the 1st-order phase transition appears weak. The resistivity shows the NFL behavior above 5.0 GPa up to 7.5 GPa. URhAl may be a material in which the switch from the FM state to the PM state occurs through an intermediate phase around the QPT.
ACKNOWLEDGMENT
We would like to thank S. Kambe, G. Knebel, K. Ishida, Y. Tada, K. Hattori, S. Hoshino, and Y. Ikeda for valuable discussions and helpful comments. This work was supported by ERC starting grant New Heavy Fermion, KAKENHI, REIMEI, ICC-IMR, and ANR project PRINCESS.
References
- (1) S. Doniach, and S. Engelsberg, Phys. Rev. Lett. 17, 750 (1966).
- (2) N. F. Berk, and J. R. Schrieffer, Phys. Rev. Lett. 17, 433 (1966).
- (3) M. T. Bléal-Monod, S-K. Ma, and D. R. Fredkin, Phys. Rev. Lett. 20, 929 (1968).
- (4) T. Moriya, Phys. Rev. Lett. 24, 1433 (1970).
- (5) T. Moriya, and A. Kawabata, J. Phys. Soc. Jpn. 34, 639 (1973).
- (6) T. Moriya and T. Takimoto J. Phys. Soc. Jpn. 64, 960 (1995).
- (7) T. Moriya, Spin Fluctuations in Itinerant Electron Magnetism, Springer-Verlag Berlin Heidelberg GmbH, (1985).
- (8) T. Moriya, and K. Ueda, Rep. Prog. Phys. 66, 1299 (2003).
- (9) J. A. Hertz, Phys. Rev. B 14, 1165 (1976).
- (10) A. J. Millis, Phys. Rev. B 48, 7183 (1993).
- (11) Another alternative is the local criticality picture with the fluctuations for the Fermi surface; see, Löhneysen, A. Rosch, M. Vojta, and P. Wolfle, Rev. Mod. Phys. 79, 1015 (2007).
- (12) C. Pfleiderer, G. J. McMullan, S. R. Julian, and G. G. Lonzarich, Phys. Rev. B 55, 8330 (1997).
- (13) C. Pfleiderer, S. R. Julian, and G. G. Lonzarich, Nature 414, 427 (2001).
- (14) C. Pfleiderer, and A. D. Huxley, Phys. Rev. Lett. 14, 147005 (2002).
- (15) V. Taufour, D. Aoki, G. Knebel, and J. Flouquet, Phys. Rev. Lett. 105, 217201 (2010).
- (16) H. Kotegawa, V. Taufour, D. Aoki, G. Knebel, and J. Flouquet, J. Phys. Soc. Jpn. 80, 083703 (2011).
- (17) M. Uhlarz, C. Pfleiderer, and S. M. Hayden, Phys. Rev. Lett. 93, 256404 (2004).
- (18) N. Kabeya, H. Maekawa, K. Deguchi, N. Kimura, H. Aoki, and N. K. Sato, J. Phys. Soc. Jpn. 81, 073706 (2012).
- (19) D. Belitz, T. R. Kirkpatrick, T. Vojta, Phys. Rev. Lett. 82, 4707 (1999).
- (20) D. Belitz, T. R. Kirkpatrick, and J. Rollbühler, Phys. Rev. Lett. 94, 247205 (2005).
- (21) H. Yamada, Phys. Rev. B 47, 11211 (1993).
- (22) H. Yamada, Physica B 391, 42 (2007).
- (23) V. P. Mineev, J. Phys. Conf. Ser. 400, 032053 (2012).
- (24) G. A. Gehring, Europhys. Lett. 82, 60004 (2008).
- (25) A. J. Millis, A. J. Schofield, G. G. Lonzarich, and S. A. Grigera, Phys. Rev. Lett. 88, 217204 (2002).
- (26) Y. Yamaji, T. Misawa, and M. Imada, J. Phys. Soc. Jpn. 76, 063702 (2007).
- (27) M. Imada, T. Misawa, and Y. Yamaji, J. Phys.: Condens. Matter 22, 164206 (2010).
- (28) S. S. Saxena, P. Agarwal, K. Ahilan, F. M. Grosche, R. K. W. Haselwimmer, M. J. Steiner, E. Pugh, I. R. Walker, S. R. Julian, P. Monthoux, G. G. Lonzarich, A. Huxley, I. Sheikin, D. Braithwaite, and J. Flouquet, Nature 406, 587 (2000).
- (29) D. Aoki, A. Huxley, E. Ressouche, D. Braithwaite, J. Flouquet, J-P. Brison, E. Lhotel, and C. Paulsen, Nature 413, 613 (2001).
- (30) N. T. Huy, A. Gasparini, D. E. De Nijs, Y. Huang, J. C. P. Klaasse, T. Gortenmulder, A. De Visser, A. Hamann, T. Görlach, and H. v Löhneysen, PRL 99, 067006 (2007).
- (31) A. V. Andreev, R. Z. Levitin, Y. F. Popov, and R. Y. Yumaguzhin, Sov. Phys. Solid State, 27, 1145 (1985).
- (32) D. Aoki, T. Combier, V. Taufour, T. D. Matsuda, G. Knebel, H. Kotegawa, and J. Flouquet, J. Phys. Soc. Jpn. 80, 094711 (2011).
- (33) T. D. Matsuda, Y. Aoki, H. Sugawara, H. Sato, A. V. Andreev, and V. Sechovsky, J. Phys. Soc. Jpn. 68, 3922 (1999).
- (34) N. V. Mushnikov, T. Goto, K. Mamishima, H. Yamada, A. V. Andreev, Y. Shiokawa, A. Iwao, and V. Sechovsky, Phys. Rev. B 59, 6877 (1999).
- (35) A. V. Andreev, I. K. Kozlovskaya, N. V. Mushnikov, T. Goto, V. Sechovsky, Y. Homma, and Y. Shiokawa, J. Alloys Compd. 284, 77 (1999).
- (36) P. A. Veenhuizen, F, R. de Boer, A. A. Menovsky, V. Sechovsky, and L. Havela, J. Phys (Paris) 12, 485 (1988).
- (37) P. Javorský, L. Havela, F. Wastin, P. Boulet, and J. Rebizant, Phys. Rev. B 69, 054412 (2004).
- (38) T. Combier, Doctoral Thesis, CEA-Grenoble (2014).
- (39) B. Salce, J. Thomasson, A. Demuer, J. J. Blanchard, J. M. Martinod, L. Devoille, and A. Guillaume, Rev. Sci. Instrum. 71, 2461 (2000).
- (40) A. Demuer, C. Marcenat, J. Thomasson, R. Calemczuk, B. Salce, P. Lejay, D. Braithwaite, and J. Flouquet, J. Low. Temp. Phys. 120, 245 (2000).
- (41) J. Flouquet, arXiv: cond-mat/0501602 (2005).
- (42) G. Remenyi, D. Jaccard, J. Flouquet, A. Briggs, Z. Fisk, J. L. Smith, and H. R. Ott, J. Phys. (Paris) 47, 367 (1986).
- (43) K. Kadowaki, and S. B. Woods, Solid. State. Commun. 58, 507 (1986).
- (44) N. Tateiwa, T. C. Kobayashi, K. Hanazono, K. Amaya, Y. Haga, R. Settai, and Y. Onuki, J. Phys.: Condens. Matter 13, L17 (2001).
- (45) H. Hidaka, S. Takahashi, Y. Shimizu, T. Yanagisawa, and H. Amitsuka, J. Phys. Soc. Jpn. Suppl. 80, SA102 (2011).
- (46) A. Holmes, D. Jaccard, and K. Miyake, Phys. Rev. B 69, 024508 (2004).
- (47) The link between the enhancement of and would not be obvious if the system changes from a weakly correlated coupling () to a strongly correlate coupling () Miyake_SolidStateCom_1989 , where and are the electronic specific-heat coefficient of the electronic band and the contribution from the mass enhancement due to the strong correlation, respectively. Here, the total electronic specific-heat coefficient is Miyake_SolidStateCom_1989 . For , , whereas for , . Therefore, the value of is not universal depending on the strength of correlation in the system. Recently, it was revealed for the AF heavy-electron compound CeRh2Si2 that the ratio goes from the weak coupling regime to the strong coupling regime around with increasing pressure Morales_Thesis_2014 .
- (48) K. Miyake, T. Matsuura, and C. M. Varma, Solid. State. Commun. 71, 1149 (1989).
- (49) A. P. Morales, Doctoral Thesis, CEA-Grenoble (2014).
- (50) K. Ueda, and T. Moriya, J. Phys. Soc. Jpn. 39, 605 (1975).
- (51) D. L. Maslov, and A. V. Chubukov, Phys. Rev. B 79, 075112 (2009).
- (52) A. V. Chubukov, and D. L. Maslov, Phys. Rev. Lett. 103, 216401 (2009).
- (53) G. J. Conduit, A. G. Green, and B. D. Simons, Phys. Rev. Lett. 103, 207201 (2009).
- (54) U. Karahasanovic, F. Krüger, and A. G. Green, Phys. Rev. B 85, 165111 (2012).
- (55) S. J. Thomson, F. Krüger, and A. G. Green, Phys. Rev. B 87, 224203 (2013).
- (56) C. J. Pedder, F. Krüger, and A. G. Green, Phys. Rev. B 88, 165109 (2013).
- (57) M. Kataoka, and O. Nakanishi, J. Phys. Soc. Jpn. 50, 3888 (1981).
- (58) I. E. Dzyaloshinskii, Sov. Phys. JETP 19, 960 (1964).
- (59) Y. Ishii, M. Kosaka, Y. Uwatoko, A. V. Andreev, and V. Sechovsky, Physica B 334, 160 (2003).
- (60) K. Karube, S. Kitagawa, T. Hattori, K. Ishida, N. Kimura, and T. Komatsubara, J. Phys. Soc. Jpn. 83, 084706 (2014).
- (61) Y. Shimizu, B. Salce, T. Combier, D. Aoki, and J. Flouquet, J. Phys. Soc. Jpn. 84, 023704 (2015).