Magnetism and superconductivity in U2PtxRh(1-x)C2
Abstract
We report the phase diagram of the doping series U2PtxRh(1-x)C2, studied through measurements of resistivity, specific heat and magnetic susceptibility. The Néel temperature of U2RhC2 of K is suppressed with increasing Pt content, reaching zero temperature close to , where we observed signatures of increased quantum fluctuations. In addition, evidence is presented that the antiferromagnetic state undergoes a spin-reorientation transition upon application of an applied magnetic field. This transition shows non-monotonic behaviour as a function of , peaking at around . Superconductivity is observed for , with increasing with increasing . The reduction in and increase in residual resistivity with decreasing Pt content is inconsistent with the extension of the Abrikosov-Gor’kov theory to unconventional superconductivity.
pacs:
I Introduction
The study of superconductivity and magnetism in uranium based heavy-fermion materials has provided a rich array of physics that has challenged and guided our understanding for several decades. Notable examples are the superconductivity in UBe13 Ott et al. (1983), as well as the antiferromagnetic (AFM) order, multiple superconducting phases and evidence for triplet pairing seen in UPt3 Joynt and Taillefer (2002). Recently, the study of unconventional superconductivity has focussed on the role of quantum fluctuations associated with the suppression of a second order phase transition to zero temperature, such as in URhGe under an applied magnetic field Aoki et al. (2001); Lévy et al. (2005). U2PtC2 is a so-called “nearly-heavy-fermion” system because of its moderately enhanced electron effective mass of order 100 times that of a free electron Meisner et al. (1984). It becomes superconducting below the transition temperature K, and does not display long range magnetic orderMatthias et al. (1969); Meisner et al. (1984); Wu et al. (1994); Ebel et al. (1996). The mechanism for superconductivity in U2PtC2 is an open question. Recent nuclear magnetic resonance (NMR) measurements of U2PtC2 have shown evidence for spin triplet pairing and unconventional superconductivity Mounce et al. (2014). Isostructural U2RhC2 displays no superconductivity but orders antiferromagnetically at a Néel temperature K, and shows evidence for possible “complex magnetic behaviour” at lower temperatures Ebel et al. (1996).
Given the nature of the parent compounds, the doping series U2PtxRh(1-x)C2 must show some evolution between a magnetically ordered and superconducting ground state. Here we report thermodynamic and transport measurements of U2PtxRh(1-x)C2 and find that with increasing platinum content is suppressed to zero temperature close to , where we observe evidence for quantum critical fluctuations. However, superconductivity is not observed until , where signatures of these fluctuations are almost entirely absent. is maximal in U2PtC2. Study of the magnetic field dependence of the AFM state has revealed evidence of a spin-reorientation transition. We discuss the possible implications of our results with respect to competing magnetic interactions and superconductivity.
II Sample preparation
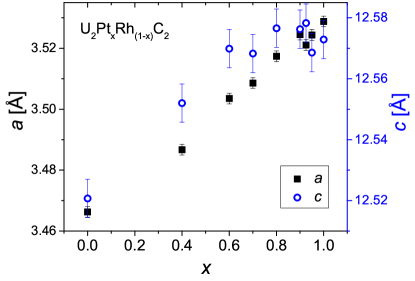
Polycrystalline U2PtxRh(1-x)C2 samples were made by arc melting and subsequent annealing. Depleted-U, Pt, Rh and C were weighed out according to the ratio of U:Pt:Rh:C of . This ratio was found to produce a lower UC impurity content than the other ratios attempted of or . During the arc melting, the resulting button was flipped and melted several times. The button was then wrapped in Ta foil and sealed in a quartz tube under vacuum before being annealed for two months at 1050∘C. Annealing of the product was necessary to further reduce the impurity content. Growths of single crystals were attempted using Bi, Zn, Al, Ga, Sn, Sb, and U fluxes, but were not successful. Powder X-ray diffraction of the polycrystalline samples confirmed that U2PtC2 and U2RhC2 possess the Na2HgO2 structure type in which all the U sites are equivalent, as first discussed for the isostructural case of U2IrC2 Bowman et al. (1971). The lattice parameters as a function of are shown in Fig. 1.
The powder X-ray diffraction patterns for U2PtC2, U2Pt0.7Rh0.3C2 and U2RhC2 are shown in Fig. 2a, 2b and 2c, respectively.
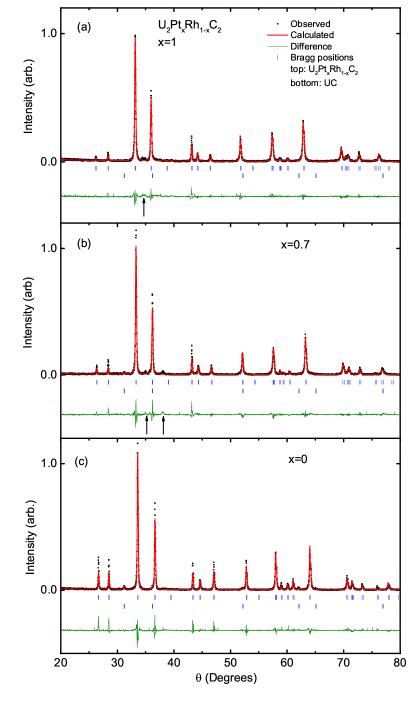
Detectable impurity phases in powder X-ray patterns of the various doped samples were the paramagnetic materials UC, UC2, Rh or Pt. These were all at a concentration of less than . In samples with there was also a small number of low intensity peaks that could not be identified. In order to further investigate the sample quality, energy dispersive X-ray (EDX) measurements were performed on U2PtC2 and U2RhC2. Backscattered electron images of these two samples are shown in Fig. 3.
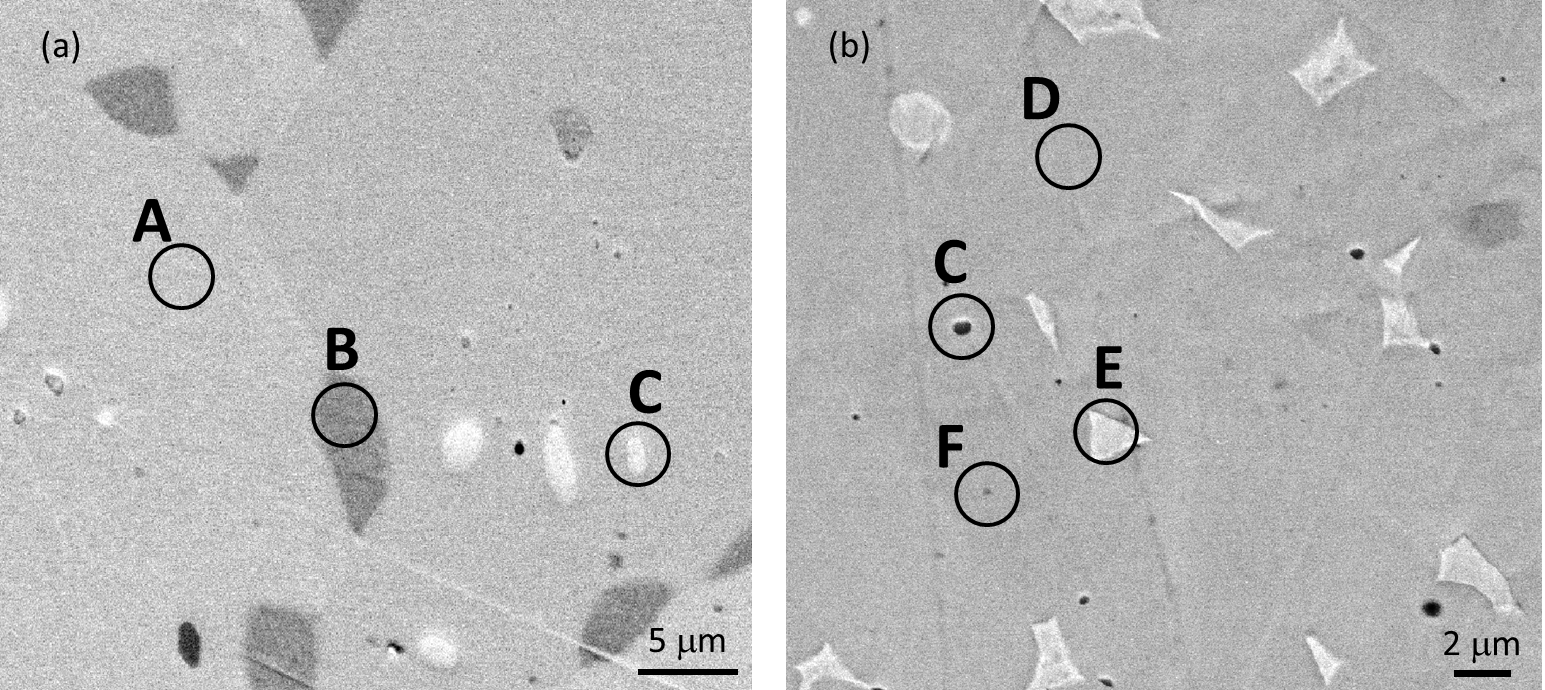
Fig. 3a shows an image of the U2RhC2 sample in which we identify three phases, (A) U2RhC2, (B) URh2Cy () and (C) UC (). Fig. 3b shows an image of the U2PtC2 sample in which we also identify three phases, (C) UC(), (D) U2PtC2 and (E) UPt2Cy (). The concentrations of the impurity phases were estimated from the area of the features in the images. The concentrations of UC calculated from the Rietveld refinement of the x-ray diffraction patterns shown in Fig. 2 are and for the U2PtC2 and U2RhC2 samples, respectively. The region marked F in Fig. 3b indicates a small inclusion that could not be identified because the diameter of the feature is significantly smaller than the X-ray spot size, which is of order . The exact carbon content of the UPt2Cy and URh2Cy phases could not be established within the measurement because of the difficulty in resolving the concentration of light elements. However, we were able to estimate that . The powder X-ray diffraction data did not indicate the presence of a UPt2Cy or a URh2Cy phase, although there were unidentified peaks in the U2PtC2 sample. Therefore, we conclude that either the UPt2Cy is responsible for the unidentified X-ray peaks, or that the phase is amorphous and not visible in the X-ray pattern. If the unidentified peaks are not the result of the UPt2Cy inclusions, then we must assume that these come from the small features marked as F in the electron image. No unidentified peaks were seen in the X-ray of the U2RhC2 samples, despite observation of URh2Cy inclusions from the EDX measurements. This suggests that these inclusions are amorphous.
III Phase diagram
The zero field phase diagram of U2PtxRh(1-x)C2 shown in Fig.4
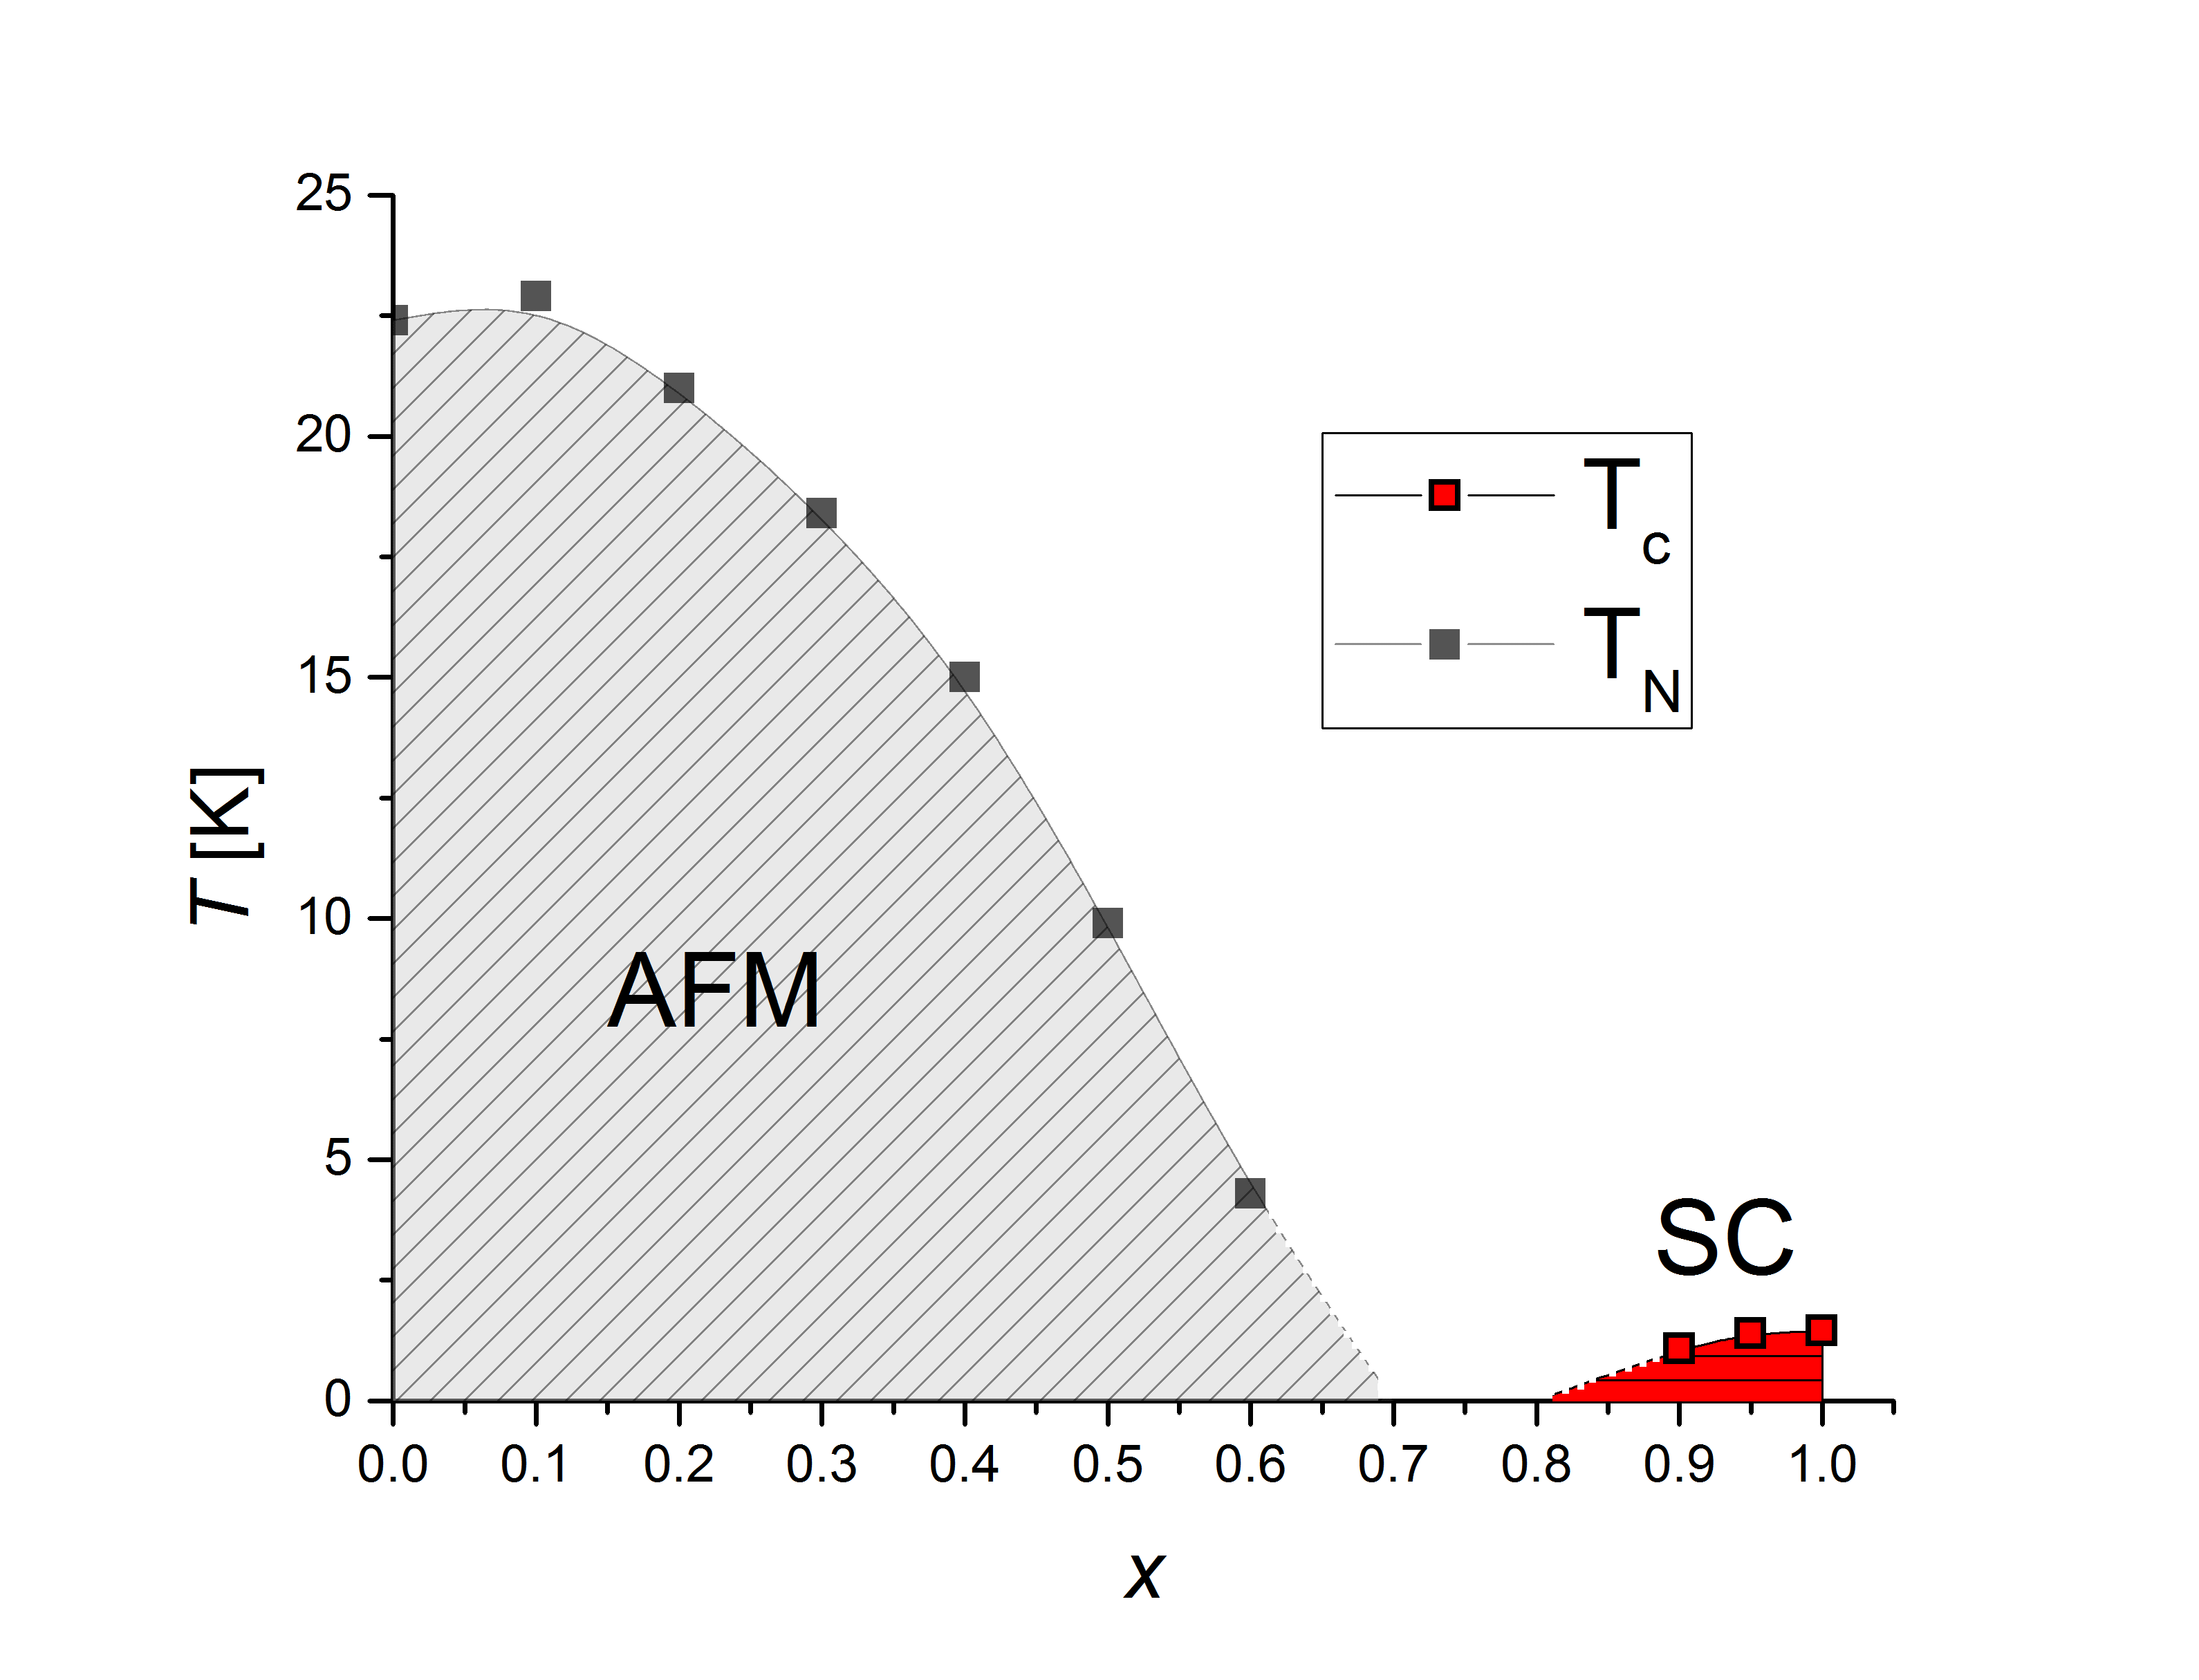
was established from measurements of the resistivity , specific heat and magnetic susceptibility , shown in Fig. 5 as a function of temperature .
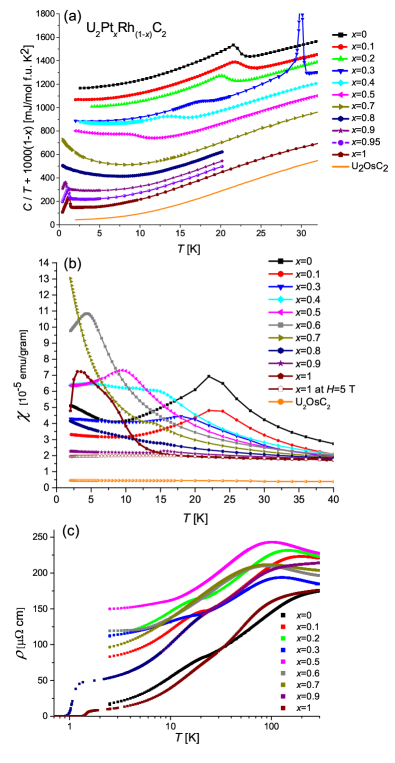
The data shown in Fig. 5a are shifted by mJ/mol f.u. K2 for clarity. Electrical resistivity of the samples was measured using a four-probe low frequency AC resistance bridge with spot-welded contacts of platinum wires. Specific heat measurements were performed using the time-relaxation method. Both of these measurements were performed within the Quantum Design PPMS system. Magnetic susceptibility was measured using a SQUID magnetometer in the Quantum Design MPMS system.
The AFM transition is observed in U2RhC2 as an anomaly in the specific heat and a peak in the magnetic susceptibility, coincident in temperature, at 21.6 K. The temperature of the transition slightly increases in , and then is suppressed and broadened with increasing Pt content. As the Néel temperature is suppressed to zero temperature with increasing there is an upturn in at low temperatures, suggestive of quantum fluctuations. The rate of the low temperature increase in is greatest in the sample, and at this doping the magnetic susceptibility also increases rapidly at low temperatures. is also the lowest doping in which an AFM transition is not observed above 0.38 K. Superconductivity is observed, above the lowest measured temperature of 0.38 K, only in samples in which , with Tc increasing with increasing Pt content. At a first order anomaly was observed in the specific heat at 30 K. This anomaly was reproducible between several crystals at this doping, but no corresponding feature was observed in the magnetic susceptibility or resistivity, and this type of anomaly was not observed at any other doping. The origin of the anomaly is not known.
An additional anomaly in the magnetic susceptibility is observed at around 16 K in some samples with . This is particularly prominent in the measurement at 0.1 T, although it is not present in the high field data. No corresponding feature is seen in the resistivity or specific heat measurements. These susceptibility features are likely to be an extrinsic impurity contribution. UPt2C0.1 and UPt2C0.2 were synthesized in order to investigate the possible contribution of the UPt2Cy () impurity seen in EDX measurements. Measurements of the magnetic susceptibility and heat capacity, not shown here, showed a small anomaly in magnetic susceptibility at K, with no corresponding feature in the specific heat. Therefore it is possible that this feature is responsible for the observed anomaly in the U2PtxRh(1-x)C2 data. In addition, the presence of a small concentration of UPt, which shows a peak in magnetic susceptibility at K, cannot be excluded Huber et al. (1975); Prokes and Klaasse (1998). However, we cannot rule out that the feature may be intrinsic, reminiscent of UPt3 Joynt and Taillefer (2002).
IV Magnetic field study
In order to further investigate the magnetism in U2PtxRh(1-x)C2, thermodynamic and transport measurements were also taken under an applied magnetic field . Isotherms of magnetization as a function of applied field are shown in Fig. 6 for U2RhC2.
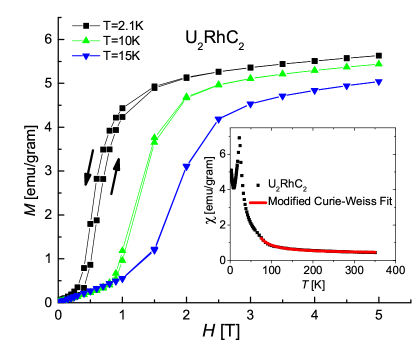
These data show a metamagnetic transition from the AFM state at a characteristic field that increases with increasing temperature. This is likely to be a spin-reorientation transition, such as a spin-flop or spin-flip transition. The transition is clearly first order, as evidenced by the hysteresis observed in between increasing and decreasing field sweeps. The saturation value of the magnetic moment at 2.1 K estimated from these data is U. This small value is suggestive of itinerant antiferromagnetism. The inset to Fig. 6 shows the measured magnetic susceptibility as a function of temperature. The data above 75 K were fitted with a modified Curie-Weiss law because of a large temperature independent contribution. This is given by , where emu/gram K is the Curie constant, K is the Weiss constant and emu/gram is the temperature independent susceptibility contribution. The effective moment estimated from the Curie constant is U. This means the Rhodes-Wolfarth ratio of the effective to saturated moment for U2RhC2 is , which again implies that the magnetism is itinerant Rhodes and Wohlfarth (1963).
The magnetic contribution to the specific heat was isolated from by subtracting the phonon contribution to the specific heat of the paramagnetic isostructural analogue U2OsC2. The data for are shown in Fig. 7.
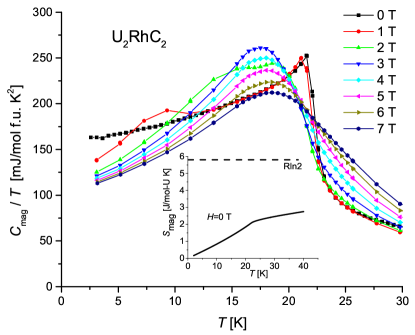
This figure shows the Néel temperature in zero field as a sharp peak in at 21.6 K. This peak broadens with increasing field, and the peak shifts to lower temperature. At 1 T there is an anomaly in near 10 K, in addition to the AFM transition, which we identify as associated with the spin-reorientation transition. The temperature of this feature increases with increasing field, eventually coinciding with the broadened higher temperature peak. The inset to Fig. 7 shows the magnetic contribution to the entropy as function of temperature, which reaches at . The small entropy is also suggestive of itinerant magnetism, and is comparable to other U based antiferromagnets thought to be itinerant, such as UCr2Si2 D. Matsuda et al. (2003) and UPd2Al3 Geibel et al. (1991). The magnetic anisotropy required to produce a spin-reorientation transition in an itinerant system could be the result of dipole-dipole interactions or spin-orbit coupling. Such scenarios have been suggested in UCr2Si2 D. Matsuda et al. (2003) and (TMTSF)2AsF6 Mortensen et al. (1982). In zero field the electron specific heat coefficient mJ/mol f.u. K2. Many uranium based materials, such as U2Zn17 Ott et al. (1984), show a significant reduction of upon entering the magnetically ordered state, and therefore it is likely that the density of states in U2RhC2 in the paramagnetic state is considerably larger than in U2PtC2.
The AFM and spin-reorientation transitions can be seen in at various magnetic fields applied perpendicular to the current, shown in Fig. 8.
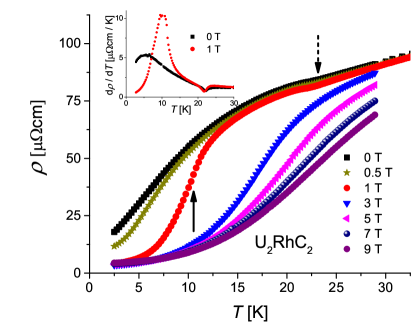
The Néel temperature appears as a kink in the zero field curve, as indicated by the dashed arrow, and appears as a dip in shown in the inset to Fig. 8 for 0 T and 1 T. This is reminiscent of the resistivity feature in Cr at , where the antiferromagnetism is believed to be itinerant and the kink arises from an energy gap forming on regions of the Fermi surface, leading to a loss of charge carriers and increased resistivity Arko et al. (1968). However, in Cr the magnetoresistance is positive, arising from the additional scattering associated with cyclotron orbits of the electrons around the Fermi surface Arko et al. (1968). In contrast, as shown in Fig. 8, the magnetoresistance in U2RhC2 is negative both above and below . UNiAl and UNiGa both show anomalies in the resistivity at , and display a strong negative magnetoresistance that saturates at high field, in close similarity to the data in Fig. 8. The negative magnetoresistance in UNiAl and UNiGa is attributed to field-induced superzone reconstructions of the Fermi surface Antonov et al. (1996); Sechovsky et al. (1992). A similar mechanism may contribute to the large negative magnetoresistance in U2RhC2. In addition, however, the magnetoresistance may have a significant contribution from spin-disorder scattering in the system, and the suppression of the spin fluctuations with magnetic field, as seen, for example, in ferromagnetic (Ga,Mn)As Matsukura et al. (1998).
The spin-reorientation transition is seen at 1 T in Fig. 8 as a peak in coincident in temperature with the feature in at around 10 K shown in Fig. 7. This transition is marked with a solid arrow in Fig. 8. At each doping, the field at which the spin-reorientation transition occurs at 2.5 K was established from the maximum of the derivative of the field dependent transverse magnetoresistance plotted in Fig. 9a. This transition field is shown in Fig. 9b as a function of doping. This field is in reasonable agreement with the maximum of the slope of the magnetization shown for several dopings in Fig. 9c at 2.1 K.
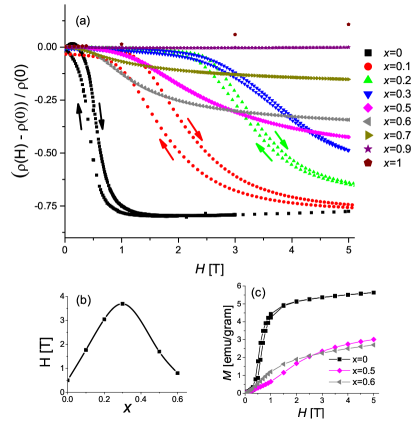
It is interesting to note that in U2RhC2 at 2.5 K the spin-reorientation field is only 0.5 T. This is a remarkably small field compared to the Néel temperature of 22 K, and it is perhaps suggestive of ferromagnetic correlations within the system. The positive Weiss constant in the modified Curie-Weiss fit to the high temperature magnetic susceptibility, discussed above, may also suggest the presence of ferromagnetic correlations. More definitive evidence for these correlations would require further investigation, however, for example by neutron scattering or NMR measurements.
V Superconductivity
Specific heat measurements indicate that superconductivity in U2PtC2 emerges from a renormalized, but otherwise conventional, Fermi liquid state. Fig. 5 shows that is maximal in the parent compound U2PtC2, and is suppressed as the Pt content is reduced. In contrast, the strength of the quantum critical fluctuations, as measured by the magnitude of the upturn in , is maximal close to , and is completely suppressed as Pt content increases towards x=1. This suggests that perhaps the antiferromagnetic quantum fluctuations do not enhance the superconducting pairing. Indeed, recent NMR measurements in U2PtC2 have shown evidence for unconventional superconductivity and more specifically spin-triplet pairing Mounce et al. (2014). Hence, the nature of the superconducting state requires closer investigation.
The of unconventional superconductors that are believed to possess a spin-triplet pairing state is very sensitive to non-magnetic impurities Analytis et al. (2006); Mackenzie et al. (1998). Hence, the reduced in doped samples may arise from the pair breaking arising from additional disorder, rather than a reduction of pairing strength. In this regard, it is surprising that is not already completely suppressed at . The residual resistivity of U2PtC2 is . The mean free path can be estimated from the electronic specific heat coefficient per unit volume , the penetration depth , the residual resistivity , and the Fermi wave-vector , where is the Boltzmann constant, is the effective electron mass, is the permeability of free space, and is the electron scattering time Mermin and Ashcroft (1976). In U2PtC2 we estimate . The intrinsic coherence length is estimated to be , from measurements of the upper critical magnetic field , and the equation , where is the flux quantum. Hence, and U2PtC2 is in the clean limit. However, the residual resistivity in is . Assuming that the effective mass and electron density are not significantly altered by the introduction of 10 Rh, this leads to a reduction of the mean free path to , and is therefore comparable to the coherence length. In the extension of Abrikosov-Gor’kov theory of pair breaking scattering to unconventional superconductivity, in the limit of the superconductivity is predicted to be completely suppressed Abrikosov, AA and Gor’kov (1960); Larkin (1965); Balian and Werthamer (1963). However, is only reduced from 1.45 K in U2PtC2 to 1.09 K in . In addition, little variation of Tc was seen in our measurements of U2PtC2, and previous measurements of U2PtC2 with a residual resistivity of , but was 1.5 K Wu et al. (1994). Such insensitivity to impurities is difficult to reconcile with a scenario of non-s-wave superconductivity. However, several established unconventional superconductors, such as organic Analytis et al. (2006), cuprate Graser et al. (2007), pnictide Fernandes et al. (2012) and heavy-fermion superconductors Smith et al. (1984); Gofryk et al. (2012), deviate from the Abrikosov-Gor’kov theory , with explanations ranging from spatial variation of the gap function Zhitomirsky and Walker (1998), the effect of a combination of magnetic and non magnetic impurities Openov (1998), or interactions between paramagnetic impurities Galitski and Larkin (2002). Hence, a definitive statement about the nature of the superconducting state will require further investigation, and in particular would benefit from the growth of single crystals and detailed studies of the gap symmetry.
VI Conclusion
We have determined the phase diagram of the doping series U2PtxRh(1-x)C2, demonstrating the suppression of the antiferromagnetic phase transition in U2RhC2 to zero temperature close to , where we observe evidence of quantum fluctuations. The antiferromagnetic state undergoes a spin-reorientation transition in an applied magnetic field. The spin-reorientation field is non-monotonic as a function of doping, with a maximum around . Superconductivity is observed for and is maximal in U2PtC2. The suppression of with the increased residual resistivity of the sample is inconsistent with the extension of Abrikosov-Gor’kov theory to unconventional superconductors.
VII Acknowledgments
We thank J. Smith, G. Stewart, G. Meisner and Z. Fisk for useful discussions. Work at LANL was supported by the U.S. Department of Energy, Office of Science, Basic Energy Sciences, Materials Sciences and Engineering Division.
References
- Ott et al. (1983) H. R. Ott, H. Rudigier, Z. Fisk, and J. L. Smith, Phys. Rev. Lett. 50, 1595 (1983).
- Joynt and Taillefer (2002) R. Joynt and L. Taillefer, Rev. Mod. Phys. 74, 235 (2002).
- Aoki et al. (2001) D. Aoki, A. Huxley, E. Ressouche, D. Braithwaite, J. Flouquet, J.-P. Brison, E. Lhotel, and C. Paulsen, Nature 413, 613 (2001).
- Lévy et al. (2005) F. Lévy, I. Sheikin, B. Grenier, and A. Huxley, Science (80-. ). 309, 1343 (2005).
- Meisner et al. (1984) G. P. Meisner, A. L. Giorgi, A. C. Lawson, G. R. Stewart, J. O. Willis, M. S. Wire, and J. L. Smith, Phys. Rev. Lett. 53, 1829 (1984).
- Matthias et al. (1969) B. T. Matthias, C. W. Chu, E. Corenzwit, and D. Wohlleben, Proc. Natl. Acad. Sci. U. S. A. 64, 459 (1969).
- Wu et al. (1994) W. D. Wu, A. Keren, L. P. Le, G. M. Luke, B. J. Sternlieb, Y. J. Uemura, N. Sato, T. Komatsubara, and G. P. Meisner, Hyperfine Interact. 85, 425 (1994).
- Ebel et al. (1996) T. Ebel, K. Wachtmann, and W. Jeitschko, Solid State Commun. 97, 815 (1996).
- Mounce et al. (2014) A. M. Mounce, H. Yasuoka, G. Koutroulakis, N. Ni, E. D. Bauer, F. Ronning, and J. D. Thompson, (2014), arXiv:1408.1969 .
- Bowman et al. (1971) A. L. Bowman, G. P. Arnold, N. H. Krikorian, and W. H. Zachariasen, Acta Crystallogr. Sect. B Struct. Crystallogr. Cryst. Chem. 27, 1067 (1971).
- Huber et al. (1975) J. Huber, M. Maple, and D. Wohlleben, J. Magn. Magn. Mater. 1, 58 (1975).
- Prokes and Klaasse (1998) K. Prokes and J. Klaasse, J. Phys. Condens. Matter 10 (1998).
- Rhodes and Wohlfarth (1963) P. Rhodes and E. P. Wohlfarth, Proc. R. Soc. A Math. Phys. Eng. Sci. 273, 247 (1963).
- D. Matsuda et al. (2003) T. D. Matsuda, N. Metoki, Y. Haga, S. Ikeda, T. Okubo, K. Sugiyama, N. Nakamura, K. Kindo, K. Kaneko, A. Nakamura, E. Yamamoto, and Y. Ōnuki, J. Phys. Soc. Japan 72, 122 (2003).
- Geibel et al. (1991) C. Geibel, C. Schank, S. Thies, H. Kitazawa, C. D. Bredl, A. B hm, M. Rau, A. Grauel, R. Caspary, R. Helfrich, U. Ahlheim, G. Weber, and F. Steglich, Zeitschrift fur Phys. B Condens. Matter 84, 1 (1991).
- Mortensen et al. (1982) K. Mortensen, Y. Tomkiewicz, and K. Bechgaard, Phys. Rev. B 25, 3319 (1982).
- Ott et al. (1984) H. R. Ott, H. Rudigier, P. Delsing, and Z. Fisk, Phys. Rev. Lett. 52, 1551 (1984).
- Arko et al. (1968) A. Arko, J. Marcus, and W. Reed, Phys. Rev. 176 (1968).
- Antonov et al. (1996) V. N. Antonov, A. Y. Perlov, P. M. Oppeneer, A. N. Yaresko, and S. V. Halilov, Phys. Rev. Lett. 77, 5253 (1996).
- Sechovsky et al. (1992) V. Sechovsky, L. Havela, L. Jirman, E. Brück, F. de Boer, H. Nakotte, W. Ye, T. Takabatake, H. Fujii, T. Suzuki, and T. Fujita, Phys. B Condens. Matter 177, 155 (1992).
- Matsukura et al. (1998) F. Matsukura, H. Ohno, A. Shen, and Y. Sugawara, Phys. Rev. B 57, R2037 (1998).
- Analytis et al. (2006) J. G. Analytis, A. Ardavan, S. J. Blundell, R. L. Owen, E. F. Garman, C. Jeynes, and B. J. Powell, Phys. Rev. Lett. 96, 177002 (2006).
- Mackenzie et al. (1998) A. P. Mackenzie, R. K. W. Haselwimmer, A. W. Tyler, G. G. Lonzarich, Y. Mori, S. Nishizaki, and Y. Maeno, Phys. Rev. Lett. 80, 161 (1998).
- Mermin and Ashcroft (1976) N. Mermin and N. Ashcroft, Solid State Physics (Saunders College, 1976).
- Abrikosov, AA and Gor’kov (1960) L. Abrikosov, AA and Gor’kov, Zhur. Eksptl’. i Teoret. Fiz. 39 (1960).
- Larkin (1965) Larkin, JETP 2, 130 (1965).
- Balian and Werthamer (1963) R. Balian and N. R. Werthamer, Phys. Rev. 131, 1553 (1963).
- Graser et al. (2007) S. Graser, P. J. Hirschfeld, L.-Y. Zhu, and T. Dahm, Phys. Rev. B 76, 054516 (2007).
- Fernandes et al. (2012) R. M. Fernandes, M. G. Vavilov, and A. V. Chubukov, Phys. Rev. B 85, 140512 (2012).
- Smith et al. (1984) J. L. Smith, Z. Fisk, J. O. Willis, B. Batlogg, and H. R. Ott, J. Appl. Phys. 55, 1996 (1984).
- Gofryk et al. (2012) K. Gofryk, F. Ronning, J.-X. Zhu, M. N. Ou, P. H. Tobash, S. S. Stoyko, X. Lu, A. Mar, T. Park, E. D. Bauer, J. D. Thompson, and Z. Fisk, Phys. Rev. Lett. 109, 186402 (2012).
- Zhitomirsky and Walker (1998) M. E. Zhitomirsky and M. B. Walker, Phys. Rev. Lett. 80, 5413 (1998).
- Openov (1998) L. A. Openov, Phys. Rev. B 58, 9468 (1998).
- Galitski and Larkin (2002) V. M. Galitski and A. I. Larkin, Phys. Rev. B 66, 064526 (2002).