A one-dimensional Chandrasekhar-mass delayed-detonation model for the broad-lined Type Ia supernova 2002bo
Abstract
We present 1D non-local thermodynamic equilibrium (non-LTE) time-dependent radiative-transfer simulations of a Chandrasekhar-mass delayed-detonation model which synthesizes 0.51 of , and confront our results to the Type Ia supernova (SN Ia) 2002bo over the first 100 days of its evolution. Assuming only homologous expansion, this same model reproduces the bolometric and multi-band light curves, the secondary near-infrared (NIR) maxima, and the optical and NIR spectra. The chemical stratification of our model qualitatively agrees with previous inferences by Stehle et al., but reveals significant quantitative differences for both iron-group and intermediate-mass elements. We show that 0.1 (i.e., 20 per cent) variations in mass have a modest impact on the bolometric and colour evolution of our model. One notable exception is the -band, where a larger abundance of iron-group elements results in less opaque ejecta through ionization effects, our model with more displaying a higher near-UV flux level. In the NIR range, such variations in mass affect the timing of the secondary maxima but not their magnitude, in agreement with observational results. Moreover, the variation in the , , and magnitudes is less than 0.1 mag within 10 days from bolometric maximum, confirming the potential of NIR photometry of SNe Ia for cosmology. Overall, the delayed-detonation mechanism in single Chandrasekhar-mass white dwarf progenitors seems well suited for SN 2002bo and similar SNe Ia displaying a broad Si ii 6355 Å line. Whatever multidimensional processes are at play during the explosion leading to these events, they must conspire to produce an ejecta comparable to our spherically-symmetric model.
keywords:
radiative transfer – supernovae: general – supernovae: individual: SN 2002bo1 Introduction
The most widely-accepted model for Type Ia supernovae is the thermonuclear disruption of a white dwarf (WD) star (Hoyle & Fowler 1960) in a binary system, although there is ongoing discussion about the combustion mode (pure deflagration or delayed detonation), the progenitor mass (Chandrasekhar mass or not), and the nature of the binary companion (another WD or a non-degenerate star). Observational evidence for diversity in the SN Ia population (e.g., van Kerkwijk, Chang & Justham 2010; Badenes & Maoz 2012) seems to require multiple progenitor channels or explosion mechanisms.
In a recent study, we found a promising agreement between a sequence of Chandrasekhar-mass delayed-detonation models and observations of SNe Ia at maximum light (Blondin et al. 2013) [hereafter B13]. The good match between our model DDC15 (0.5 of ) and the standard SN 2002bo motivates an in-depth study of this model at earlier and later times.
Supernova 2002bo was first studied by Benetti et al. (2004), who favour a delayed-detonation explosion for this event based on the presence of intermediate-mass elements (IMEs) at high velocities and the lack of spectral signatures of C i/ii associated with unburnt carbon at early times. Subsequent spectroscopic modeling by Stehle et al. (2005) revealed a chemical stratification qualitatively similar to the fast-deflagration W7 model of Nomoto, Thielemann & Yokoi (1984), but with an offset to higher velocities and strong mixing.
A striking feature of SN 2002bo is the large Doppler width of the Si ii 6355 Å line around maximum light, which places this SN in the “broad-line” subclass of Branch et al. (2006).111Given the associated large blueshift at maximum absorption ( at maximum light), this SN is also part of the “high-velocity” subclass of Wang et al. (2009) and the “high-velocity-gradient” subclass of Benetti et al. (2005). Such a broad Si ii line is systematically predicted in maximum-light spectra of the delayed-detonation models presented in B13.
In the next section we briefly present the numerical setup (hydrodynamics and radiative transfer). The observational data and our method of analysis are presented in Section 3. We then confront the predicted bolometric (Section 4), colour (Section 5), and spectroscopic (Section 6) evolution of our model to observations of SN 2002bo, both in the optical and NIR. We illustrate the sensitivity of our model results to 0.1 (i.e., 20 per cent) variations in mass in Section 7. We compare the abundance distributions of various elements in our input hydrodynamical model with those inferred by Stehle et al. (2005) in Section 8. A discussion on the nature of broad-lined SNe Ia and conclusions follow in Section 9.
2 Numerical setup
The hydrodynamics of the explosion and the radiative-transfer treatment is analogous to that presented in B13 and Dessart et al. (2014c) [hereafter D14c]. We refer the reader to those papers for an in-depth discussion of our numerical setup. As with all our previous SN studies, our models are iterated until convergence is achieved at all depths in the ejecta (see Appendix A).
We use the Chandrasekhar-mass delayed-detonation model DDC15 presented in B13, and summarize its basic properties in Table 1. Unlike B13, we apply a small radial mixing to the hydrodynamical input with a characteristic velocity width to smooth sharp variations in composition (see Dessart et al. 2014a; hereafter D14a). Moreover, we consider additional radioactive decay chains (only decay was considered in B13), resulting in non-negligible energy input beyond 15000 where the ejecta is deficient in (see model DDC10_A4D1 in D14a). More importantly, including the 48Cr 48V 48Ti decay chain leads to a 100-fold increase in the Ti mass fraction in the inner ejecta ( ; see Fig. 1), which influences sizeably the opacity in the -band at maximum light and beyond.
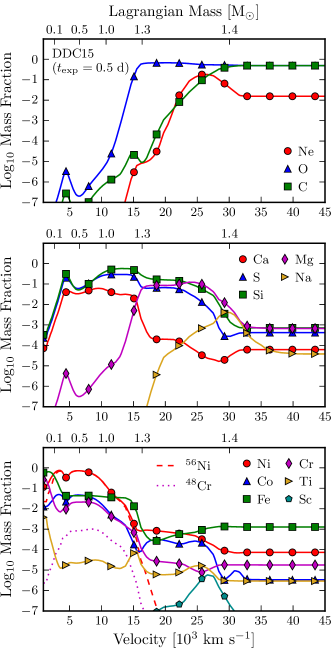
The chemical stratification is typical of standard delayed-detonation models. Iron-group elements (IGEs; Sc to Ni, ) dominate below 10000 . Despite the presence of at 2000 due to our imposed radial mixing, the innermost ejecta are dominated by stable IGEs. Intermediate-mass elements (Na to Ca, ) are most abundant between 10000 and 30000 . The outermost of the ejecta is dominated by the composition of the progenitor WD star (C/O, with traces of 22Ne, and solar abundances for all other elements).
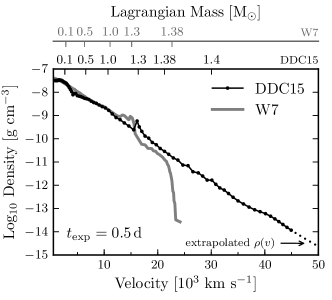
The ejecta density profile at the start of our radiative-transfer calculations (0.5 days past explosion) is shown in Fig. 2. At these times, UV photons still interact with the ejecta material in shells moving at a velocity , so we linearly extrapolate the hydrodynamical input beyond 45000 up to 70000 , as done in D14a (dotted line in Fig. 2). The density profile is reminiscent of standard delayed-detonation models (see, e.g., Khokhlov, Müller & Höflich 1993), with a quasi-exponential decrease with velocity. Also shown is the density profile of the W7 model used as a reference in many SN Ia studies. It is nearly indistinguishable from our model below 10000 (or within a Lagrangian mass coordinate of 1 ). The key difference lies in the amount of mass contained at high velocities: It is a factor of 2 larger beyond 15000 in DDC15, resulting in a 20 per cent larger kinetic energy (1.51051 erg cf. 1.21051 erg for W7; see Table 1). The composition is also drastically different, with IMEs confined to 15000 , while they are abundant beyond 20000 in DDC15.
The radial mixing applied to the hydrodynamical input and the extended radial grid result in small differences in abundance between the DDC15 model presented in B13 and the version used in this paper. In particular, the initial mass for this model is now , cf. in B13 (see their Table 1). These differences only have a modest impact at bolometric maximum: A bolometric rise time of 17.57 d (cf. 17.76 d in B13), a peak bolometric luminosity of 1.14 (cf. 1.22 ), and a colour of 0.04 mag (cf. mag).
In what follows, we use model DDC15 to discuss SN 2002bo and broad-lined SNe Ia in general. However, we also study the sensitivity of our results by comparing the predicted light curves and spectra of delayed-detonation models endowed initially with 20 per cent of mass of (models DDC10 and DDC17 in Table 1). This comparison is particularly instructive to understand the degeneracy (or lack thereof) of SN Ia properties.
| Model | t=0 | Ni | Co | Fe | Ti | Sc | Ca | S | Si | Mg | Na | O | C | |||
|---|---|---|---|---|---|---|---|---|---|---|---|---|---|---|---|---|
| [] | [] | [] | [M☉] | [M☉] | [M☉] | [M☉] | [M☉] | [M☉] | [M☉] | [M☉] | [M☉] | [M☉] | [M☉] | [M☉] | [M☉] | |
| DDC15 | 1.8(7) | 1.465(51) | 1.12(4) | 0.511 | 0.516 | 3.44(-2) | 0.114 | 1.11(-4) | 4.09(-8) | 4.53(-2) | 0.197 | 0.306 | 1.14(-2) | 1.68(-5) | 0.105 | 2.73(-3) |
| DDC10 | 2.3(7) | 1.520(51) | 1.16(4) | 0.623 | 0.622 | 4.11(-2) | 0.115 | 1.10(-4) | 2.90(-8) | 4.10(-2) | 0.166 | 0.257 | 9.95(-3) | 1.25(-5) | 0.101 | 2.16(-3) |
| DDC17 | 1.6(7) | 1.459(51) | 1.08(4) | 0.412 | 0.421 | 2.84(-2) | 0.112 | 1.14(-4) | 6.16(-8) | 4.73(-2) | 0.222 | 0.353 | 1.79(-2) | 2.47(-5) | 0.152 | 3.80(-3) |
3 Observational data and Methodology
Our data on SN 2002bo are mostly taken from Benetti et al. (2004), with additional optical spectra from Blondin et al. (2012) and Silverman et al. (2012). We use the near-infrared () photometry published by Krisciunas et al. (2004). We select spectra whose relative flux calibration agrees with photometry-based colours to within 0.1 mag. As in B13, we adopt a recession velocity for the host galaxy, a distance modulus mag and a total reddening mag.
The method for generating pseudo-bolometric light curves for both models and data is analogous to that presented in B13. We specify each time the bluest and the reddest band used in the integration, such that corresponds to the luminosity (in ) obtained by integrating magnitudes.
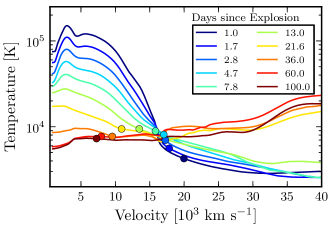
Since there is no good definition of a photosphere through opacity means in SNe Ia, we characterize the spectrum-formation region using the spatial distribution of the optical (3000–10000 Å) flux instead. The fractional contribution to the total flux at wavelength from a given ejecta shell at radius and thickness at time since explosion is:
| (1) |
where is the physical distance, is the projected shell thickness for a ray with impact parameter , is the emissivity along the ray at and , and is the ray optical depth (at ) at the ejecta location . Because of homologous expansion (), surfaces of constant projected velocity are planes perpendicular to the direction. Hence, the quantity mixes contributions from regions with the same radial velocity but with very different projected velocities, hence Doppler shift. The averaged contribution of a shell with velocity (corresponding to ) over the wavelength interval [] is given by:
| (2) |
A representative velocity for the spectrum-formation region in the wavelength range to may be the velocity above which 50% of the flux in that range is emitted, noted , such that:
| (3) |
where the sum in the denominator runs over the entire velocity grid spanned by our simulation.
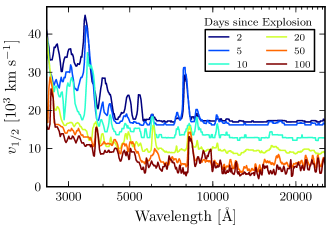
In what follows this velocity is only used for illustration purposes, as the averaging in equation (2) occults the strong variation of with wavelength (Fig. 3). This variation reflects the dominance of line opacity in SN Ia ejecta (see, e.g., Pinto & Eastman 2000).
4 Bolometric Evolution
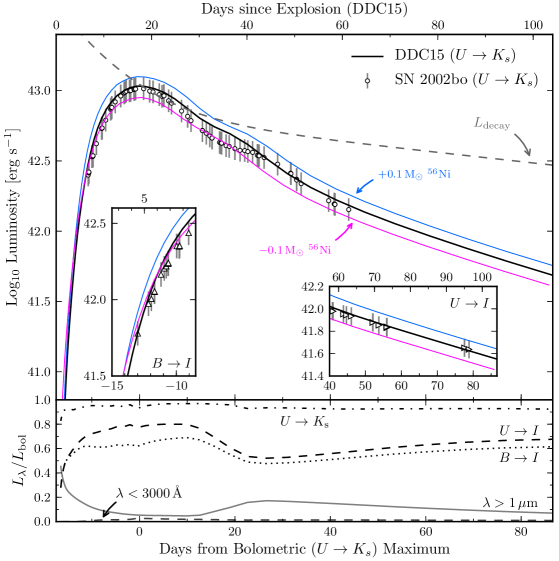
The pseudo-bolometric light curves for both our DDC15 model and SN 2002bo are shown in Fig. 4. Our model predicts a rise to bolometric maximum of 17.6 d, while the first observations of SN 2002bo are 14 days before peak. At these early times, the bolometric evolution is well matched by our model, albeit with a slightly larger luminosity (but still within the errors). This suggests the distribution is adequate, in particular its presence at 15000 . In W7, the mass fraction drops to at 12000 , and the early-time luminosity is significantly lower than observed in SN 2002bo (see also Stehle et al. 2005).
| Model | |||||||
|---|---|---|---|---|---|---|---|
| [] | [d] | [] | [mag] | ||||
| DDC15 | 0.511 | 17.57 | 3.4 | 1.14(43) | 0.72 | 1.04 | 0.95 |
| DDC10 | 0.623 | 17.13 | 3.3 | 1.38(43) | 0.74 | 1.00 | 0.95 |
| DDC17 | 0.412 | 18.60 | 3.3 | 9.10(42) | 0.67 | 0.99 | 0.97 |
A power-law fit to the early ( d) bolometric light curve of model DDC15 yields (Table 2). Deviations from a “fireball” model (for which ; Nugent et al. 2011) are expected theoretically and confirmed observationally, as in the recent SN 2013dy (Zheng et al. 2013). Variations in the early-time luminosity can result from outward mixing of (e.g., Piro & Nakar 2014), or from structural changes in the outer ejecta, as in the pulsational-delayed-detonation models of D14a.
The lower panel of Fig. 4 gives the fractional contribution to the total bolometric luminosity of various filter sets, as well as in the UV ( Å) and IR ( m) ranges. At maximum light, we recover 94 per cent of the true bolometric luminosity with our pseudo-bolometric light curve (see also Table 5). The remaining 6 per cent is mostly emitted blueward of the -band.
From bolometric maximum until the onset of the radioactive tail 35 days later the -ray escape fraction increases from 5 to 50 per cent. The decline in bolometric magnitude between maximum light and 15 days later (noted in Table 2) is 0.72 mag, comparable to that inferred for SN 2002bo based on its pseudo-bolometric light curve (0.85 mag).
Past maximum, the transition to an optically-thin ejecta is concomitant with a shift in ionization and a greater release of radiation energy, causing a small bump in the bolometric light curve around 20 days past maximum light (30 days past maximum in SN 2002bo; see Fig. 4).
Past 30 days from maximum light (50 days since explosion), the bolometric luminosity follows the instantaneous rate of energy deposition. The -ray escape fraction continues to increase, reaching 80 per cent at 100 days past explosion. The late-time ( days past maximum) pseudo-bolometric () decline is compatible with SN 2002bo (0.024 mag day-1 cf. 0.0220.007 mag day-1).
The kinetic energy, mass, and ejecta mass of our model yield a bolometric light curve consistent with observations of SN 2002bo at all times. This represents a compelling check for the standard Chandrasekhar-mass delayed-detonation model for this class of SN Ia light-curve morphology. Moreover, the good match with a 1D model suggests that asymmetries, if present, may only have a minor role in shaping the bolometric light curve of SN 2002bo.
5 Photometric Evolution
The colour evolution of SNe Ia reflects both the global evolution of ejecta properties (temperature, mean ionization) and the wavelength-dependent opacity, and is thus very difficult to accurately model.
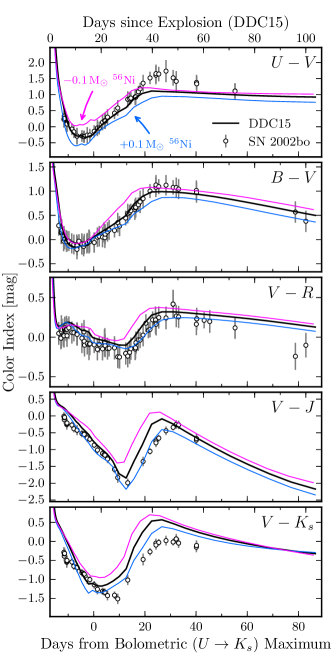
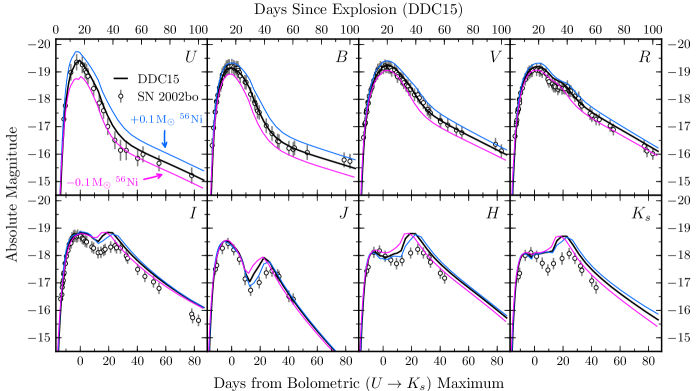
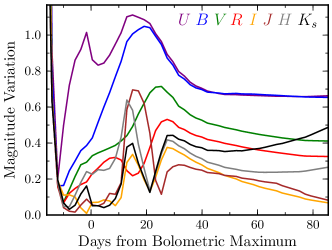
Initially, all bands experience a steep brightening due to the increase in radius. The brightening is steeper for the bluer bands (see the exponent in Table 3) due to the temperature increase in the spectrum-formation layers (solid dots in Fig. 5), which shifts the optical and NIR colours shown in Fig. 6 to the blue. Because of the lower opacity/emissivity compared to the optical, the NIR flux starts to decrease as the spectral energy distribution (SED) hardens, as early as 7 days prior to bolometric maximum for the and bands in model DDC15 (Fig. 7). In SN 2002bo, the initial peak in these bands occurs 3 days later than in our models, similar to the evolution in the band (which is well matched by our model).
| Parameter | ||||||||
| in | ||||||||
| ( d) | ||||||||
| 0.68 (0.70) | 0.61 (0.60) | 2.44 (0.67) | 2.15 (0.54) | 1.47 (0.34) | 1.39 (0.14) | 1.10 (0.14) | 0.84 (0.28) | |
| 24.45 (1.52) | 28.36 (0.39) | 24.93 (0.42) | 24.81 (0.98) | |||||
| (0.22) | (0.11) | (0.10) | (0.09) | (0.10) | (0.14) | (0.14) | (0.14) | |
| (0.13) | (0.13) | (0.14) | (0.15) | |||||
| 1.53 (0.13) | 1.18 (0.07) | 0.70 (0.03) | 0.71 (0.04) | 0.64 (0.03) | 1.65 (0.06) | 0.37 (0.03) | 0.42 (0.07) | |
| 0.019 (0.013) | 0.011 (0.005) | 0.023 (0.003) | 0.033 (0.002) | 0.041 (0.001) |
In the optical, the shorter rise times in the and bands with respect to and reflects the temperature decline in the spectrum-formation region after about one week past explosion. By maximum light, most of the flux originates from layers 15000 where the temperature is decreasing (Fig. 5).
The and colours shift to the red at 10 days past explosion (one week before -band maximum), i.e. 10–20 days before the other colours shown in Fig. 6. This earlier shift in colour results from the increase in opacity from once-ionized IGEs that deplete the flux in and relative to redder bands.
The parameter for our model is 1.03 mag, consistent with that inferred for SN 2002bo ( mag; see Table 3). In the redder optical bands and in the NIR range, the post-maximum decline rate is sensitive to the location of line emission. In the bands, line emission is sufficient to maintain a near-constant flux level despite the overall decline in bolometric luminosity ( mag), while the weaker line emission within the band causes a more pronounced decline ( mag).
At late times, the colours shown in Fig. 6 become progressively bluer despite the near-constant temperature (7000–8000 K in the ejecta layers between 5000 and 15000 ; see Fig. 5): The low ejecta densities favour the formation of forbidden lines, whose wavelength location impacts the colour evolution independent of temperature.
Our model reproduces the complex evolution of the optical and NIR colours of SN 2002bo out to 80 days past maximum light. This gives us confidence that the apparent red colours of SN 2002bo are indeed due to extinction in the host galaxy. Moreover, the observed colour curves are corrected for reddening using the classical Cardelli, Clayton & Mathis (1989) extinction law with a standard value of the total-to-selective extinction ratio .
However, the model is very red within the first 5 days since explosion, where we lack SN 2002bo data. Earlier observations of several other SNe Ia (e.g., SN 2011fe, Nugent et al. 2011; SN 2013dy, Zheng et al. 2013), all of which display a narrower Si ii 6355 Å line than SN 2002bo around maximum, reveal significantly bluer colours than predicted by our model. Such blue colours at early times are difficult to reproduce with standard 1D delayed-detonation models, even with strong outward mixing of , and instead appear to require some form of hydrodynamical interaction to heat up the outer ejecta layers, as in the pulsating delayed-detonation models of D14a.222Although such an interaction serves to decelerate these outer ejecta layers, inhibiting the formation of broad spectral lines as in SN 2002bo. Earlier observations of a broad-lined SN Ia such as SN 2002bo would enable to check the prediction of red early-time optical colours in our model.
6 Spectroscopic Evolution
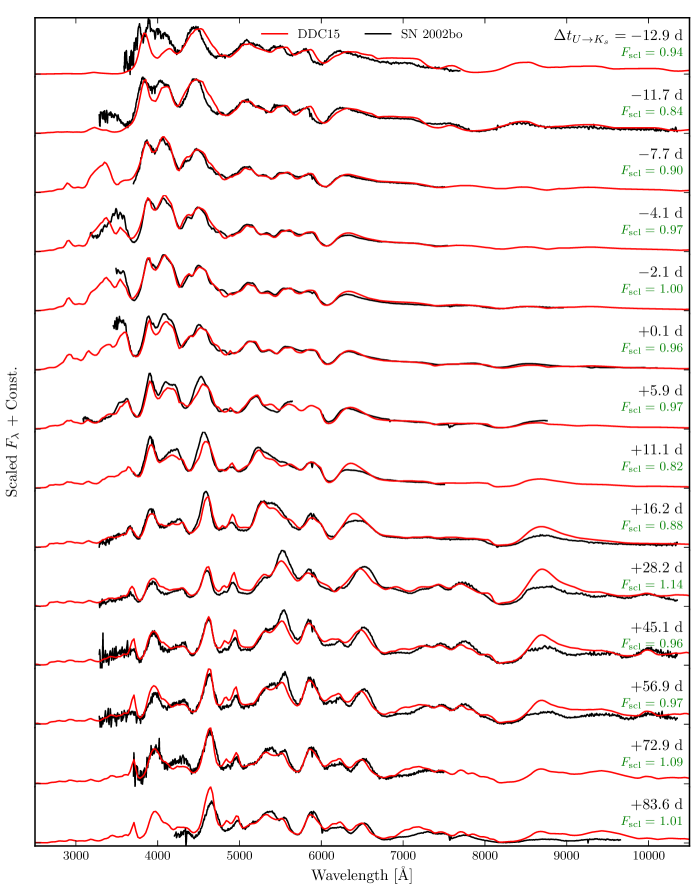
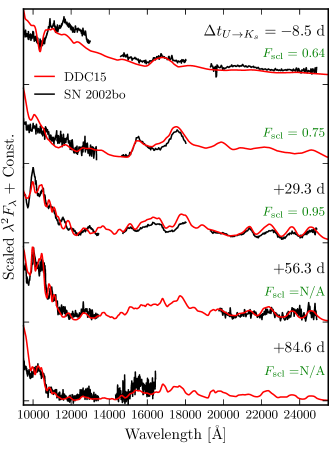
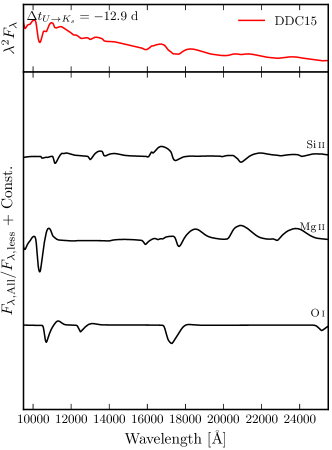
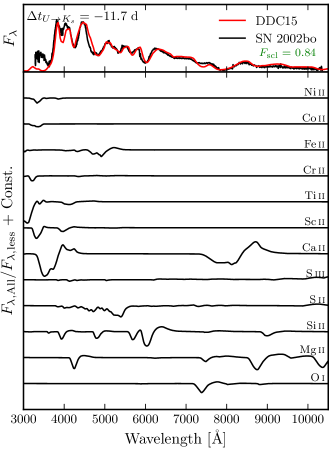
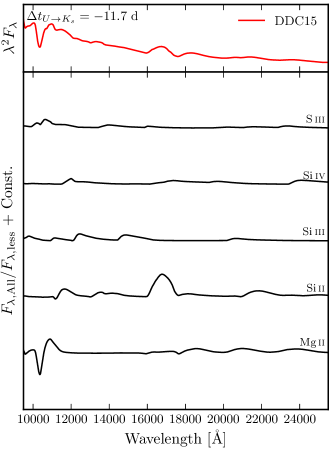
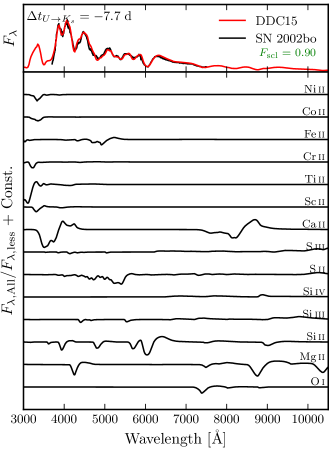
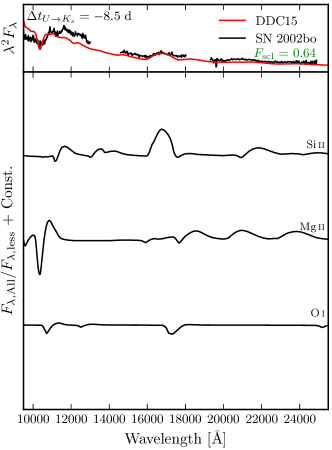
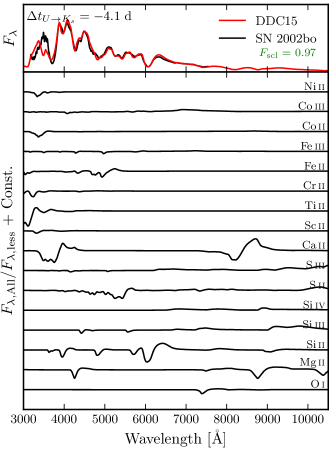
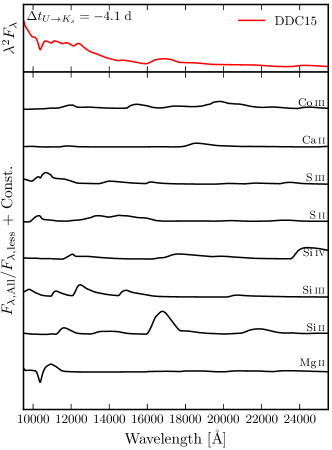
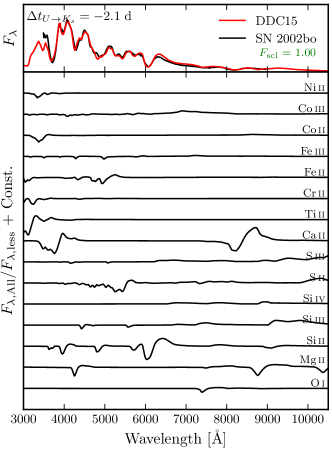
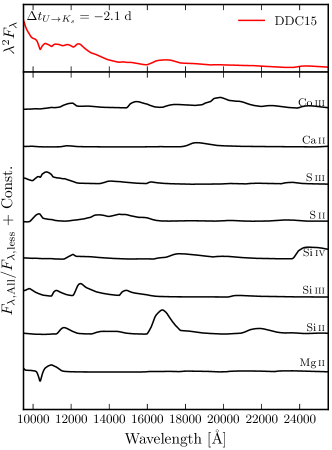
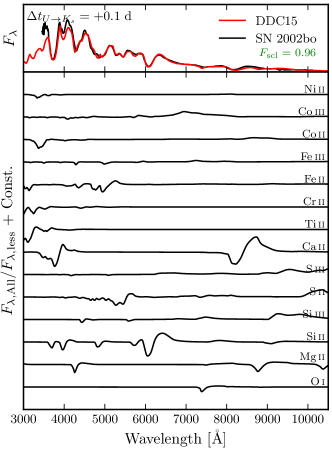
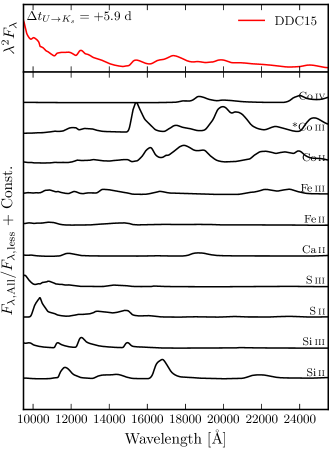
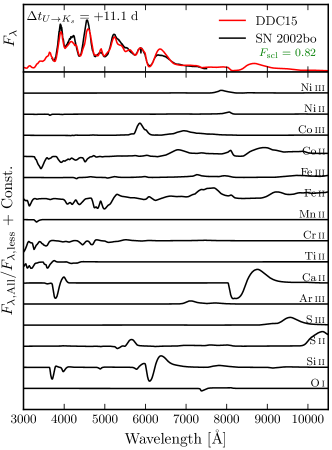
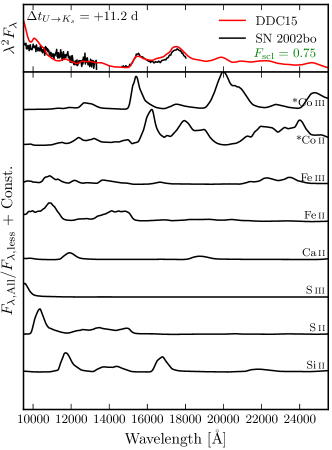
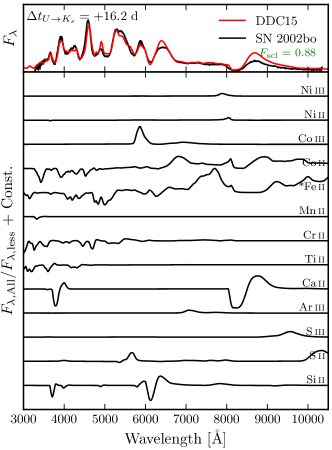
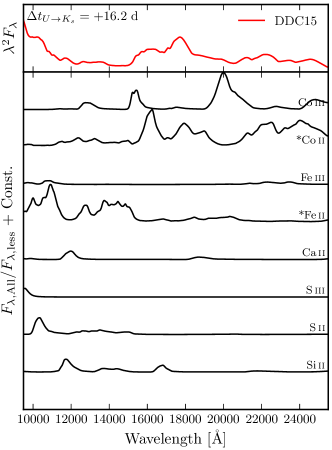
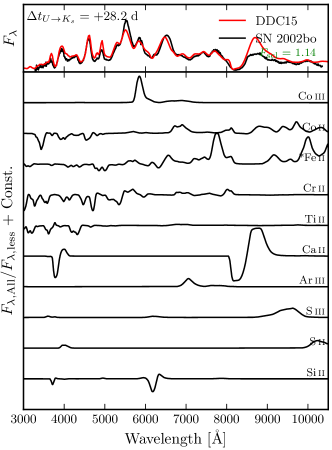
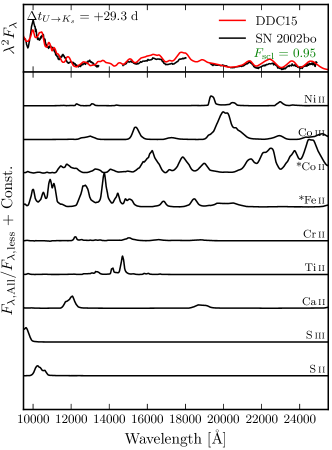
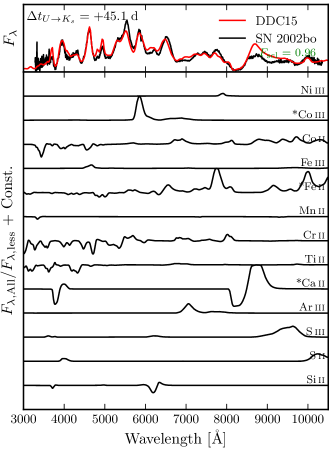
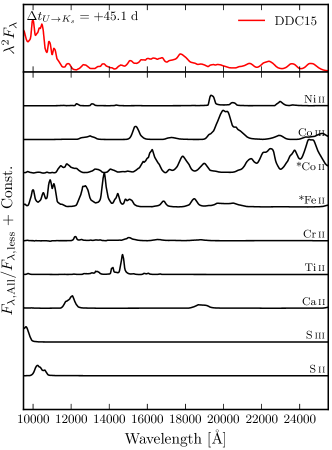
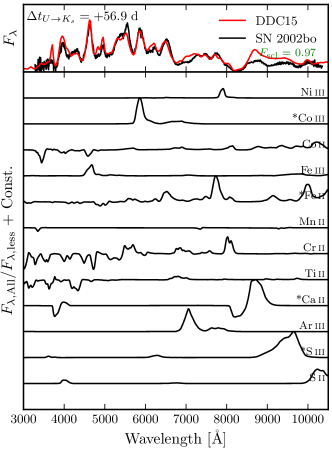
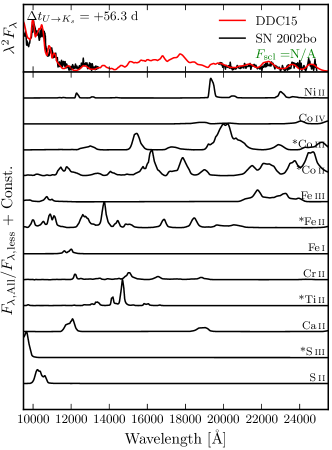
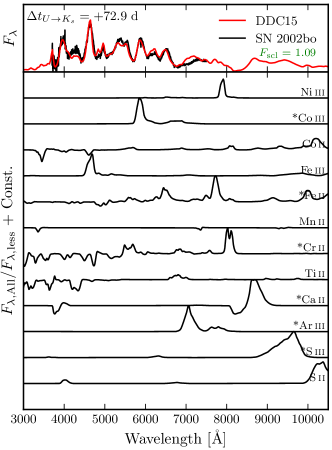
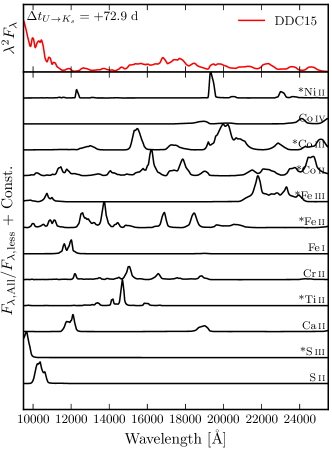
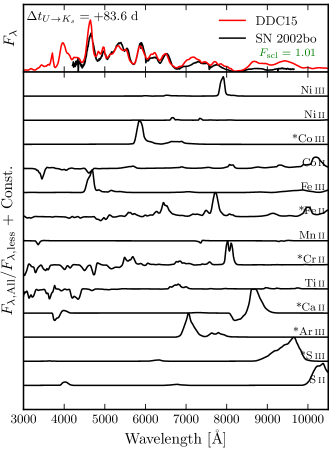
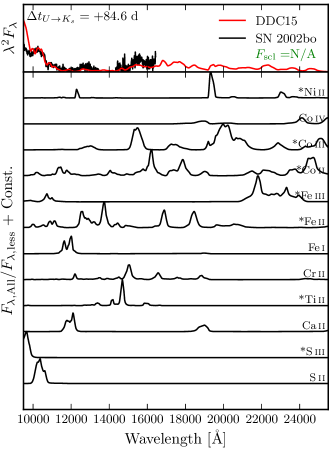
We describe below the evolution of the optical (Fig. 8) and NIR (Fig. 9) spectra of our model and compare them to SN 2002bo observations. Tables with detailed line identifications, and a collection of plots illustrating the influence of individual ions on the synthetic spectra, are available in Appendices C and D, respectively.
6.1 Early evolution
During the first 10 days past explosion, the majority of the optical flux emerges from the IME-rich regions of the ejecta at 15000 . The optical spectrum is thus dominated by broad lines of Mg ii, Si ii, S ii, and Ca ii. We also note the presence of O i 7773 Å, which causes a deep absorption blueward of the Ca ii 8500 Å triplet. Iron-group elements, most notably Sc ii, Ti ii, Cr ii, Fe ii, Co ii, and Ni ii, also contribute to the flux shortward of 5000 Å.
We obtain high-velocity absorption ( blueshifts) in both the Ca ii H & K and 8500 Å triplet features. These remain optically thick well beyond 30000 where the Ca abundance is at its primordial solar value (), but their blue wings are affected by absorption from other lines and thus cannot easily serve as probes of the progenitor metallicity (see also Lentz et al. 2000 in the context of the W7 model). The Si ii 3858 Å line has negligible impact on our synthetic spectra, and the predicted double-absorption feature at 3500 Å seen, e.g., in the d spectrum results from Ca ii alone. Multiple absorption components in both Ca ii features are routinely observed in early-time SN Ia spectra (e.g., Childress et al. 2014).
Unburnt material is located in the outermost (20000 ) low-density layers of the ejecta. This configuration makes the associated spectral signatures of carbon (e.g., C ii 6578 Å) too weak to be visible. The O i 7773 Å line can in principle serve to constrain the amount of unburnt oxygen, but it forms below 25000 in our model and hence results in part from C-burning ash.
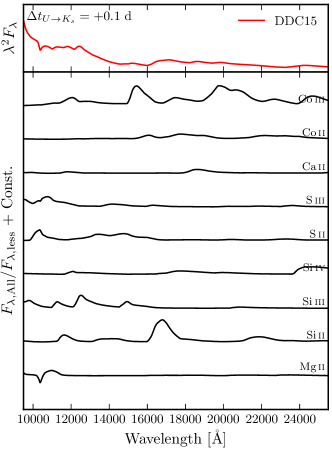
In the NIR range, our model reproduces the overall shape of the earliest spectrum of SN 2002bo at d (9 days past explosion based on model DDC15), but predicts a higher flux level than observed (). Three ions are responsible for the spectral signatures seen: O i, Mg ii, and Si ii (see Fig. C2, upper-right panel). The two most notable features at these early times are a P-Cygni profile due to the Mg ii 10927 Å triplet and a broad emission feature at 1.7 m due to the Si ii 16931 Å doublet.
Lines from IGEs are completely absent from the NIR range at these early times, although lines of Sc ii, Ti ii, Cr ii, and Fe ii–iii (with weaker absorptions from Co ii and Ni ii in the -band) contribute to the optical flux. The majority of the NIR flux emerges from ejecta layers 20000 where most IGEs are at least twice-ionized, and contribute opacity at much shorter wavelengths.
The earliest spectrum at 13 days before bolometric maximum, however, shows that we predict too little flux around 4000 Å, due to excess absorption from Sc ii 4247 Å and several Ti ii lines, and that the blue extent of certain features is not well matched, in particular the Fe ii absorption complex around 4800 Å, and the two Si ii 5972 Å and 6355 Å features. The O i 7773 Å absorption is also too strong in our model. These discrepancies are related to the low ejecta ionization fraction at 20000 (Fig. 5), and suggest a stronger outward mixing of than adopted here. Another possibility is that our extrapolated density profile at large velocity is steeper in reality (see Fig. 2).
6.2 Maximum-light phase
Around maximum light the optical spectra are still dominated by strong lines of singly-ionized IMEs, with IGEs absorbing the flux at 5000 Å. The drop in the Mg and O mass fractions below 15000 results in a gradual weakening of the Mg ii and O i 7773 Å lines and reveals the transition from the C-burning to the O-burning regime. We note the disappearance of the high-velocity absorption associated with Ca ii H&K and the 8500 Å triplet, as these transitions turn thin beyond 20000 .
In the near-infrared, we note the appearance of emission features associated with IGEs, most notably permitted Co ii and forbidden Co iii transitions. There are no published NIR spectra of SN 2002bo around maximum light to compare against our model.
6.3 Post-maximum and transition to nebular phase
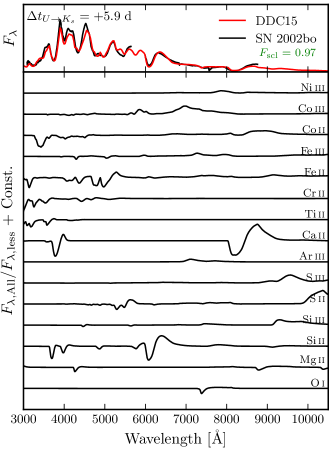
From 10 until 40 days past maximum light the majority of the flux emerges from the outer IGE-rich regions of the ejecta (10000 ). Some strong lines of IMEs survive in the optical range (Si ii, S ii, Ca ii), although they become weaker and narrower with time. Most of the spectrum is now shaped by lines of IGEs such as Ti ii, Cr ii, Fe ii–iii, and Co ii–iii.
The SED becomes redder due to the gradual drop in temperature in the inner ejecta layers. Radiation cooling dominates over expansion cooling, with a growing importance played by forbidden-line transitions. A notable example is the 5900 Å feature, well matched by our model, and associated with [Co iii] 5888 Å. This feature is often mistaken for Na i D (see discussion in Dessart et al. 2014b).
This cooling further enhances absorption by Cr ii/Ti ii transitions around 4000–4300 Å. Several Cr ii lines are responsible for the rapid change in relative flux around 5300 Å between +16.2 d and +28.2 d (Fig. 8), which reflects the rapid evolution of the Cr ii/iii ratio.
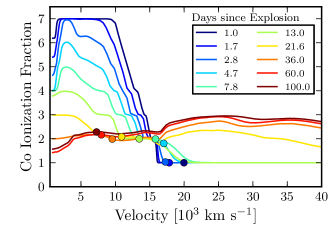
In the NIR, iiiii recombination of IGEs causes a gradual weakening of Co iii lines (primarily forbidden transitions) and a strengthening of Co ii lines (primarily permitted). In some bands ( and ), emission by Co ii is sufficient to maintain a near-constant flux level and causes an earlier shift to the red of the colour curve with respect to (Fig. 6).
The strengthening of the Co ii emission is partly responsible for the mismatch in the Ca ii 8500 Å triplet emission profile between our model and SN 2002bo. Co ii lines blueward of 8500 Å emit photons in the inner ejecta (10000 ) that are redshifted into resonance with the Ca ii 8500 Å triplet transitions in higher-velocity shells (see also D14c). The resulting boost in emissivity explains the slower decline in the -band in our model compared to SN 2002bo (cf. Fig. 7 and Table 3).
6.4 Late-time evolution out to 100 days past explosion
From 40 days past maximum onwards the spectrum-formation region is almost exclusively located in the IGE-rich layers of the ejecta below 10000 . Apart from the two strong Ca ii H&K and 8500 Å triplet features and traces of Si ii 6355 Å, which retain their P-Cygni profile morphology, the only optical lines from IMEs are optically-thin transitions of [S ii], [S iii], and [Ar iii]. Beyond 1m, the only emission from IMEs comes from [S ii] and Ca ii transitions, although the impact on the observed flux is negligible given the overlap with stronger emission from Fe ii and Co ii.
Non-thermal ionization prevents a complete iiiii recombination of IGEs in the inner ejecta, resulting in increasing emission from lines of [Fe iii] and [Co iii], now favoured due to the low ejecta density. Some of these lines represent a fair fraction of the total flux in a given band: At 100 days past explosion, the [Fe iii] 4658 Å and [Co iii] 5888 Å lines alone contribute 15 per cent of the total flux in the and bands, respectively. The ratio of the total flux emitted in both lines follows the increase in the Fe/Co abundance ratio resulting from 56Co 56Fe decay (see also Kuchner et al. 1994). The late-time colour evolution is thus largely determined by the wavelength location of individual strong transitions and no longer reflects the evolution of the ejecta temperature, which remains almost constant in the spectrum-formation region at these times (Fig. 5).
In the NIR, we predict the gradual emergence of [Ni ii] 1.94 m, due to stable Ni in the innermost ejecta ( ; see Fig. 1), resulting from burning at high densities characteristic of a Chandrasekhar-mass WD progenitor (see, e.g., Höflich et al. 2002). However, most of the emission just blueward of 2 m is in fact due to lines of [Co iii] in our model, not [Ni ii] as recently suggested by Friesen et al. (2014) for SNe 2001fe, 2003du, and 2014J based on the 1D delayed-detonation models of Domínguez, Höflich & Straniero (2001). Unfortunately, the NIR spectrum of SN 2002bo at +56.3 d does not cover this feature.
The match between the spectra of model DDC15 and SN 2002bo over the first 100 days of its evolution suggests the composition of the ejecta in our model is adequate at all depths. It also shows our time-dependent radiative-transfer treatment consistently predicts the evolution of the gas properties, in particular its ionization state.
7 Sensitivity to mass
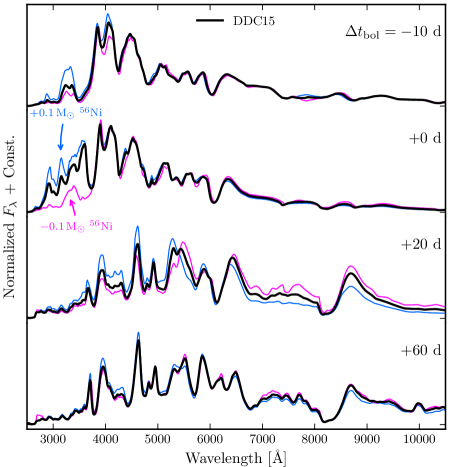
Our model DDC15 seems well suited to match the observed properties of SN 2002bo. In this section, we investigate whether delayed-detonation models with 0.1 (i.e., 20 per cent) variations in mass also provide a satisfactory match to this event (models DDC10 and DDC17 of B13; see Table 1). This is of particular relevance to assess the actual accuracy of abundance determinations in SNe Ia and to understand the degeneracy (or lack thereof) of their properties. We discuss in turn the impact on the early brightening phase (Section 7.1), on the post-maximum decline rate and the width-luminosity relation (7.2), on the late-time evolution (7.3), and on the relative homogeneity of SN Ia properties in the NIR (7.4). Finally, we comment on the impact of the IGE abundance on the near-UV flux level (7.5).
7.1 Early brightening phase and high-velocity features
The early rate of increase in bolometric luminosity is largely insensitive to the mass, as seen through the per cent variation in the power-law exponent in Table 3. The same is true in individual bands, although it is larger in and is hardly noticeable in and the NIR bands (Fig. 7). This suggests that the early-time luminosity, if powered by alone, is more sensitive to mixing than slight variations in total mass (see D14a). Indeed, mixing can increase the mass fraction by several orders of magnitude in the outermost layers (see also Sect. 8) where an increase in mass only results in a modest variation of the outer extent of the distribution (cf. column in Table 1).
Spectroscopically, the effect is most clearly seen in the UV range (blueward of 3500 Å; see Fig. 10), through variations in the absorption by once-ionized IGEs (Sc ii, Ti ii, Cr ii, Fe ii, Co ii, and Ni ii). The relative strength of the high-velocity components to the Ca ii H&K and 8500 Å triplet absorptions also varies significantly amongst our three models. They are weaker in our model with more (DDC10) due to the higher Ca ionization at 25000–35000 . Conversely, the higher excitation in the outer ejecta leads to enhanced absorption in the blue wings of several lines, including the Fe ii absorption complex around 4800 Å. The increase in mass is not sufficient to match the large Si ii 6355 Å blueshift at early times, which might indicate a greater outward mixing of (D14a; see also Baron et al. 2012).
7.2 Post-maximum decline and the width-luminosity relation
The bolometric post-maximum decline rate (parametrized via the parameter in Table 2) changes by less than 0.1 mag from model DDC10 to DDC17. Part of this degeneracy with mass stems from the increase in the -ray escape fraction for models with more . By 20 days past explosion, 10 per cent of the decay energy directly leaks out of the ejecta in model DDC10, cf. only 5 per cent in DDC17.
However, an increase in the mass results in bluer colours at any given time and a more gradual shift to redder colours (Fig. 6), which affects the post-maximum decline rate in the individual bands. In the -band, the parameter varies by mag (0.92, 1.03, and 1.27 mag in order of decreasing mass), or four times the bolometric variation. Despite the relatively narrow range in peak , we can compute a width-luminosity relation (WLR) for these three models: . This WLR is consistent with the observed one for broad-lined SNe Ia in Blondin et al. (2012).
Spectroscopically, the most notable impact of mass (other than the absolute flux difference) is in the Cr ii-dominated region around 5300 Å. As noted in Section 6.3, this region is particularly sensitive to the Cr ionization level.
7.3 Late-time evolution
The late-time bolometric magnitude decline is the same for our three models (0.028 mag day-1), i.e., the rate of change of the -ray escape fraction is nearly identical. This is a natural consequence of the similar density structure and distribution of the inner ejecta in our three Chandrasekhar-mass models.
The spectra are remarkably similar at these times, with minor differences in SED confined to 6000 Å, owing to the more uniform ionization state of IGEs. Variations in Cr ii line opacity continue to affect the flux around 5300 Å. Although not apparent in Fig. 10 due to the flux normalization, the [Co iii] 5888 Å emission strength correlates with mass. This correlation is also present in observations of SNe Ia and supports the association of this feature with cobalt (see Dessart et al. 2014b, and references therein).
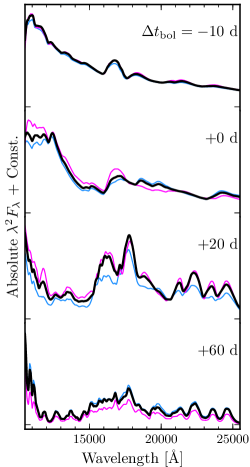
7.4 NIR homogeneity and secondary maxima
An increase in mass causes an earlier hardening of the SED and a delayed cooling of the ejecta. The result is an earlier decline (and hence an earlier first maximum) in the NIR bands (Table 3).
The associated delayed iiiii recombination of IGEs has a stronger impact in the bluest bands, resulting in a larger magnitude variation amongst our three models compared to redder optical and NIR bands (Fig. 11; see also B13, Appendix C). The variation in the , , and magnitudes is less than 0.1 mag (and occasionally less than 0.05 mag) between the epoch of first maximum in those bands up until 10 days past bolometric maximum. Such a small intrinsic dispersion (also reflected in the uniformity of their spectra; see Fig. 10) confirms the potential of NIR photometry of SNe Ia for accurate distance determinations (e.g., Krisciunas, Phillips & Suntzeff 2004).
The same effect delays the time of NIR secondary maxima for larger mass (see also Kasen 2006), but leaves their magnitude unchanged (Table 3), in agreement with observations (Biscardi et al. 2012, their Fig. 8). The result is a larger magnitude variation in the NIR range at 15–20 d from bolometric maximum, even exceeding that in the and bands.
7.5 IGE abundance and near-UV flux level
The 0.1 variation in mass represents a non-negligible variation in the relative abundances of IGEs and IMEs333Since all but of the progenitor WD is burnt in our delayed-detonation models, the 0.1 variation in mass results in a comparable variation (of opposite sign) in IME mass. (see Table 1), which often result in a modest impact on the predicted observables, illustrating the degeneracy of SN Ia properties and the difficulties associated with abundance determinations in these events (see next section).
Part of this degeneracy results from variations in ionization whose impact often supersedes those associated with variations in abundance in determining the ejecta opacity. In the near-UV range, where most of the opacity is due to IGEs, it is our model with less (and hence less IGEs) that has the lowest near-UV flux level relative to the optical up until maximum light (Fig. 10), due to the lower ionization level of Ni/Co/Fe. Our models thus show that an increase in the IGE abundance in SNe Ia does not necessarily result in more opaque ejecta (see also Sauer et al. 2008), which complicates the use of near-UV spectra to constrain the progenitor metallicity (see, e.g., Foley & Kirshner 2013).
The larger sensitivity of the -band flux to the mass of results in a 1 mag variation in this band amongst our three models around maximum light (Fig. 11), and a larger variation in compared to other colour indices (Fig. 6), in line with observational findings (e.g. Jha et al. 2006). This large variation could significantly affect reddening determinations of SNe Ia.
8 Comparison to previous work
In-depth studies of SN 2002bo have been presented by Benetti et al. (2004) and Stehle et al. (2005). The latter study attempts to infer the chemical stratification of the SN 2002bo ejecta based on steady-state spectroscopic modelling under the assumption of a sharp photosphere emitting a pure thermal continuum. Stehle et al. assume an ejecta structure (the density profile of W7 shown in Fig. 2) and vary the abundances in order to reproduce the observed spectra at selected epochs. Their abundance profiles are shown in Fig. 12. For comparison, we overplot the abundance profiles for our model DDC15 and those of W7. The elemental yields are reported in Table 4. We discuss in turn the inferred chemical stratification and the validity of a diffusive inner boundary, which is a fundamental ansatz of the method applied by Stehle et al. (2005).
8.1 Chemical stratification
The most striking difference of our results with those of Stehle et al. (2005) is that they require a large overabundance of IGEs and IMEs in the outer layers ( ) in order to reproduce the broad lines of SN 2002bo, including the blue wings of Fe ii 4800 Å at early times. Although our models possess 1000 times less Ca (by mass) beyond 20000 , the resulting synthetic spectra exhibit high-velocity Ca ii features. Such a huge difference illustrates the difficulties associated with some abundance determinations that are highly sensitive to the ionization balance and outer density structure.
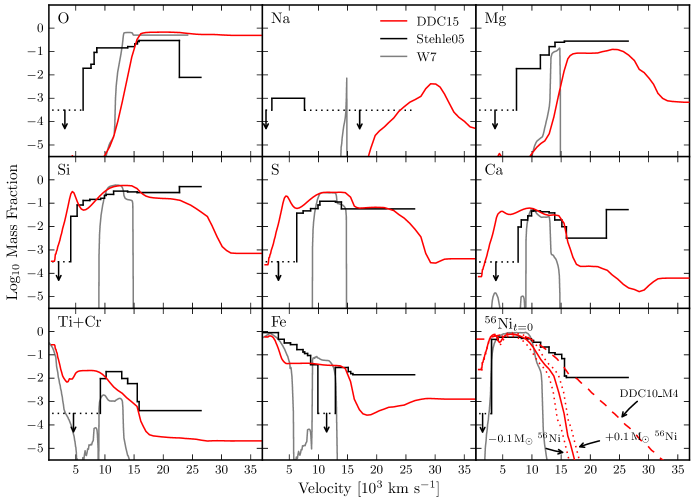
In the intermediate layers (10000–15000 ) the distribution of IMEs is in good agreement with our model, although Stehle et al. (2005) infer a larger Mg abundance (0.08 cf. in our model) in order to reproduce the Mg ii absorption feature around 4200 Å in the early-time spectra. Past maximum light, however, the deep absorption at 4400 Å is caused by several Fe ii lines in our model, not by Mg ii, hence we can reproduce this feature despite the sharp drop in Mg abundance below 15000 . Stehle et al. (2005) also argue for significant downward mixing of oxygen ( above ), when we satisfactorily fit the O i 7773 Å feature up until shortly after maximum light with no oxygen present below .
Contrary to our model, Stehle et al. (2005) infer the presence of Na and the absence of Ti/Cr below . For Na, their abundance constraint is most likely a misidentification of the emission feature at Å past maximum light, which is due to [Co iii] 5888 Å, not Na i (see Dessart et al. 2014b). As for Ti/Cr, several Cr ii lines affect the flux level around 5300 Å past maximum light (Sect. 6.3), so that chromium must be present in the inner ejecta.444At the time their paper was written, Stehle et al. (2005) did not have access to any spectra of SN 2002bo between +6 d and +263 d past -band maximum, and thus could provide only weak constraints on the abundance distribution in these intermediate ejecta layers.
The distribution in our model is comparable to that inferred by Stehle et al. (2005) in the range 5000–10000 , but drops more rapidly beyond 10000 . With our distribution we reproduce the early rise in bolometric luminosity (Fig. 4). Nonetheless, we argued for some additional outward mixing of based on the lack of absorption in the blue wings of several features in the early-time spectra (Sect. 6.1). In fact, the distribution of the mixed model DDC10_M4 of D14a closely matches the distribution of Stehle et al. (2005). Note that we cannot really comment on the distribution below 3000 since we did not evolve our model beyond 100 days past explosion, when most of the flux is expected to emerge from the inner 0.1 of ejecta.
| Species | DDC15 | Stehle05 | W7 |
|---|---|---|---|
| [] | [] | [] | |
| 56Ni | 0.511 | 0.520 | 0.587 |
| Fea | 0.100 | 0.360 | 0.145 |
| TiCr | 0.018 | 0.003 | 0.005 |
| Ca | 0.045 | 0.020 | 0.012 |
| S | 0.197 | 0.067 | 0.085 |
| Si | 0.306 | 0.220 | 0.154 |
| Mg | 0.011 | 0.080 | 0.013 |
| Na | 1.68(-5) | 0.001 | 6.32(-5) |
| O | 0.105 | 0.110 | 0.138 |
| C | 0.003 | 0.002 | 0.047 |
8.2 The validity of a diffusive inner boundary
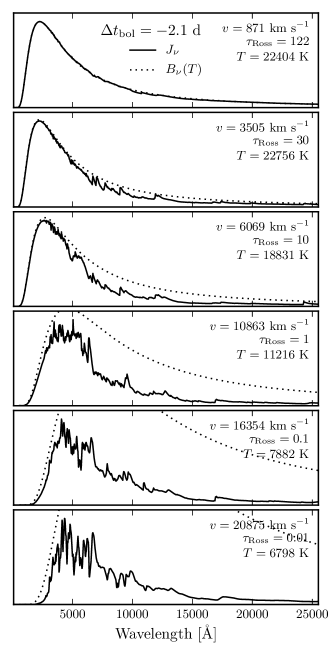
When modelling the early-time spectra of SN 2002bo Stehle et al. (2005) assume there exists a sharp photosphere at a pre-defined velocity emitting a thermal continuum, yet the importance of line scattering in SNe Ia leads to strong departures from local thermodynamic equilibrium (LTE) in both the gas (level populations) and the radiation field (mean intensity ). In our simulations, we solve the non-LTE time-dependent radiative transfer for the whole ejecta, with a zero-flux inner boundary condition at the base of the innermost ejecta shell. We can thus check how and deviate from each other as function of time since explosion, and as a function of depth in the ejecta. In Fig. 13 we illustrate the departures of the mean intensity from a Planckian distribution based on our non-LTE time-dependent radiative transfer calculations with cmfgen for model DDC15 around bolometric maximum.
In the innermost regions, at a Rosseland-mean optical depth ( ), we have at all UV, optical, and NIR wavelengths. Hence, the non-LTE solver recovers LTE conditions, i.e., the radiation and the gas are in equilibrium at the same (local) temperature . At ( ), in the red part of the optical and in the NIR, but the radiation is still Planckian below 5000 Å, where the large number of lines ensures an efficient thermalization. As we progress further out to of 10 and 1 (6000 and 11000 , respectively), drops below even in the UV, although the SED remains smooth below 2500 Å. This persists out to ( ), although is then no longer a good representation of .
Thus, already at an optical depth of several tens, injecting photons with a Planckian distribution would lead to an overestimate of the flux in the red part of the spectrum. The situation is even worse when only the outermost (optically thin) ejecta are treated and one assumes a sharp blackbody emitting photosphere at , as done by Stehle et al. (2005). As a result, they invoke a lower reddening for SN 2002bo than that inferred from observational constraints. In contrast, our full non-LTE solution treats the entire ejecta and yields a satisfactory match to the overall SED at all times with a total reddening mag (Figs. 8–9).
9 Discussion and Conclusion
We have presented a detailed analysis of the photometric and spectroscopic evolution of a 1D Chandrasekhar-mass delayed-detonation model for the Type Ia SN 2002bo. Beyond providing a suitable model for this event, it provides a reference for understanding all SNe Ia similar to that prototype.
The good match we obtain with the light curves and spectra over the first days since explosion gives some support to the standard single-degenerate model for these objects. It remains to be studied whether WD-WD merger models (e.g., Pakmor et al. 2012) can reproduce events like SN 2002bo as well as delayed-detonations of single WDs at the Chandrasekhar mass. The ejected mass distribution of SNe Ia found by Scalzo, Ruiter & Sim (2014) is strongly peaked at 1.4 , yet reveals a significant fraction of sub-Chandrasekhar-mass progenitors, although these are associated with the least luminous events. While it is unclear to what extent a direct confrontation to observations reveals the successes and shortcomings either of the radiative-transfer treatment or of the underlying explosion model (or both), a proper assessment requires treating the entire SN ejecta in non-LTE at all times (see section 8.2).
Our assumption of spherical symmetry and our somewhat artificial treatment of the delayed-detonation mechanism are not detrimental to reproducing the radiative properties of a proto-typical SN Ia. The mild disagreement between our model and SN 2002bo at the earliest times may be resolved by invoking a greater outward mixing of , but could also indicate some fundamental characteristic of the explosion not captured by our artificial, one-dimensional setup.
In B13 we noted a general overestimate of the width of the characteristic Si ii 6355 Å line in our models to account for the bulk of normal SNe Ia. While this was originally flagged as a potential overestimate of the kinetic energy in our input 1D hydrodynamical models, it has since then become clear that the observed diversity in spectral line widths could reflect profound physical differences in the explosion mechanism (in particular, pulsating delayed detonations result in a narrower Si ii 6355 Å line; see D14a). The delayed-detonation models discussed in B13 are thus well-suited to broad-lined SNe Ia.
The observed paucity of C ii lines in the early-time spectra of broad-lined SNe Ia is then physical and not related, for example, to line overlap. In the pulsating delayed-detonation models of D14a, carbon is present down to 15000 , close to the spectrum-formation region at early times. C ii lines are thus predicted in these models, along with a narrower Si ii 6355 Å line profile. The preferential association of C ii detections with narrow-lined SNe Ia (termed “Core Normal” by Branch et al. 2006) is backed up by extensive data sets (e.g., Parrent et al. 2011).
We show that 0.1 variations in mass have a modest impact on the bolometric and colour evolution of our model. Spectroscopically, most of the effect is seen blueward of 3500 Å up until maximum light, our model with less displaying a lower near-UV flux level despite the lower abundance of IGEs. In the NIR, an increase in mass delays the secondary maxima but does not affect their magnitude, as found in observational studies. More importantly, our models confirm the homogeneous nature of SNe Ia in the NIR, with a mag variation in the , , and bands around maximum light.
Allowing for homologous expansion of the ejecta inherited from the hydrodynamical modelling of the explosion, combined with a self-consistent time-dependent radiative-transfer treatment, our models yield a better match to SN 2002bo than previous parametrized approaches. The complex nature of the radiative transfer problem (line overlap, line saturation, uncertain ionization, scattering vs. absorption, non-thermal processes, etc.) does not permit a direct and accurate determination of elemental abundances. Instead, a global modeling of the ejecta to predict simultaneously the bolometric and multi-band light curves, as well as the optical and NIR spectra, allows a better assessment of the adequacy of a given model.
acknowledgements
SB acknowledges useful discussions with Suhail Dhawan and Bruno Leibundgut during a one-month visit to ESO as part of the ESO Scientific Visitor Programme. Thanks to Ken’ichi Nomoto for sending before-decay abundances of the W7 model, and to Stefano Benetti for sending us the NIR spectrum of SN 2002bo at +56.3 days from pseudo-bolometric () maximum. LD and SB acknowledge financial support from the European Community through an International Re-integration Grant, under grant number PIRG04-GA-2008-239184, from “Agence Nationale de la Recherche” grant ANR-2011-Blanc-SIMI-5-6-007-01, and from the Programme National de Physique Stellaire (PNPS) of CNRS/INSU, France. DJH acknowledges support from STScI theory grant HST-AR-12640.01, and NASA theory grant NNX14AB41G. DJH would also like to acknowledge the hospitality and support of the Distinguished Visitor program at the Research School of Astronomy and Astrophysics (RSAA) at the Australian National University (ANU). This work was granted access to the HPC resources of CINES under the allocation c2013046608 and c2014046608 made by GENCI (Grand Equipement National de Calcul Intensif). This research has made use of the CfA Supernova Archive, which is funded in part by the National Science Foundation through grant AST 0907903, of the Online Supernova Spectrum Archive (SUSPECT; http://www.nhn.ou.edu/ suspect/), of the UC Berkeley Supernova Database (http://hercules.berkeley.edu/database/index_public.html), and of the NASA/IPAC Extragalactic Database (NED) which is operated by the Jet Propulsion Laboratory, California Institute of Technology, under contract with the National Aeronautics and Space Administration.
Appendix A Convergence
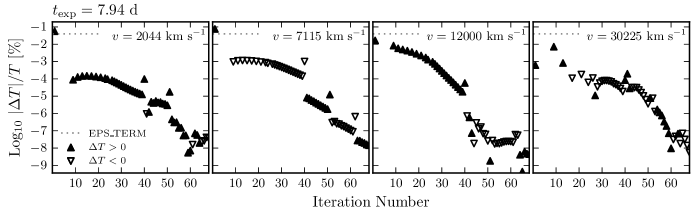
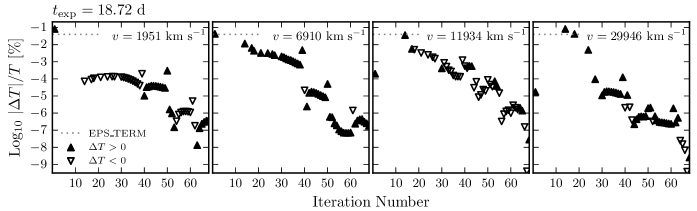
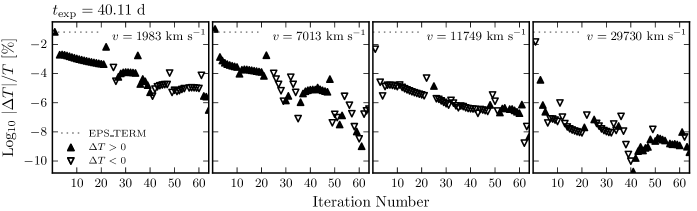
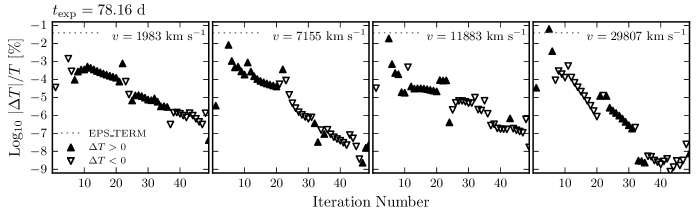
cmfgen employs an iterative method for solving the statistical and radiative equilibrium equations (see Hillier 1990). A model is converged when the maximum correction to any of the variables involved (temperature, electron density, and level populations) at all depths falls below some pre-defined value set by the EPS_TERM parameter (typically %). The vast majority of corrections are well below this limit.
We illustrate the convergence properties of our DDC15 model in Fig. 14, at four selected time steps and for four different ejecta locations. We only show the temperature, since its rate of convergence largely determines the global convergence properties of the model. Since small corrections to the temperature can result in potentially large corrections of the level populations, the temperature corrections are orders of magnitude less than EPS_TERM by the time convergence is achieved (typically in 40–70 iterations).
After the first iteration, the temperature is set to that obtained via a grey calculation, and the fractional change is with respect to the converged solution of the previous time step, hence the potentially large correction (%) associated with the first datum. The temperature is then held fixed (i.e. the temperature correction is zero) during a series of and full iterations in order to stabilize the corrections to the level populations (see Hillier & Dessart 2012). Sharp variations in the temperature correction result from Ng accelerations (Ng 1974), used periodically to increase the convergence rate. Various diagnostics, such as electron energy balance, global energy conservation, and ionization equilibrium, are available as independent checks of the convergence.
Appendix B Bolometric luminosity and absolute magnitudes
Table 5 lists the bolometric and pseudo-bolometric () luminosities, as well as the optical-NIR absolute magnitudes of model DDC15 as a function of time since explosion.
| [d] | [erg s-1] | [erg s-1] | [mag] | [mag] | [mag] | [mag] | [mag] | [mag] | [mag] | [mag] |
|---|---|---|---|---|---|---|---|---|---|---|
| 0.98 | 6.02(39) | 4.98(39) | 5.64 | 7.79 | 9.85 | 11.26 | 11.22 | 12.43 | 12.47 | 12.65 |
| 1.07 | 8.71(39) | 7.37(39) | 5.68 | 8.40 | 10.45 | 11.77 | 11.67 | 12.74 | 12.80 | 12.93 |
| 1.18 | 1.27(40) | 1.10(40) | 6.11 | 9.00 | 11.05 | 12.27 | 12.14 | 13.05 | 13.12 | 13.22 |
| 1.30 | 1.84(40) | 1.63(40) | 6.65 | 9.61 | 11.62 | 12.74 | 12.61 | 13.36 | 13.44 | 13.52 |
| 1.43 | 2.62(40) | 2.37(40) | 7.38 | 10.26 | 12.16 | 13.14 | 13.01 | 13.65 | 13.75 | 13.82 |
| 1.57 | 3.69(40) | 3.37(40) | 8.28 | 10.91 | 12.68 | 13.52 | 13.37 | 13.95 | 14.05 | 14.11 |
| 1.73 | 5.15(40) | 4.72(40) | 9.24 | 11.54 | 13.16 | 13.87 | 13.71 | 14.24 | 14.33 | 14.39 |
| 1.90 | 7.06(40) | 6.48(40) | 10.13 | 12.11 | 13.60 | 14.18 | 14.01 | 14.51 | 14.60 | 14.65 |
| 2.09 | 9.65(40) | 8.85(40) | 10.93 | 12.63 | 14.03 | 14.48 | 14.31 | 14.78 | 14.87 | 14.93 |
| 2.30 | 1.31(41) | 1.20(41) | 11.61 | 13.11 | 14.42 | 14.76 | 14.61 | 15.06 | 15.14 | 15.20 |
| 2.53 | 1.76(41) | 1.60(41) | 12.23 | 13.55 | 14.79 | 15.04 | 14.89 | 15.33 | 15.40 | 15.46 |
| 2.78 | 2.33(41) | 2.13(41) | 12.84 | 13.98 | 15.11 | 15.32 | 15.16 | 15.59 | 15.64 | 15.72 |
| 3.06 | 3.11(41) | 2.84(41) | 13.43 | 14.40 | 15.43 | 15.60 | 15.43 | 15.86 | 15.89 | 15.98 |
| 3.37 | 4.17(41) | 3.83(41) | 14.01 | 14.84 | 15.74 | 15.89 | 15.70 | 16.13 | 16.15 | 16.24 |
| 3.70 | 5.67(41) | 5.20(41) | 14.57 | 15.29 | 16.06 | 16.20 | 15.99 | 16.42 | 16.42 | 16.51 |
| 4.07 | 7.63(41) | 7.05(41) | 15.07 | 15.73 | 16.35 | 16.49 | 16.26 | 16.68 | 16.68 | 16.76 |
| 4.48 | 1.02(42) | 9.50(41) | 15.54 | 16.17 | 16.64 | 16.78 | 16.53 | 16.95 | 16.93 | 16.99 |
| 4.93 | 1.36(42) | 1.27(42) | 15.99 | 16.58 | 16.91 | 17.06 | 16.79 | 17.19 | 17.16 | 17.21 |
| 5.42 | 1.78(42) | 1.67(42) | 16.43 | 16.96 | 17.16 | 17.33 | 17.04 | 17.43 | 17.37 | 17.39 |
| 5.96 | 2.32(42) | 2.19(42) | 16.87 | 17.31 | 17.41 | 17.58 | 17.30 | 17.64 | 17.56 | 17.56 |
| 6.56 | 2.98(42) | 2.83(42) | 17.31 | 17.63 | 17.64 | 17.82 | 17.58 | 17.83 | 17.73 | 17.70 |
| 7.22 | 3.78(42) | 3.60(42) | 17.72 | 17.92 | 17.85 | 18.04 | 17.84 | 17.99 | 17.87 | 17.83 |
| 7.94 | 4.70(42) | 4.48(42) | 18.09 | 18.17 | 18.06 | 18.25 | 18.07 | 18.14 | 17.98 | 17.93 |
| 8.73 | 5.70(42) | 5.42(42) | 18.39 | 18.39 | 18.25 | 18.43 | 18.25 | 18.26 | 18.06 | 18.00 |
| 9.60 | 6.74(42) | 6.40(42) | 18.65 | 18.59 | 18.43 | 18.59 | 18.40 | 18.36 | 18.10 | 18.05 |
| 10.56 | 7.80(42) | 7.40(42) | 18.88 | 18.76 | 18.60 | 18.73 | 18.52 | 18.43 | 18.12 | 18.06 |
| 11.62 | 8.78(42) | 8.34(42) | 19.04 | 18.89 | 18.75 | 18.86 | 18.62 | 18.51 | 18.13 | 18.07 |
| 12.78 | 9.63(42) | 9.22(42) | 19.15 | 19.01 | 18.88 | 18.97 | 18.67 | 18.53 | 18.10 | 18.04 |
| 14.06 | 1.05(43) | 9.90(42) | 19.31 | 19.10 | 18.97 | 19.05 | 18.72 | 18.53 | 18.04 | 17.98 |
| 15.47 | 1.09(43) | 1.05(43) | 19.36 | 19.14 | 19.05 | 19.12 | 18.74 | 18.50 | 17.99 | 17.94 |
| 17.02 | 1.16(43) | 1.08(43) | 19.42 | 19.14 | 19.17 | 19.17 | 18.83 | 18.45 | 17.98 | 18.07 |
| 18.72 | 1.13(43) | 1.07(43) | 19.31 | 19.12 | 19.21 | 19.19 | 18.83 | 18.35 | 17.94 | 18.05 |
| 20.59 | 1.08(43) | 1.03(43) | 19.18 | 19.07 | 19.23 | 19.19 | 18.81 | 18.24 | 17.95 | 18.06 |
| 22.65 | 1.00(43) | 9.70(42) | 19.02 | 18.99 | 19.21 | 19.16 | 18.77 | 18.09 | 18.00 | 18.08 |
| 24.91 | 9.01(42) | 8.72(42) | 18.82 | 18.85 | 19.16 | 19.08 | 18.70 | 17.81 | 18.06 | 18.11 |
| 27.40 | 7.76(42) | 7.51(42) | 18.57 | 18.65 | 19.05 | 18.95 | 18.59 | 17.33 | 18.09 | 18.13 |
| 30.14 | 6.56(42) | 6.36(42) | 18.29 | 18.39 | 18.89 | 18.79 | 18.52 | 17.05 | 18.18 | 18.17 |
| 33.15 | 5.74(42) | 5.54(42) | 17.83 | 17.97 | 18.70 | 18.70 | 18.72 | 17.34 | 18.62 | 18.54 |
| 36.46 | 5.14(42) | 4.93(42) | 17.43 | 17.58 | 18.47 | 18.61 | 18.85 | 17.61 | 18.80 | 18.70 |
| 40.11 | 4.47(42) | 4.15(42) | 17.05 | 17.18 | 18.17 | 18.45 | 18.83 | 17.92 | 18.80 | 18.70 |
| 44.12 | 3.51(42) | 3.28(42) | 16.75 | 16.86 | 17.85 | 18.17 | 18.58 | 17.76 | 18.53 | 18.41 |
| 48.53 | 2.74(42) | 2.56(42) | 16.50 | 16.61 | 17.59 | 17.91 | 18.30 | 17.35 | 18.22 | 18.05 |
| 53.38 | 2.20(42) | 2.05(42) | 16.31 | 16.42 | 17.38 | 17.69 | 18.03 | 16.92 | 17.92 | 17.72 |
| 58.72 | 1.80(42) | 1.67(42) | 16.15 | 16.27 | 17.20 | 17.49 | 17.76 | 16.50 | 17.64 | 17.43 |
| 64.59 | 1.48(42) | 1.37(42) | 16.00 | 16.14 | 17.03 | 17.30 | 17.49 | 16.08 | 17.37 | 17.15 |
| 71.05 | 1.22(42) | 1.13(42) | 15.84 | 16.02 | 16.85 | 17.10 | 17.21 | 15.65 | 17.09 | 16.87 |
| 78.16 | 1.00(42) | 9.29(41) | 15.68 | 15.90 | 16.66 | 16.89 | 16.94 | 15.20 | 16.80 | 16.59 |
| 86.00 | 8.15(41) | 7.56(41) | 15.49 | 15.77 | 16.45 | 16.65 | 16.66 | 14.74 | 16.48 | 16.29 |
| 94.60 | 6.57(41) | 6.10(41) | 15.29 | 15.63 | 16.23 | 16.39 | 16.38 | 14.26 | 16.12 | 15.98 |
| 104.10 | 5.26(41) | 4.86(41) | 15.05 | 15.48 | 15.98 | 16.10 | 16.10 | 13.81 | 15.73 | 15.66 |
Appendix C Strong lines
In tables 6– 20 we report the strongest lines in the optical (3000-10000 Å) and NIR (1–2.5 m) ranges at a given time between 4.1 d and 104.1 d past explosion ( d and +86.5 d from bolometric maximum). A line is considered strong when its absolute Sobolev equivalent width (EW) exceeds 10 per cent of the largest absolute EW within of the line’s central wavelength. Forbidden and semi-forbidden transitions are noted using the appropriate brackets around the line wavelength (in air). We highlight transitions connected to the ground state with a “” symbol. These tables are meant to serve as a guide for line identification in spectra of SNe Ia similar to SN 2002bo. However, we caution the reader that the Sobolev EWs are only approximate and neglect important effects such as line overlap. Moreover, lines with a P-Cygni profile morphology may be important contributors to the resulting spectrum yet yield a small absolute EW. This explains for instance why the strong Ca ii K line (3934 Å) does not show up in Table C2 ( d) where Fig. D1 shows the strong impact of the Ca ii H&K feature on the optical spectra at these times, and the Ca ii K line indeed appears in Tables C1 ( d) and C3 ( d).
| d ( d) | ||
| 3000–10000 Å | 1.0–2.5 m | |
| Ion | [Å] | [m] |
| O i | 9266.01 | 1.316 |
| Mg ii | 7896.37 | 1.009 |
| 1.091 | ||
| 1.863 | ||
| 2.137 | ||
| 2.404 | ||
| Al ii | 7042.08 | 1.008 |
| Si ii | 5978.93 | 1.175 |
| 6347.11 | 1.370 | |
| 9412.63 | 1.445 | |
| 1.691 | ||
| 1.947 | ||
| Si iii | 4828.95 | 1.250 |
| 5739.73 | ||
| S ii | 4162.67 | 1.523 |
| S iii | 6755.65 | |
| 7171.58 | ||
| Ar ii | 4348.06 | |
| Ca ii | 3933.66† | 1.184 |
| 8542.09 | ||
| Ti ii | 3088.04 | |
| 3234.52 | ||
| 3349.41 | ||
| 3759.30 | ||
| Cr ii | 3124.97 | |
| Fe ii | 3002.65 | |
| Fe iii | 4419.60 | |
| 5156.11 | ||
| Co ii | 3501.72 | |
| Ni ii | 3513.99 | |
| d ( d) | ||
|---|---|---|
| 3000–10000 Å | 1.0–2.5 m | |
| Ion | [Å] | [m] |
| O i | 7771.94 | 1.316 |
| Mg ii | 7896.37 | 1.091 |
| 1.863 | ||
| 2.137 | ||
| 2.404 | ||
| Al ii | 7042.08 | 1.008 |
| Si ii | 5978.93 | 1.175 |
| 6347.11 | 1.370 | |
| 9412.63 | 1.445 | |
| 1.691 | ||
| Si iii | 4552.62 | 1.250 |
| 4828.95 | 1.502 | |
| 5739.73 | ||
| 7466.32 | ||
| 8262.57 | ||
| 9799.91 | ||
| S ii | 5453.85 | 1.318 |
| S iii | 3497.28 | 1.032 |
| 3838.27 | ||
| 4253.50 | ||
| 5219.31 | ||
| 6755.65 | ||
| 7171.58 | ||
| Ar ii | 4806.02 | |
| Ca ii | 8542.09 | 1.856 |
| Sc ii | 3572.53 | |
| Ti ii | 3088.04 | |
| 3234.52 | ||
| Cr ii | 3124.97 | |
| Fe ii | 3002.65 | |
| Fe iii | 5156.11 | |
| Ni ii | 3087.07 | |
| d ( d) | ||
|---|---|---|
| 3000–10000 Å | 1.0–2.5 m | |
| Ion | [Å] | [m] |
| O i | 7771.94 | 1.316 |
| Mg ii | 9218.25 | 1.091 |
| Si ii | 6347.11 | 1.370 |
| 1.691 | ||
| 2.199 | ||
| Si iii | 4552.62 | 1.134 |
| 4828.95 | 1.250 | |
| 5739.73 | 1.502 | |
| 7466.32 | 2.093 | |
| 8262.57 | ||
| 9323.89 | ||
| 9799.91 | ||
| Si iv | 6701.21 | 1.190 |
| 7720.37 | 1.855 | |
| 8957.25 | 1.985 | |
| 2.426 | ||
| S ii | 5453.85 | 1.318 |
| S iii | 3234.01 | 1.032 |
| 3497.28 | 1.421 | |
| 4253.50 | ||
| 5219.31 | ||
| S iv | 6140.66 | |
| 7003.27 | ||
| Ar ii | 4806.02 | |
| Ar iii | 7988.48 | 1.312 |
| Ca ii | 3933.66† | 1.856 |
| 8542.09 | ||
| Ti ii | 3349.41 | |
| Cr ii | 3124.97 | |
| Fe ii | 5169.03 | |
| Fe iii | 3013.13 | |
| Co ii | 3501.72 | |
| Co iii | 3010.88 | |
| Ni ii | 3513.99 | |
| d ( d) | ||
|---|---|---|
| 3000–10000 Å | 1.0–2.5 m | |
| Ion | [Å] | [m] |
| O i | 7771.94 | |
| Mg ii | 9218.25 | 1.091 |
| Si ii | 5978.93 | 1.370 |
| 6347.11 | 1.691 | |
| 2.199 | ||
| Si iii | 4552.62 | 1.134 |
| 5739.73 | 1.250 | |
| 7466.32 | 1.502 | |
| 8262.57 | 2.093 | |
| 9323.89 | ||
| Si iv | 6701.21 | 1.190 |
| 7720.37 | 1.855 | |
| 8957.25 | 1.985 | |
| 2.426 | ||
| S ii | 4815.55 | 1.362 |
| 5453.85 | ||
| S iii | 3497.28 | 1.032 |
| 4253.50 | 1.421 | |
| 5219.31 | ||
| S iv | 7003.27 | |
| Ar ii | 4806.02 | |
| Ar iii | [7135.79]† | 1.312 |
| Ca ii | 3933.66† | 1.856 |
| 8542.09 | ||
| Ti ii | 3349.41 | |
| Cr ii | 3124.97 | |
| Fe ii | 5169.03 | |
| Fe iii | 3013.13 | |
| Co ii | 3501.72 | 2.221 |
| Co iii | 3010.88 | [2.281] |
| 3305.27 | ||
| Co iv | 8033.21 | |
| Ni ii | 3513.99 | |
| d ( d) | ||
|---|---|---|
| 3000–10000 Å | 1.0–2.5 m | |
| Ion | [Å] | [m] |
| O i | 7771.94 | |
| Mg ii | 9218.25 | 1.091 |
| Si ii | 6347.11 | 1.691 |
| 2.199 | ||
| Si iii | 4552.62 | 1.134 |
| 5739.73 | 1.250 | |
| 7466.32 | 1.502 | |
| 9323.89 | ||
| Si iv | 6701.21 | 1.190 |
| 7720.37 | 1.855 | |
| 2.426 | ||
| S ii | 5453.85 | 1.362 |
| S iii | 3497.28 | 1.032 |
| 4253.50 | 1.421 | |
| 5219.31 | ||
| S iv | 7003.27 | |
| Ar ii | 4806.02 | 1.047 |
| Ar iii | [7135.79]† | 1.440 |
| Ca ii | 3933.66† | 1.856 |
| 8542.09 | ||
| Ti ii | 3349.41 | |
| Cr ii | 3124.97 | |
| Fe ii | 5169.03 | |
| Fe iii | 3013.13 | |
| Fe iv | 1.868 | |
| Co ii | 3501.72 | 2.221 |
| Co iii | 3010.88 | [2.002] |
| 3305.27 | [2.097] | |
| 4740.66 | [2.281] | |
| Co iv | 8033.21 | |
| Ni ii | 3513.99 | |
| Ni iii | 4874.95 | |
| d ( d) | ||
|---|---|---|
| 3000–10000 Å | 1.0–2.5 m | |
| Ion | [Å] | [m] |
| O i | 7771.94 | |
| Mg ii | 7896.37 | 1.091 |
| Si ii | 6347.11 | 1.175 |
| 1.370 | ||
| 1.691 | ||
| 2.199 | ||
| Si iii | 4552.62 | 1.134 |
| 5739.73 | 1.250 | |
| 7466.32 | ||
| 9323.89 | ||
| S ii | 5453.85 | 1.362 |
| S iii | 3497.28 | 1.032 |
| 4253.50 | 1.421 | |
| 5219.31 | 2.374 | |
| 6755.65 | ||
| Ar ii | 4806.02 | 1.047 |
| Ar iii | [7135.79]† | 1.312 |
| Ca ii | 3933.66† | 1.885 |
| 8542.09 | ||
| Cr ii | 3124.97 | |
| Fe ii | 5169.03 | |
| Fe iii | 5156.11 | [2.218] |
| Co ii | 3501.71 | 1.777 |
| Co iii | 3010.88 | [1.548] |
| 3305.27 | [2.002] | |
| 4740.66 | [2.097] | |
| 5544.79 | [2.281] | |
| 6078.55 | [2.473] | |
| Ni ii | 3513.99 | |
| Ni iii | [7889.93] | 1.001 |
| d ( d) | ||
|---|---|---|
| 3000–10000 Å | 1.0–2.5 m | |
| Ion | [Å] | [m] |
| O i | 7771.94 | |
| Mg ii | 9218.25 | 1.091 |
| Si ii | 6347.11 | 1.175 |
| 1.445 | ||
| 1.691 | ||
| Si iii | 5739.73 | 1.134 |
| 9323.89 | 1.250 | |
| S ii | 5453.85 | [1.032] |
| S iii | 4253.50 | 1.087 |
| Ar ii | 6643.69 | |
| Ar iii | [7135.79]† | |
| Ca ii | 3933.66† | 1.184 |
| 8542.09 | ||
| Ti ii | 3349.41 | |
| Cr ii | 3132.05 | |
| Fe ii | 3002.65 | 1.086 |
| Fe iii | 4419.60 | 1.365 |
| 5156.11 | ||
| Fe iv | [7925.02] | [1.076] |
| Co ii | 3621.20 | 1.606 |
| Co iii | 3151.40] | [1.548] |
| 3259.60 | [2.002] | |
| 3782.18 | [2.097] | |
| 4740.66 | [2.281] | |
| 6994.09 | [2.473] | |
| Co iv | [7902.03] | [1.871] |
| [2.382] | ||
| Ni ii | 3513.99 | |
| Ni iii | [7889.93] | 1.001 |
| d ( d) | ||
|---|---|---|
| 3000–10000 Å | 1.0–2.5 m | |
| Ion | [Å] | [m] |
| O i | 7771.94 | |
| Mg ii | 9218.25 | 1.091 |
| Si ii | 4130.90 | 1.175 |
| 6347.11 | 1.370 | |
| 1.445 | ||
| Si iii | 4552.62 | 1.134 |
| S ii | 5453.85 | [1.032] |
| S iii | [9530.62] | |
| Ar ii | 6643.69 | |
| Ar iii | [7135.79]† | |
| Ca ii | 3933.66† | 1.885 |
| 8542.09 | ||
| Ti ii | 3349.41 | |
| Cr ii | 3132.05 | |
| Fe ii | 5169.03 | 1.113 |
| Fe iii | 4431.02 | 1.365 |
| 7265.19 | ||
| Co ii | 3501.71 | 1.606 |
| 3621.20 | 1.777 | |
| 2.220 | ||
| 2.361 | ||
| Co iii | 5667.05 | [1.272] |
| [5888.48]† | [1.548] | |
| [2.002] | ||
| [2.097] | ||
| [2.473] | ||
| Co iv | [1.871] | |
| Ni ii | 3513.99 | 1.878 |
| Ni iii | [7889.93] | 1.001 |
| d ( d) | ||
| 3000–10000 Å | 1.0–2.5 m | |
| Ion | [Å] | [m] |
| Si ii | 6347.11 | 1.175 |
| S ii | 5647.02 | [1.032] |
| S iii | [9530.62] | |
| Ar iii | [7135.79]† | |
| Ca ii | 3968.47† | 1.184 |
| 8542.09 | ||
| Ti ii | 3349.41 | |
| Cr ii | 3132.05 | |
| Fe ii | 5169.03 | 1.050 |
| 7462.41 | ||
| 7711.72 | ||
| 9997.58 | ||
| Fe iii | 4419.60 | [1.061] |
| Co ii | 3621.20 | 1.136 |
| 4160.66 | 1.183 | |
| 4660.63 | 1.350 | |
| 1.406 | ||
| 1.606 | ||
| 1.777 | ||
| 1.886 | ||
| 2.134 | ||
| 2.220 | ||
| 2.361 | ||
| 2.460 | ||
| Co iii | [5888.48]† | [1.272] |
| [2.002] | ||
| Co iv | [1.871] | |
| Ni ii | 3513.99 | 1.878 |
| Ni iii | [7889.93] | |
| d ( d) | ||
| 3000–10000 Å | 1.0–2.5 m | |
| Ion | [Å] | [m] |
| Si ii | 6347.11 | |
| S ii | [4068.60]† | [1.032] |
| S iii | [9530.62] | |
| Ar iii | [7135.79]† | |
| Ca ii | 3968.47† | 1.184 |
| 8542.09 | ||
| 8662.14 | ||
| Ti ii | 3372.80 | |
| Cr ii | 3132.05 | |
| Fe ii | 4351.77 | 1.050 |
| 4549.47 | 1.261 | |
| 5169.03 | ||
| 7462.41 | ||
| 7711.72 | ||
| 9997.58 | ||
| Fe iii | [4658.05]† | |
| Co ii | 3621.20 | 1.183 |
| 9418.11 | 1.406 | |
| 1.503 | ||
| 1.606 | ||
| 1.777 | ||
| 1.886 | ||
| 2.134 | ||
| 2.220 | ||
| 2.361 | ||
| 2.460 | ||
| Co iii | [5888.48]† | [2.002] |
| Ni ii | 8096.75 | 1.312 |
| d ( d) | ||
| 3000–10000 Å | 1.0–2.5 m | |
| Ion | [Å] | [m] |
| Si ii | 6347.11 | |
| S ii | [4068.60]† | [1.032] |
| S iii | [9530.62] | |
| Ar iii | [7135.79]† | |
| Ca ii | 3179.33 | 1.184 |
| 3968.47† | ||
| 8542.09 | ||
| Ti ii | 3372.80 | 1.463 |
| 3759.30 | ||
| Fe ii | 4233.17 | 1.050 |
| 4549.47 | 1.261 | |
| 5169.03 | 1.370 | |
| 7462.41 | 1.453 | |
| 7711.72 | ||
| 9997.58 | ||
| Fe iii | [4658.05]† | |
| Co ii | 3621.20 | 1.183 |
| 1.606 | ||
| 1.777 | ||
| 1.886 | ||
| 2.134 | ||
| 2.220 | ||
| 2.361 | ||
| 2.460 | ||
| Co iii | [5888.48]† | [2.002] |
| Ni ii | [1.939] | |
| d ( d) | ||
| 3000–10000 Å | 1.0–2.5 m | |
| Ion | [Å] | [m] |
| Si ii | 6347.11 | |
| S ii | [4068.60]† | [1.032] |
| S iii | [9068.62] | |
| [9530.62] | ||
| Ar iii | [7135.79]† | |
| Ca ii | 3933.66† | 1.184 |
| 8542.09 | ||
| Ti ii | 3759.30 | 1.463 |
| Cr ii | 3132.05 | 1.880 |
| 3368.04 | ||
| 3408.76] | ||
| Mn ii | 3441.99 | |
| Fe ii | 4233.17 | 1.050 |
| 4549.47 | 1.261 | |
| 5169.03 | 1.370 | |
| 6247.56 | 1.453 | |
| 6456.38 | ||
| 7462.41 | ||
| 7711.72 | ||
| 9997.58 | ||
| Fe iii | [4658.05]† | [2.145] |
| Co ii | 3621.20 | 1.183 |
| 1.606 | ||
| 1.777 | ||
| 2.134 | ||
| 2.220 | ||
| 2.361 | ||
| 2.460 | ||
| Co iii | [5888.48]† | [2.002] |
| Co iv | [3936.51]† | [1.871] |
| Ni ii | [7377.83]† | [1.939] |
| Ni iii | [7889.93] | |
| d ( d) | ||
| 3000–10000 Å | 1.0–2.5 m | |
| Ion | [Å] | [m] |
| Si ii | 6347.11 | |
| S ii | [4068.60]† | [1.032] |
| S iii | [9068.62] | |
| [9530.62] | ||
| Ar iii | [7135.79]† | |
| Ca ii | 3933.66† | 1.184 |
| 8542.09 | ||
| Ti ii | 3759.30 | 1.463 |
| Cr ii | 3132.05 | 1.503 |
| 3368.04 | 1.880 | |
| 3408.76] | ||
| Mn ii | 3441.99 | |
| Fe ii | 4233.17 | 1.050 |
| 4549.47 | 1.261 | |
| 5169.03 | 1.370 | |
| 6247.56 | 1.687 | |
| 6456.38 | 1.840 | |
| 7462.41 | ||
| 7711.72 | ||
| 9997.58 | ||
| Fe iii | [4658.05]† | [2.145] |
| Co ii | 3621.20 | 1.183 |
| 1.606 | ||
| 1.777 | ||
| 2.134 | ||
| 2.220 | ||
| 2.361 | ||
| 2.460 | ||
| Co iii | [5888.48]† | [2.002] |
| Co iv | [3936.51]† | [1.871] |
| Ni ii | [7377.83]† | [1.939] |
| Ni iii | [7889.93] | |
| d ( d) | ||
| 3000–10000 Å | 1.0–2.5 m | |
| Ion | [Å] | [m] |
| Si ii | 6347.11 | |
| S ii | [4068.60]† | [1.032] |
| S iii | [9068.62] | |
| [9530.62] | ||
| Ar iii | [7135.79]† | |
| Ca ii | 3933.66† | 1.184 |
| 8542.09 | ||
| Ti ii | 3759.30 | 1.463 |
| Cr ii | 3132.05 | 1.454 |
| 3368.04 | ||
| 3408.76] | ||
| 4558.65 | ||
| Mn ii | 3441.99 | |
| Fe i | 3581.19 | 1.197 |
| 3734.86 | ||
| Fe ii | 4233.17 | 1.050 |
| 5169.03 | [1.257]† | |
| 6247.56 | 1.370 | |
| 6456.38 | 1.687 | |
| 7462.41 | 1.840 | |
| 7711.72 | ||
| 9997.58 | ||
| Fe iii | [4658.05]† | [2.145] |
| Co ii | 3501.71 | 1.183 |
| 1.606 | ||
| 1.777 | ||
| 2.220 | ||
| 2.361 | ||
| 2.460 | ||
| Co iii | [5888.48]† | [1.548] |
| [6853.53] | [2.002] | |
| [2.097] | ||
| Co iv | [3936.51]† | [1.871] |
| [4494.29] | ||
| Ni ii | [7377.83]† | [1.939] |
| Ni iii | [7889.93] | |
| d ( d) | ||
|---|---|---|
| 3000–10000 Å | 1.0–2.5 m | |
| Ion | [Å] | [m] |
| S ii | [4068.60]† | [1.032] |
| S iii | [9068.62] | |
| [9530.62] | ||
| Ar iii | [7135.79]† | |
| Ca ii | 3933.66† | 1.184 |
| 8542.09 | ||
| Ti ii | 3759.30 | 1.463 |
| 4395.03 | ||
| Cr ii | 3132.05 | 1.763] |
| 3368.04 | ||
| 3408.76] | ||
| Mn ii | 3441.99 | |
| Fe i | 3581.19 | 1.197 |
| 3734.86 | ||
| Fe ii | 4233.17 | [1.257]† |
| 5169.03 | [1.321] | |
| 6247.56 | 1.370 | |
| 6456.38 | 1.687 | |
| 7462.41 | 1.840 | |
| 7711.72 | ||
| Fe iii | [4658.05]† | [2.145] |
| [2.218] | ||
| [2.348] | ||
| Co ii | 3501.71 | 1.606 |
| 1.777 | ||
| 2.460 | ||
| Co iii | [5888.48]† | [1.548] |
| [6853.53] | [2.002] | |
| Co iv | [4494.29] | [1.871] |
| Ni ii | [7411.61] | [1.939] |
| Ni iii | [7889.93] | |
Appendix D Contribution of individual ions to the total optical and near-infrared flux
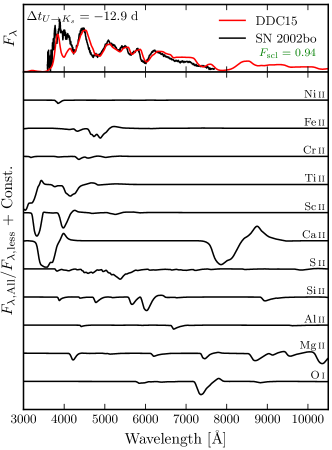
Figures 15–21 reveal the contribution of individual ions (bottom panels) to the full optical (left) and NIR (right) synthetic spectra of DDC15 (top panels, red line), compared to SN 2002bo (top panels, black line) at all times presented in Figures 8 and 9. Only ions that impact the flux at the per cent level are shown.
References
- Badenes & Maoz (2012) Badenes C., Maoz D., 2012, ApJ, 749, L11
- Baron et al. (2012) Baron E., Höflich P., Krisciunas K., Dominguez I., Khokhlov A. M., Phillips M. M., Suntzeff N., Wang L., 2012, ApJ, 753, 105
- Benetti et al. (2005) Benetti S. et al., 2005, ApJ, 623, 1011
- Benetti et al. (2004) —, 2004, MNRAS, 348, 261
- Bessell (1990) Bessell M. S., 1990, PASP, 102, 1181
- Biscardi et al. (2012) Biscardi I. et al., 2012, A&A, 537, A57
- Blondin et al. (2013) Blondin S., Dessart L., Hillier D. J., Khokhlov A. M., 2013, MNRAS, 429, 2127 (B13)
- Blondin et al. (2012) Blondin S. et al., 2012, AJ, 143, 126
- Branch et al. (2006) Branch D. et al., 2006, PASP, 118, 560
- Cardelli, Clayton & Mathis (1989) Cardelli J. A., Clayton G. C., Mathis J. S., 1989, ApJ, 345, 245
- Childress et al. (2014) Childress M. J., Filippenko A. V., Ganeshalingam M., Schmidt B. P., 2014, MNRAS, 437, 338
- Cohen, Wheaton & Megeath (2003) Cohen M., Wheaton W. A., Megeath S. T., 2003, AJ, 126, 1090
- Dessart et al. (2014a) Dessart L., Blondin S., Hillier D. J., Khokhlov A., 2014a, MNRAS, 441, 532 (D14a)
- Dessart et al. (2014b) Dessart L., Hillier D. J., Blondin S., Khokhlov A., 2014b, MNRAS, 439, 3114
- Dessart et al. (2014c) —, 2014c, MNRAS, 441, 3249 (D14c)
- Domínguez, Höflich & Straniero (2001) Domínguez I., Höflich P., Straniero O., 2001, ApJ, 557, 279
- Foley & Kirshner (2013) Foley R. J., Kirshner R. P., 2013, ApJ, 769, L1
- Friesen et al. (2014) Friesen B., Baron E., Wisniewski J. P., Parrent J. T., Thomas R. C., Miller T. R., Marion G. H., 2014, ApJ, 792, 120
- Hillier (1990) Hillier D. J., 1990, A&A, 231, 116
- Hillier & Dessart (2012) Hillier D. J., Dessart L., 2012, MNRAS, 424, 252
- Höflich et al. (2002) Höflich P., Gerardy C. L., Fesen R. A., Sakai S., 2002, ApJ, 568, 791
- Hoyle & Fowler (1960) Hoyle F., Fowler W. A., 1960, ApJ, 132, 565
- Jha et al. (2006) Jha S. et al., 2006, AJ, 131, 527
- Kasen (2006) Kasen D., 2006, ApJ, 649, 939
- Khokhlov, Müller & Höflich (1993) Khokhlov A., Müller E., Höflich P., 1993, A&A, 270, 223
- Krisciunas, Phillips & Suntzeff (2004) Krisciunas K., Phillips M. M., Suntzeff N. B., 2004, ApJ, 602, L81
- Krisciunas et al. (2004) Krisciunas K. et al., 2004, AJ, 128, 3034
- Kuchner et al. (1994) Kuchner M. J., Kirshner R. P., Pinto P. A., Leibundgut B., 1994, ApJ, 426, L89
- Lentz et al. (2000) Lentz E. J., Baron E., Branch D., Hauschildt P. H., Nugent P. E., 2000, ApJ, 530, 966
- Ng (1974) Ng K.-C., 1974, J. Chem. Phys., 61, 2680
- Nomoto, Thielemann & Yokoi (1984) Nomoto K., Thielemann F.-K., Yokoi K., 1984, ApJ, 286, 644
- Nugent et al. (2011) Nugent P. E. et al., 2011, Nature, 480, 344
- Pakmor et al. (2012) Pakmor R., Kromer M., Taubenberger S., Sim S. A., Röpke F. K., Hillebrandt W., 2012, ApJ, 747, L10
- Parrent et al. (2011) Parrent J. T. et al., 2011, ApJ, 732, 30
- Pinto & Eastman (2000) Pinto P. A., Eastman R. G., 2000, ApJ, 530, 757
- Piro & Nakar (2014) Piro A. L., Nakar E., 2014, ApJ, 784, 85
- Sauer et al. (2008) Sauer D. N. et al., 2008, MNRAS, 391, 1605
- Scalzo, Ruiter & Sim (2014) Scalzo R. A., Ruiter A. J., Sim S. A., 2014, MNRAS, 445, 2535
- Silverman et al. (2012) Silverman J. M. et al., 2012, MNRAS, 425, 1789
- Stehle et al. (2005) Stehle M., Mazzali P. A., Benetti S., Hillebrandt W., 2005, MNRAS, 360, 1231
- van Kerkwijk, Chang & Justham (2010) van Kerkwijk M. H., Chang P., Justham S., 2010, ApJ, 722, L157
- Wang et al. (2009) Wang X. et al., 2009, ApJ, 699, L139
- Zheng et al. (2013) Zheng W. et al., 2013, ApJ, 778, L15