The exceptionally powerful TeV -ray emitters in the Large Magellanic Cloud
Abstract
The Large Magellanic Cloud, a satellite galaxy of the Milky Way, has been observed with the High Energy Stereoscopic System (H.E.S.S.) above an energy of 100 billion electron volts for a deep exposure of 210 hours. Three sources of different types were detected: the pulsar wind nebula of the most energetic pulsar known N 157B, the radio-loud supernova remnant N 132D and the largest non-thermal X-ray shell – the superbubble 30 Dor C. The unique object SN 1987A is, surprisingly, not detected, which constrains the theoretical framework of particle acceleration in very young supernova remnants. These detections reveal the most energetic tip of a -ray source population in an external galaxy, and provide via 30 Dor C the unambiguous detection of -ray emission from a superbubble.
Introduction
The origin of cosmic rays (CRs), the very high (VHE, eV), and ultra high ( eV) energy particles that bombard Earth, has puzzled us for over a century. Much progress has been made during the last decade due to the advent of VHE -ray telescopes. These telescopes detect eV -rays from atomic nuclei (hadronic CRs) collisions with local gas, or from ultra-relativistic electrons/positrons (leptonic CRs), which produce -ray emission by upscattering low-energy background photons (?). Indeed, a survey of the inner part of the Milky Way with H.E.S.S., an array of imaging atmospheric Cherenkov telescopes (?), revealed a population of supernova remnants (SNRs) and pulsar wind nebulae (PWNe) emitting -rays with energies in excess of 100 GeV (?).
Here we report on VHE -ray sources detected outside the Milky Way, namely in the Large Magellanic Cloud (LMC). This satellite galaxy of the Milky Way has a stellar mass of about 4% of the Milky Way (?, ?). Located at a distance of 50 kpc (?), it is an irregular galaxy seen almost face-on (?). Consequently, source confusion is much less of a problem than for the inner Milky Way, and there is less uncertainty in the distances of the sources. The LMC stands out among nearby galaxies for its high star formation rate per unit mass, which is about a factor of five higher than in the Milky Way (?, ?), and contains the best example of a local starburst, the Tarantula Nebula. The LMC also harbors numerous massive stellar clusters and SNRs. Among the SNRs is a unique source, SN1987A, the remnant of the nearest supernova observed in modern times (?).
High-energy -ray emission from the LMC was detected by EGRET (?) and, more recently, by the Fermi Large Area Telescopes (LAT) (?), which revealed diffuse emission with an extension of several degrees in diameter, tracing massive starforming regions. VHE -ray telescopes, like H.E.S.S., besides providing information on much higher energy CRs, have an angular resolution of a few arcminutes, which is substantially better than Fermi-LAT’s resolution at -ray energies GeV. The good angular resolution allows H.E.S.S. to identify individual sources in the LMC. As we will detail below, a deep H.E.S.S. observation revealed three luminous sources in the LMC: the superbubble 30 Dor C, the energetic PWN N 157B, and the radio-loud SNR N 132D. Of these sources, only N 157B was detected previously in a 47-hours exposure (?). The observations extend the scope of VHE -ray astronomy by providing examples of sources from a population outside the Milky Way. N 157B and N 132D belong to known -ray source classes, but both have distinguishing characteristics, N 157B being powered by the most energetic young pulsar, and N 132D being one of the oldest VHE -ray emitting SNRs. The superbubble 30 Dor C, however, provides an unambiguous detection of a superbubble in VHE -rays. Conspicuously absent from our list of three sources is SN1987A, despite predictions that it should be a bright -ray source (?, ?).
H.E.S.S. Observations
We report on a deep, 210-hours H.E.S.S. exposure, targeted at the region of the Tarantula nebula — corresponding to 30 Doradus (30 Dor) — the largest star-forming region in the Local Group of galaxies. We reconstructed -ray showers with an image-fitting analysis (?) and cross-checked with a multivariate analysis based on image parameterization (?, ?), with consistent results. In both analyses, a cut on the uncertainty of the reconstructed -ray direction indicated an angular resolution of .
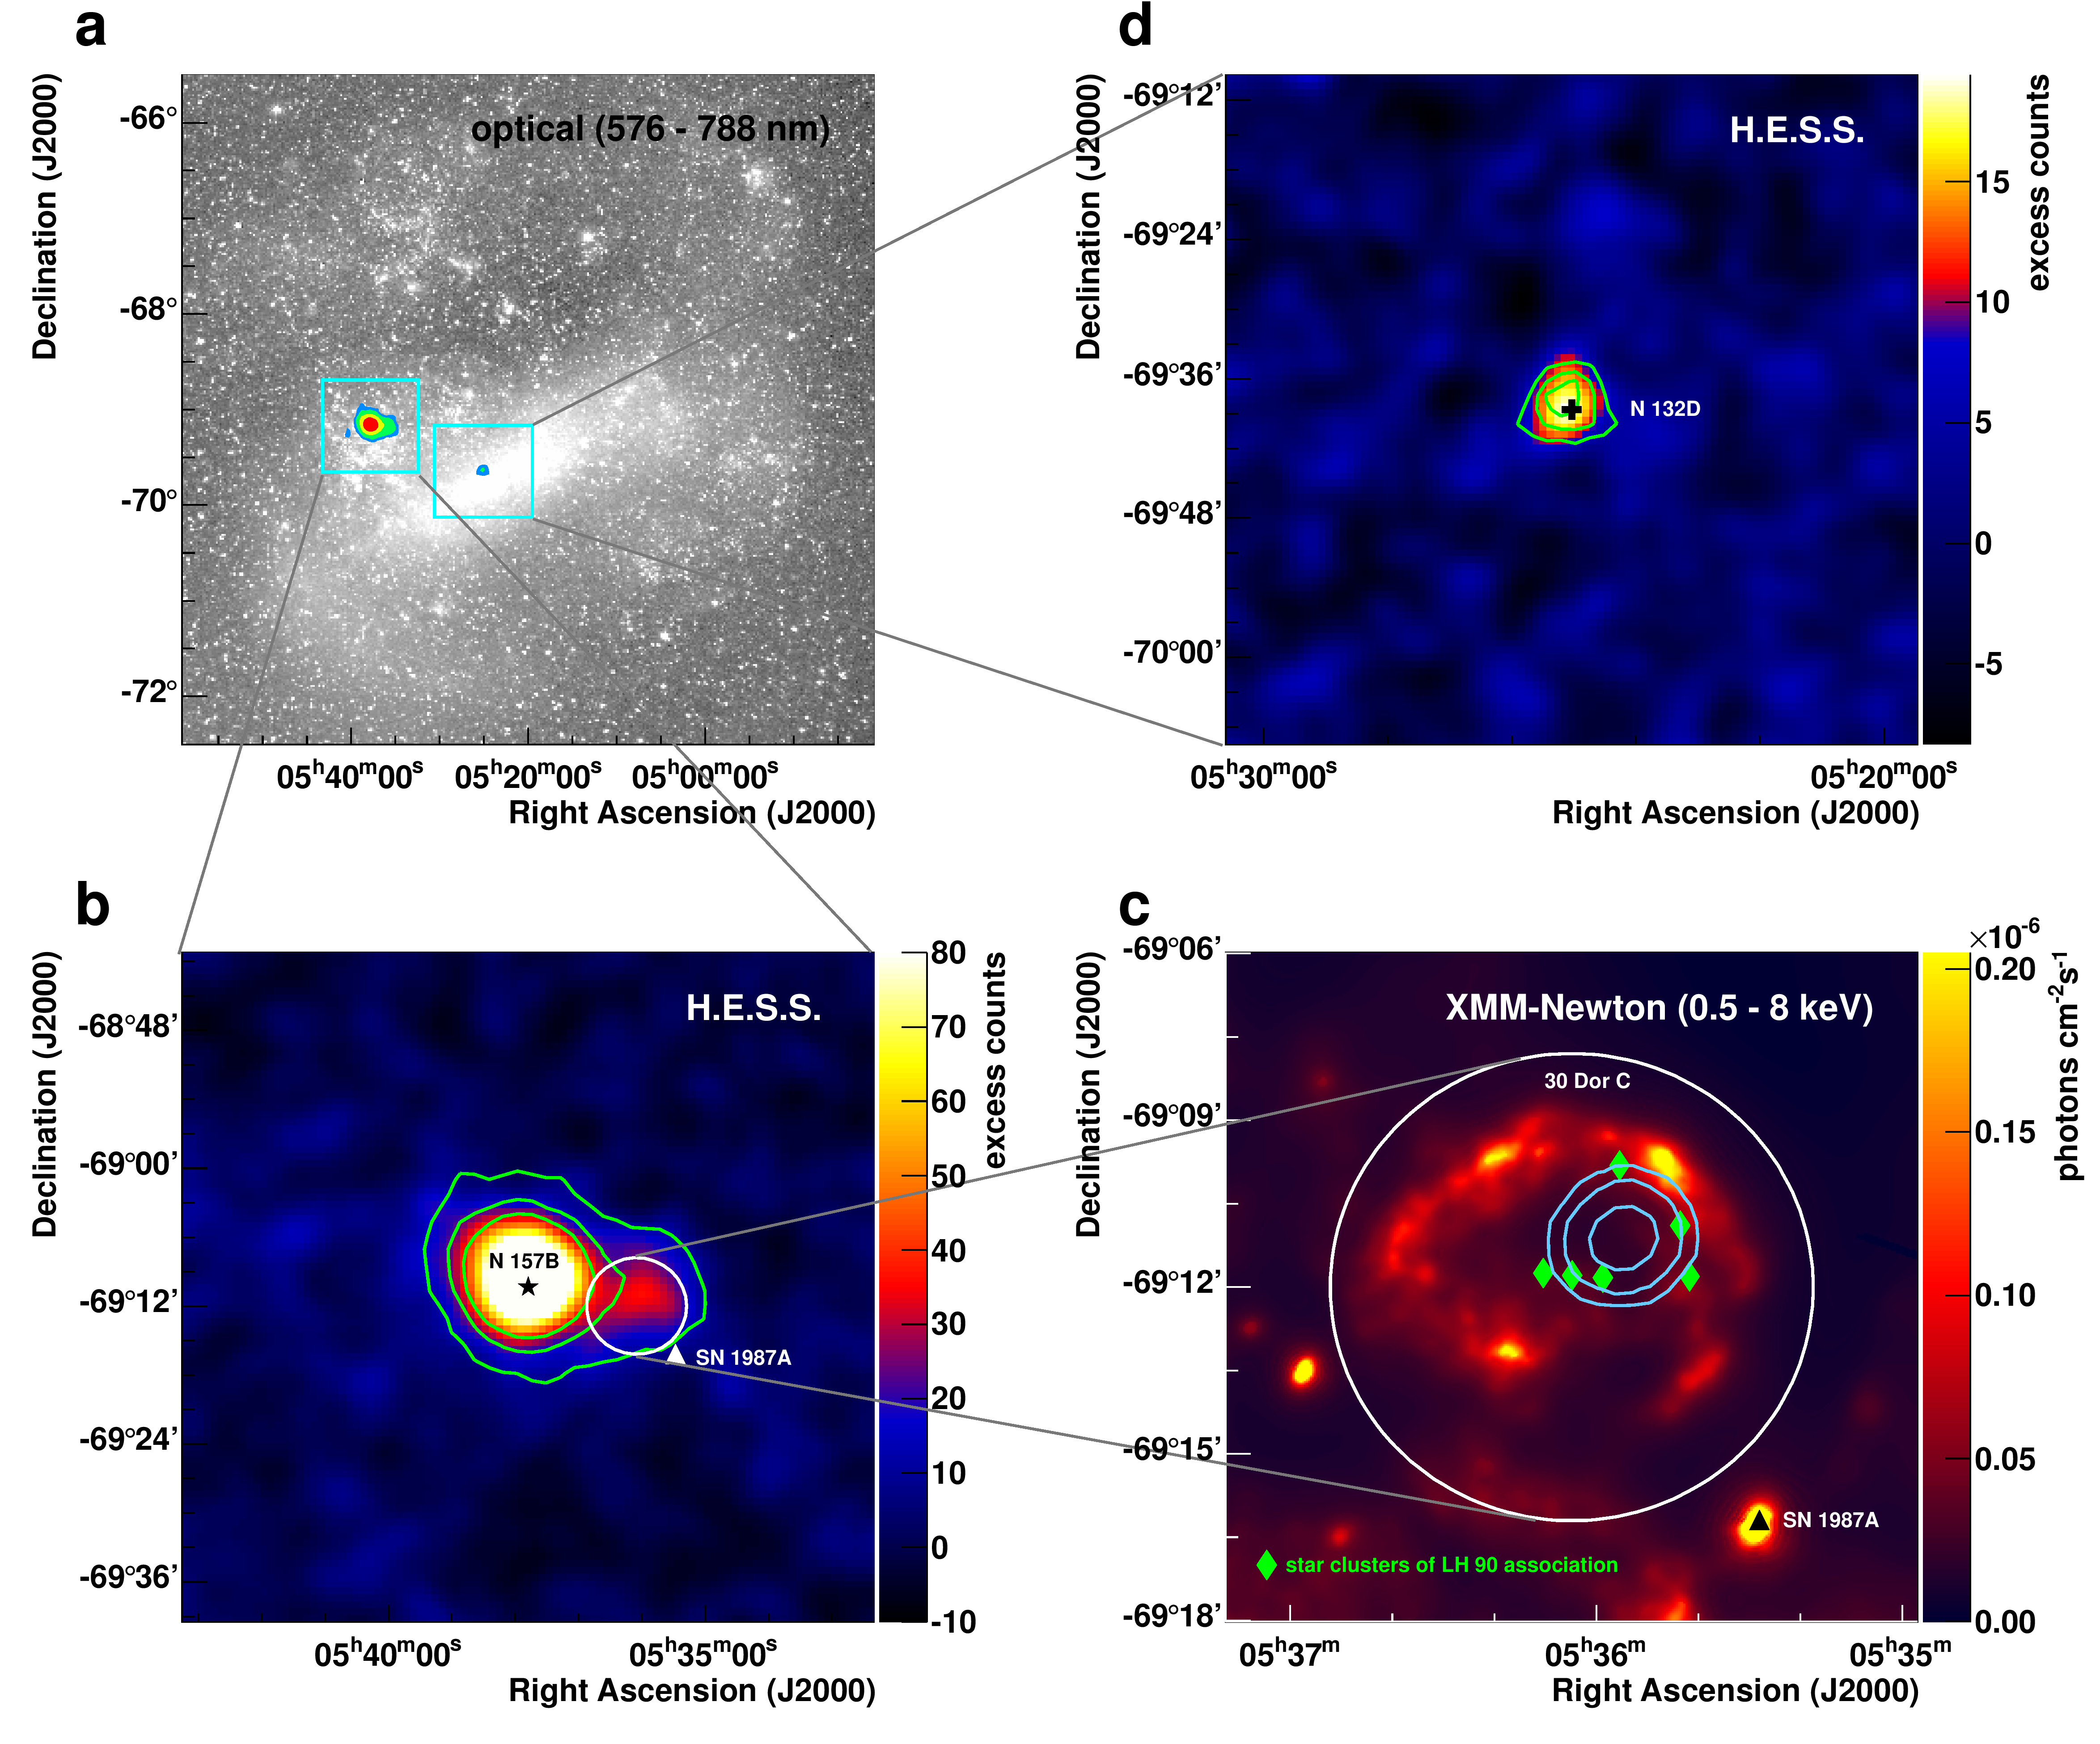
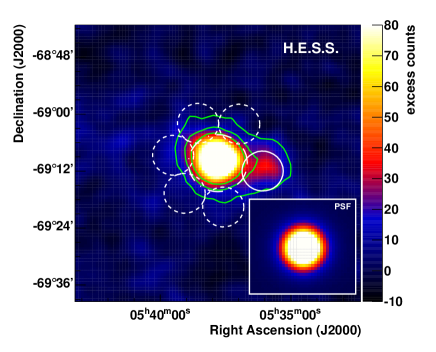
Fig. 1a shows an optical image of the LMC overlaid with TeV gamma-ray point-source significance contours. In this dataset, 613 rays with a statistical significance of are detected from the PWN N 157B. Figure 1b provides a close-up view of the -ray emission from N 157B. The diameter of N 157B of (?) is of the order of the H.E.S.S. angular resolution. Further significant -ray emission is detected to the South-West of N 157B.
A likelihood fit of a model of two -ray sources to the on-source and background sky maps establishes the detection of a second source at an angular distance of (corresponding to 130 pc at a distance of 50 kpc) from N 157B. The model consisting of two sources is preferred by over the model of one single source. Fig. 1c shows an X-ray image with overlaid contours of confidence of the source position. The position of the second source (RA = , Dec = , equinox J2000, errors) coincides with the superbubble 30 Dor C, the first such source detected in VHE -rays, and thus representing an additional source class in this energy regime. A -ray signal around the energetic pulsar PSR J05406919 is not detected, despite the presence of an X-ray luminous PWN (?). A flux upper limit (99% confidence level) is derived at .
Along with the clear detection of N 157B and 30 Dor C, evidence for VHE -ray emission is observed from the prominent SNR N 132D (Fig. 1d). The emission peaks at a significance of about above a background which is estimated from a ring around each sky bin. At the nominal position of the SNR 43 rays with a statistical significance of are recorded.
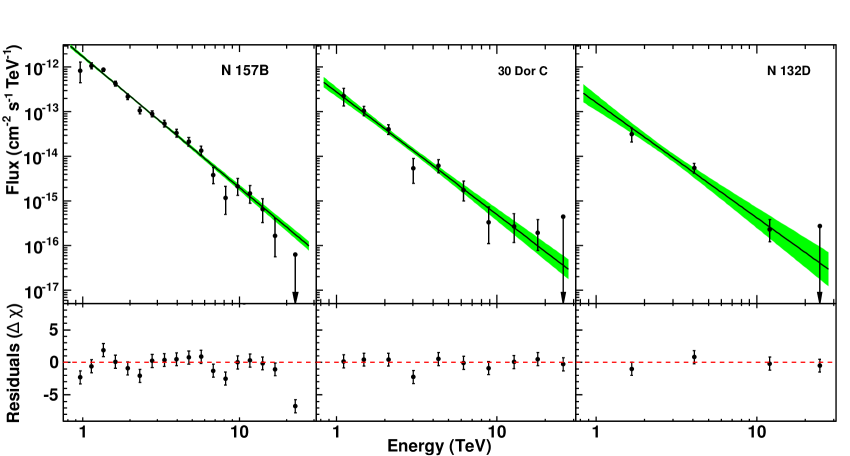
The -ray spectra of all three objects are well described by a power law in energy, (Fig. 2). The best-fit spectral indices and integral -ray luminosities are summarized in Table 1.
Even with a deep exposure of 210 hours, significant emission from SN 1987A is not detected, and we derive an upper limit on the integral -ray flux of at a 99% confidence level.
| Source | N 157B | 30 Dor C | N 132D |
|---|---|---|---|
| H.E.S.S. Identifier | HESS J0537691 | HESS J0535691 | HESS J0525696 |
| Exposure Time | 181 h | 183 h | 148 h |
| rays | |||
| Significance | |||
| Photon Index | |||
Discussion of individual sources
The three VHE emitters belong to different source classes and their energy output exceeds or at least equals that of their most powerful relatives in the Milky Way.
30 Dor C
The superbubble 30 Dor C stands out in X-rays as it contains, in the western part, an X-ray synchrotron-emitting shell with a radius of 47 pc, which makes it the largest known X-ray synchrotron shell (?, ?, ?). X-ray synchrotron emission, which indicates the presence of VHE electrons, is usually associated with year-old SNRs with radii smaller than 25 pc. In addition, the X-ray synchrotron luminosity of 30 Dor C is ten times that of the archetypal young SNR SN 1006 (?). The 30 Dor C shell also emits radio and optical radiation (?), and appears to have been produced by the stellar winds and supernovae in the OB association LH 90 (NGC 2044) (?).
The measured H.E.S.S. flux of 30 Dor C corresponds to a TeV -ray luminosity of erg s-1, with the best-fit position of the -ray emission lying in between the six identified sub-clusters (?). The TeV emission can be explained by the production of neutral pions due to collisions of hadronic CRs with the background plasma. Alternatively, the so-called leptonic emission scenario may apply, in which case the TeV emission is the result of Compton upscattering of low-energy photons to -ray energies, by the same population of electrons that is responsible for the X-ray synchrotron radiation (?).
For the hadronic scenario, a combination of energy in CRs (assumed to be protons) and density of hydrogen atoms, , of erg is required (see S1.3). 30 Dor C probably experienced 5 supernova explosions (?), which likely provided 5 erg in CR energy. Hence, the average gas density should be cm-3, which is higher than the density estimate of based on the X-ray thermal emission in the southwest (?, ?). However, locations of high densities may be present, if the X-ray thermal emission comes from smaller radii than the dense outer shell, or if cool, dense, clumped gas survived inside the otherwise rarified interior of the bubble (?).
This hadronic scenario puts constraints on the CR diffusion coefficient, because the diffusion length scale should be smaller than the radius of the shell: pc for CRs around 10 TeV. Therefore, cm2 s-1, which, given an age for the superbubble of a few million years, gives a much smaller diffusion coefficient than the typical Galactic diffusion coefficient of cm2s-1 (?). This small diffusion coefficient requires magnetic-field amplification combined with turbulent magnetic fields, as hypothesized by (?).
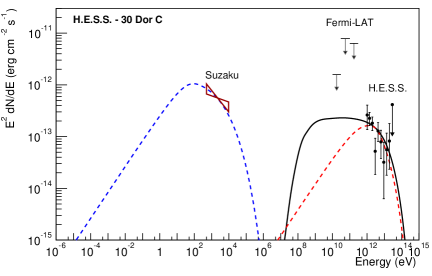
X-ray synchrotron emission from 30 Dor C requires large shock velocities, km s-1 (?). Assuming that this shock originates from an explosion centered at the superbubble, we obtain a rough estimate of the age of the western X-ray shell of yr, assuming a Sedov expansion model ( cm). Since the OB association is much older, this age most likely refers to a recent supernova explosion, whose remnant evolves in the rarified medium of the superbubble. The Sedov expansion model then gives us a very low estimate for the density of cm-3 for an explosion energy of erg. Although this is very low, it can occur under certain conditions (?). This model for the X-ray synchrotron shell can even be reconciled with the hadronic model of the TeV emission, if the rarified medium also contains dense clumps. For the leptonic scenario for the TeV emission, the broad spectral energy distribution (SED, Fig. 3) requires an energy in accelerated electrons of erg, and average magnetic field strength of G, low compared to most young SNRs (?), but a factor three to four higher than the average magnetic field in the LMC (?).
Although at this stage we cannot rule out either the leptonic or the hadronic scenario, the H.E.S.S. observations reveal that the conditions inside the superbubble must be extreme: the hadronic scenario requires locations with high densities and a high degree of magnetic turbulence, whereas the leptonic scenario requires the stellar cluster to be extremely rarified. Moreover, the -ray and X-ray observations suggest active particle acceleration by a very large, fast expanding shell. This may provide the right conditions for accelerating some protons to energies exceeding eV, which is the maximum energy detected for Galactic CRs. These observations, therefore, lend support to the view expressed in (?, ?, ?) that superbubbles may provide the right conditions for particle acceleration to very high energies, because they are thought to contain very turbulent magnetic fields and they are large enough to contain VHE particles for up to millions of year.
In the Milky Way, the most closely related object to 30 Dor C is the stellar cluster Westerlund 1 (?), which, however, has a completely different X-ray morphology. More importantly, it is not clear whether the -rays originate from the cluster wind itself, a PWN or from the numerous supernovae that exploded inside Westerlund 1 in the recent past. Since a large fraction of supernovae are thought to go off in superbubbles, this first unambiguous detection of VHE -rays from a superbubble may have broad implications for the circumstances in which a large fraction of CRs are accelerated.
N 157B
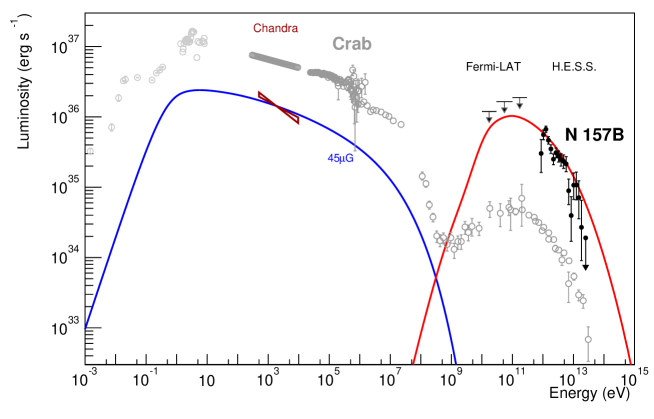
The source HESS J0537691 is coincident with the PWN N 157B, which surrounds the pulsar PSR J05376910. PWNe are nebulae of ultra-relativistic particles driven by highly-magnetized, fast-rotating neutron stars that convert a considerable amount of their spin-down energy into a particle wind. The archetypal Crab nebula is one of the brightest sources of non-thermal radiation in the sky and powered by the pulsar with the highest spin-down energy known in the Milky Way (?). With comparably extreme rotational energy loss rates, N 157B ( erg s-1) and the Crab nebula ( erg s-1) appear to be twins. The study of N 157B thus provides the unique opportunity to compare two extreme PWNe, and to disentangle object-specific and generic properties.
Given a population of ultra-relativistic electrons and positrons forming the PWN, the X-ray luminosity is determined by the strength of the magnetic field and the -ray luminosity by the intensity of radiation fields which serve as targets for the inverse Compton upscattering. If the radiation fields are known, the magnetic field can be inferred from the combination of X-ray and -ray measurements. N 157B is likely associated with the LH 99 star cluster (?, ?, ?), and therefore embedded in strong infrared radiation fields (see S1.5). In this environment, the magnetic field in the PWN must be rather weak, not larger than 45 G, in order to explain the multiwavelength data (Fig. 4). When considering the region from which the hard X-ray emission is coming, the total energy in the magnetic field is erg – an order of magnitude smaller than the energy in GeV electrons. The derived maximum magnetic field is also much lower than that inferred for the Crab nebula (G (?)), and suggests at least a factor lower magnetic pressure. As most of the electrons that radiate in the Chandra, X-ray and H.E.S.S., TeV domains have very short lifetimes (300 years), the energy in ultra-relativistic particles in N 157B can be inferred independently of the spin-down evolution of the pulsar. For the model shown in Fig. 4, a constant fraction of of the current spin-down power of N 157B needs to be injected into the nebula in the form of relativistic electrons (compared with 50% for the Crab nebula under the same model). This fraction converted into X-ray and TeV emission is rather insensitive to the spectral index of injected electrons and the spin-evolution or braking index of the pulsar and only relies on the association of N 157B with LH 99 (see S1.5 for more information).
In this high-radiation field scenario, the situation for the Crab nebula is very different from N 157B. Not only is the best-fit electron spectrum of N 157B harder vs. 2.35), exhibiting a lower cut-off energy TeV vs. 3.5 PeV), but much of the spin-down energy of N 157B is also hidden and is not carried by ultra-relativistic particles or magnetic fields. The remainder of the available rotational energy is likely to be fed into electrons with energies 400 GeV that radiate at lower photon energies, adiabatic expansion, and/or particles escaping into the interstellar medium via diffusive escape (e.g., (?)). It therefore appears that N 157B is such a bright -ray emitter because of the enhanced radiation fields, despite the fact that it is apparently a much less efficient particle accelerator than the Crab nebula.
N 132D
In addition to the two unambiguously detected sources, we find strong evidence for a third source at the position of the core-collapse SNR N 132D. N 132D is a SNR with strong thermal X-ray emission, which has been used to estimate a pre-shock density of (?), a high explosion energy of erg (?), and an age of yr, based on a Sedov model. Such X-ray bright SNRs are predicted to be -ray emitters (?). N 132D is also luminous in the radio (?) and infrared bands (?). N 132D is often compared to the brightest radio source Cas A, which, like N 132D, is an oxygen-rich SNR. N 132D has a higher infrared luminosity (?), but its radio luminosity is 50% that of Cas A. This is still remarkable given that N 132D has a kinematic age of yr (?), whereas Cas A is yr old and declines in luminosity by about 0.8% per year. The radio properties have been used to infer a magnetic field strength of (?). The discrepancy between the age estimate based on the X-ray emission and the kinematic age may indicate that the supernova exploded within a bubble created by the progenitor star’s wind before encountering the high density material it now interacts with.
The -ray flux measured by H.E.S.S. translates to a TeV -ray luminosity of . Assuming that the -ray emission is caused by neutral-pion production, this luminosity implies an energy of in relativistic protons. A hadronic origin of the -ray emission, therefore, implies either a large CR-energy fraction of 17% of the explosion energy, for an estimated post-shock density of (?), or the gas density is higher than the x-ray-based estimates. The latter is plausible given that N 132D appears to interact with dense, shocked interstellar clouds, seen in the optical and the infrared bands (?). It is interesting to compare N 132D to the most luminous Galactic SNR detected at TeV energies, HESS J1640465: both SNRs are believed to interact with a wind-blown cavity wall, to possibly have similar ages and sizes (?, ?), and to have transferred a large fraction of their explosion energies into CRs.
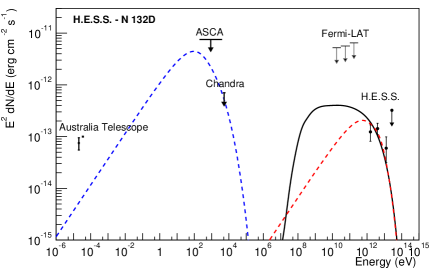
The bright radio synchrotron luminosity of N 132D and the tentative claim of X-ray synchrotron emission from this source (?) also raises the possibility that the -ray emission is caused by inverse Compton scattering of low-energy photons. In and around N 132D the radiation energy density is dominated by the bright infrared flux from dust inside the SNR, and can be roughly estimated to be at least . This leptonic scenario requires that the average magnetic-field strength needs to be G, somewhat lower, but still consistent with the equipartition value (see S1.3). However, this leptonic scenario critically depends on whether the 4-6 keV X-ray continuum emission indeed contains a significant synchrotron component.
Whatever the emission mechanism for the -ray emission from N 132D, it is an exciting new -ray-emitting SNR, because its age lies in the gap between young ( yr) TeV-emitting SNRs, and old ( yr) TeV-quiet SNRs. The latter can be bright pion-decay sources, but their spectra appear to be cut off above GeV. N 132D provides, therefore, an indication of how long SNRs contain CRs with energies in excess of eV.
SN 1987A
SN 1987A, the only naked-eye SN event since the Kepler SN (AD 1604), has been extensively observed at all wavelengths from the radio to the soft -ray band, providing invaluable insights into the evolution of a core-collapse SNR in its early stage (?).
It has been suggested that even in the early stages of the SNR development, the shock wave, which is heating the dense circumstellar medium (CSM) structured by stellar winds of the progenitor star, should have led to efficient acceleration of VHE nuclear CRs, accompanied by strong magnetic field amplification through CR-induced instabilities (?, ?). In collisions of the CRs with CSM particles, -rays are produced. Estimates for the -ray flux (?, ?) strongly depend on the magnetic field topology and on the properties of the non-uniform CSM (?), making flux estimates uncertain by at least a factor of 2 (?).
Based on a nonlinear kinetic theory of CR acceleration, successfully applied to several young Galactic SNRs, the volume-integrated -ray flux at TeV energies, , from SN 1987A was predicted to be rising in time, and to have reached a level of ph cm-2 s-1 in the year 2010 (?). An analysis with different assumptions on CSM properties and a more phenomenological approach to CR acceleration resulted in a predicted flux of ph cm-2 s-1 in the year 2013 (?). The H.E.S.S. upper limit ph cm-2 s-1 at a confidence level, obtained from observations made between 2003 and 2012, being below the aforementioned predictions and a factor of 3 below similar estimates for the year 2005, therefore places constraints on the models despite their uncertainties.
The H.E.S.S. upper limit on the -ray flux translates into an upper limit for the -ray luminosity of erg/s, which can be used to derive an approximate upper limit on the energy of the accelerated particles, , for a given average target density. Multi-wavelength studies of SN 1987A suggest that the shock at the current epoch has reached and is interacting with the so-called equatorial ring, for which gas densities ranging from cm-3 to cm-3 have been found (?). Thus one finds a conservative upper limit, erg, where is the fraction of accelerated particles that are interacting with the dense regions. This upper limit on the energy of accelerated CR particles corresponds to of the explosion energy of erg.
Assuming a spherically-symmetric distribution of accelerated particles, one can estimate with the geometry of the equatorial ring found in (?). This translates to erg, implying that less than of the explosion energy is carried by accelerated CR nuclei. This fraction is rather small compared to typical values of for young SNRs (of ages years), but is not unreasonable for a very young object like SN 1987A.
Summary
With the deep H.E.S.S. observations of the LMC, we have detected three luminous examples of CR sources in an external galaxy. These sources detected in rays include a superbubble and counterparts to the most luminous sources in the Milky Way. N 157B provides a counterpart to the Crab Nebula, but its electron acceleration efficiency is five times less than for the Crab nebula, and its magnetic field pressure is seven times less. N 132D has been long regarded an older version of the brightest Galactic radio SNR Cas A, and is one of the most radio-luminous SNRs known. N 132D is also remarkable in that it is one of the oldest VHE -ray emitting SNRs. With the three detected sources, we increase our understanding of the variety of VHE -ray sources, which will likely require observations with the future Cherenkov Telescope Array (?), which should be an order of magnitude more sensitive than H.E.S.S.
References and Notes
- 1. J. A. Hinton, W. Hofmann, ARA&A 47, 523 (2009).
- 2. (H.E.S.S. collaboration) Aharonian, F. et al., A&A 457, 899 (2006).
- 3. (H.E.S.S. collaboration) Aharonian, F. et al., Science 307, 1938 (2005).
- 4. A. Mellinger, PASP 121, 1180 (2009).
- 5. D. Berge, S. Funk, J. Hinton, A&A 466, 1219 (2007).
- 6. P. J. McMillan, MNRAS 414, 2446 (2011).
- 7. R. P. van der Marel, The Local Group as an Astrophysical Laboratory, M. Livio, T. M. Brown, eds. (2006), pp. 47–71.
- 8. G. Pietrzyński, et al., Nature 495, 76 (2013).
- 9. S. Kim, et al., ApJ 503, 674 (1998).
- 10. J. Harris, D. Zaritsky, AJ 138, 1243 (2009).
- 11. T. P. Robitaille, B. A. Whitney, ApJ 710, L11 (2010).
- 12. W. D. Arnett, J. N. Bahcall, R. P. Kirshner, S. E. Woosley, ARA&A 27, 629 (1989).
- 13. P. Sreekumar, et al., ApJ 400, L67 (1992).
- 14. A. A. Abdo, et al., A&A 512, A7 (2010).
- 15. (H.E.S.S. collaboration) Abramowski, A. et al. , A&A 545, L2 (2012).
- 16. E. G. Berezhko, L. T. Ksenofontov, H. J. Völk, ApJ 732, 58 (2011).
- 17. V. V. Dwarkadas, MNRAS 434, 3368 (2013).
- 18. M. de Naurois, L. Rolland, Astroparticle Physics 32, 231 (2009).
- 19. S. Ohm, C. van Eldik, K. Egberts, Astroparticle Physics 31, 383 (2009).
- 20. C.-C. Lu, H.E.S.S. collaboration, 33rd International Cosmic Ray Conference, International Cosmic Ray Conference (2013).
- 21. Y. Chen, et al., ApJ 651, 237 (2006).
- 22. P. Kaaret, et al., ApJ 546, 1159 (2001).
- 23. T. Li, Y. Ma, ApJ 272, 317 (1983).
- 24. A. Bamba, M. Ueno, H. Nakajima, K. Koyama, ApJ 602, 257 (2004).
- 25. D. A. Smith, Q. D. Wang, ApJ 611, 881 (2004).
- 26. H. Yamaguchi, A. Bamba, K. Koyama, PASJ 61, 175 (2009).
- 27. D. S. Mathewson, et al., ApJS 58, 197 (1985).
- 28. M. C. Lortet, G. Testor, A&A 139, 330 (1984).
- 29. P. J. Kavanagh, et al., A&Ain press (available http://arxiv.org/abs/1409.6547) (2014).
- 30. S. Gabici, F. A. Aharonian, MNRAS 445, L70 (2014).
- 31. A. W. Strong, I. V. Moskalenko, V. S. Ptuskin, Annual Review of Nuclear and Particle Science 57, 285 (2007).
- 32. A. M. Bykov, Space Sci. Rev. 99, 317 (2001).
- 33. J. R. Dickel, D. K. Milne, AJ 109, 200 (1995).
- 34. J. P. Hughes, I. Hayashi, K. Koyama, ApJ 505, 732 (1998).
- 35. F. A. Aharonian, A. M. Atoyan, A&A 351, 330 (1999).
- 36. M. S. Oey, G. García-Segura, ApJ 613, 302 (2004).
- 37. E. A. Helder, et al., Space Sci. Rev. 173, 369 (2012).
- 38. B. M. Gaensler, et al., Science 307, 1610 (2005).
- 39. E. Parizot, A. Marcowith, E. van der Swaluw, A. M. Bykov, V. Tatischeff, A&A 424, 747 (2004).
- 40. G. Ferrand, A. Marcowith, A&A 510, A101 (2010).
- 41. A. Abramowski, et al., A&A 537, A114 (2012).
- 42. R. Bühler, R. Blandford, Reports on Progress in Physics 77, 066901 (2014).
- 43. Y.-H. Chu, R. C. Kennicutt, Jr., R. A. Schommer, J. Laff, AJ 103, 1545 (1992).
- 44. Q. D. Wang, E. V. Gotthelf, ApJ 494, 623 (1998).
- 45. M. Meyer, D. Horns, H.-S. Zechlin, A&A 523, A2 (2010).
- 46. J. A. Hinton, S. Funk, R. D. Parsons, S. Ohm, ApJ 743, L7 (2011).
- 47. N. Bucciantini, J. Arons, E. Amato, MNRAS 410, 381 (2011).
- 48. B. Katz, E. Waxman, J. Cosmology Astropart. Phys. 1, 18 (2008).
- 49. A. Tappe, J. Rho, W. T. Reach, ApJ 653, 267 (2006).
- 50. F. Vogt, M. A. Dopita, Ap&SS 331, 521 (2011).
- 51. (H.E.S.S. collaboration) Abramowski, A. et al., MNRAS 439, 2828 (2014).
- 52. X. Xiao, Y. Chen, Advances in Space Research 41, 416 (2008).
- 53. S. Immler, K. Weiler, R. McCray, eds., SUPERNOVA 1987A: 20 YEARS AFTER: Supernovae and Gamma-Ray Bursters, vol. 937 of American Institute of Physics Conference Series (2007).
- 54. A. R. Bell, K. M. Schure, B. Reville, G. Giacinti, MNRAS 431, 415 (2013).
- 55. R. A. Chevalier, V. V. Dwarkadas, ApJ 452, L45 (1995).
- 56. S. Mattila, et al., ApJ 717, 1140 (2010).
- 57. C.-Y. Ng, et al., The Astrophysical Journal Letters 728, L15 (2011).
- 58. M. Actis, et al., Experimental Astronomy 32, 193 (2011).
- 59. W. B. Atwood, et al., ApJ 697, 1071 (2009).
- 60. P. L. Nolan, et al., ApJS 199, 31 (2012).
- 61. T. Kamae, N. Karlsson, T. Mizuno, T. Abe, T. Koi, ApJ 647, 692 (2006).
- 62. G. W. Pratt, M. Arnaud, A&A 408, 1 (2003).
- 63. E. R. Micelotta, B. R. Brandl, F. P. Israel, A&A 500, 807 (2009).
- 64. A. M. Atoyan, F. A. Aharonian, MNRAS 278, 525 (1996).
Acknowledgements
The support of the Namibian authorities and of the University of Namibia in facilitating the construction and operation of H.E.S.S. is gratefully acknowledged, as is the support by the German Ministry for Education and Research (BMBF), the Max Planck Society, the German Research Foundation (DFG), the French Ministry for Research, the CNRS-IN2P3 and the Astroparticle Interdisciplinary Programme of the CNRS, the U.K. Science and Technology Facilities Council (STFC), the IPNP of the Charles University, the Czech Science Foundation, the Polish Ministry of Science and Higher Education, the South African Department of Science and Technology and National Research Foundation, and by the University of Namibia. We appreciate the excellent work of the technical support staff in Berlin, Durham, Hamburg, Heidelberg, Palaiseau, Paris, Saclay, and in Namibia in the construction and operation of the equipment. The H.E.S.S. collaboration will make public the smoothed excess sky map and the associated correlated significance map as shown in Figure 1, together with the source spectral points, on the HESS website on the link to this publication: http://www.mpi-hd.mpg.de/hfm/HESS/pages/publications. We would like to thank Boaz Katz, Eli Waxman and Ranny Budnik for their external proposal supporting observations of the SNR N 132D based on their work on -ray emission from shell-type SNRs (?).
The H.E.S.S. Collaboration
A. Abramowski 1, F. Aharonian 2,3,4, F. Ait Benkhali 2, A.G. Akhperjanian 5,4, E.O. Angüner 6,, M. Backes 7,
S. Balenderan 8, A. Balzer 9, A. Barnacka 10,11, Y. Becherini 12, J. Becker Tjus 13, D. Berge 14,
S. Bernhard 15, K. Bernlöhr 2,6, E. Birsin 6, J. Biteau 16,17, M. Böttcher 18, C. Boisson 19, J. Bolmont 20,
P. Bordas 21, J. Bregeon 22, F. Brun 23, P. Brun 23, M. Bryan 9, T. Bulik 24, S. Carrigan 2,
S. Casanova 25,2, P.M. Chadwick 8, N. Chakraborty 2, R. Chalme-Calvet 20, R.C.G. Chaves 22, M. Chrétien 20,
S. Colafrancesco 26, G. Cologna 27, J. Conrad 28,29, C. Couturier 20, Y. Cui 21, M. Dalton 30,31,
I.D. Davids 18,7, B. Degrange 16, C. Deil 2, P. deWilt 32, A. Djannati-Ataï 33, W. Domainko 2, A. Donath 2,
L.O’C. Drury 3, G. Dubus 34, K. Dutson 35, J. Dyks 36, M. Dyrda 25, T. Edwards 2, K. Egberts 37,
P. Eger 2, P. Espigat 33, C. Farnier 28, S. Fegan 16, F. Feinstein 22, M.V. Fernandes 1, D. Fernandez 22, A. Fiasson 38, G. Fontaine 16, A. Förster 2, M. Füßling 37, S. Gabici 33, M. Gajdus 6, Y.A. Gallant 22, T. Garrigoux 20, G. Giavitto 39, B. Giebels 16, J.F. Glicenstein 23, D. Gottschall 21, M.-H. Grondin 2,27,
M. Grudzińska 24, D. Hadasch 15, S. Häffner 40, J. Hahn 2, J. Harris 8, G. Heinzelmann 1, G. Henri 34,
G. Hermann 2, O. Hervet 19, A. Hillert 2, J.A. Hinton 35, W. Hofmann 2, P. Hofverberg 2, M. Holler 37,
D. Horns 1, A. Ivascenko 18, A. Jacholkowska 20, C. Jahn 40, M. Jamrozy 10, M. Janiak 36, F. Jankowsky 27,
I. Jung 40, M.A. Kastendieck 1, K. Katarzyński 41, U. Katz 40, S. Kaufmann 27, B. Khélifi 33,
M. Kieffer 20, S. Klepser 39, D. Klochkov 21, W. Kluźniak 36, D. Kolitzus 15, Nu. Komin∗ 26,
K. Kosack 23, S. Krakau 13, F. Krayzel 38, P.P. Krüger 18, H. Laffon 30, G. Lamanna 38,
J. Lefaucheur 33, V. Lefranc 23, A. Lemière 33, M. Lemoine-Goumard 30, J.-P. Lenain 20, T. Lohse 6,
A. Lopatin 40, C.-C. Lu∗ 2, V. Marandon 2, A. Marcowith 22, R. Marx 2, G. Maurin 38, N. Maxted 32,
M. Mayer∗ 37, T.J.L. McComb 8, J. Méhault 30,31, P.J. Meintjes 42, U. Menzler 13, M. Meyer 28, A.M.W. Mitchell 2, R. Moderski 36, M. Mohamed 27, K. Morå 28, E. Moulin 23, T. Murach 6,
M. de Naurois 16, J. Niemiec 25, S.J. Nolan 8, L. Oakes 6, H. Odaka 2, S. Ohm∗ 39,
B. Opitz 1, M. Ostrowski 10, I. Oya 6, M. Panter 2, R.D. Parsons 2, M. Paz Arribas 6, N.W. Pekeur 18,
G. Pelletier 34, J. Perez 15, P.-O. Petrucci 34, B. Peyaud 23, S. Pita 33, H. Poon 2, G. Pühlhofer 21,
M. Punch 33, A. Quirrenbach 27, S. Raab 40, I. Reichardt 33, A. Reimer 15, O. Reimer 15,
M. Renaud 22, R. de los Reyes 2, F. Rieger 2, L. Rob 43, C. Romoli 3, S. Rosier-Lees 38, G. Rowell 32,
B. Rudak 36, C.B. Rulten 19, V. Sahakian 5,4, D. Salek 44, D.A. Sanchez 38, A. Santangelo 21,
R. Schlickeiser 13, F. Schüssler 23, A. Schulz 39, U. Schwanke 6, S. Schwarzburg 21, S. Schwemmer 27,
H. Sol 19, F. Spanier 18, G. Spengler 28, F. Spies 1, Ł. Stawarz 10, R. Steenkamp 7,
C. Stegmann 37,39, F. Stinzing 40, K. Stycz 39, I. Sushch 6,18, J.-P. Tavernet 20, T. Tavernier 33,
A.M. Taylor 3, R. Terrier 33, M. Tluczykont 1, C. Trichard 38, K. Valerius 40, C. van Eldik 40,
B. van Soelen 42, G. Vasileiadis 22, J. Veh 40, C. Venter 18, A. Viana 2, P. Vincent 20,
J. Vink∗ 9, H.J. Völk 2, F. Volpe 2, M. Vorster 18, T. Vuillaume 34, S.J. Wagner 27,
P. Wagner 6, R.M. Wagner 28, M. Ward 8, M. Weidinger 13, Q. Weitzel 2, R. White 35,
A. Wierzcholska 25, P. Willmann 40, A. Wörnlein 40, D. Wouters 23, R. Yang 2, V. Zabalza 2,35, D. Zaborov 16, M. Zacharias 27, A.A. Zdziarski 36, A. Zech 19, H.-S. Zechlin 1
1 Universität Hamburg, Institut für Experimentalphysik, Luruper Chaussee 149, D 22761 Hamburg, Germany,
2 Max-Planck-Institut für Kernphysik, P.O. Box 103980, D 69029 Heidelberg, Germany,
3 Dublin Institute for Advanced Studies, 31 Fitzwilliam Place, Dublin 2, Ireland,
4 National Academy of Sciences of the Republic of Armenia, Marshall Baghramian Avenue, 24, 0019 Yerevan, Republic of Armenia ,
5 Yerevan Physics Institute, 2 Alikhanian Brothers St., 375036 Yerevan, Armenia,
6 Institut für Physik, Humboldt-Universität zu Berlin, Newtonstr. 15, D 12489 Berlin, Germany,
7 University of Namibia, Department of Physics, Private Bag 13301, Windhoek, Namibia,
8 University of Durham, Department of Physics, South Road, Durham DH1 3LE, U.K.,
9 GRAPPA, Anton Pannekoek Institute for Astronomy, University of Amsterdam, Science Park 904, 1098 XH Amsterdam, The Netherlands,
10 Obserwatorium Astronomiczne, Uniwersytet Jagielloński, ul. Orla 171, 30-244 Kraków, Poland,
11 now at Harvard-Smithsonian Center for Astrophysics, 60 Garden St, MS-20, Cambridge, MA 02138, USA,
12 Department of Physics and Electrical Engineering, Linnaeus University, 351 95 Växjö, Sweden,
13 Institut für Theoretische Physik, Lehrstuhl IV: Weltraum und Astrophysik, Ruhr-Universität Bochum, D 44780 Bochum, Germany,
14 GRAPPA, Anton Pannekoek Institute for Astronomy and Institute of High-Energy Physics, University of Amsterdam, Science Park 904, 1098 XH Amsterdam, The Netherlands,
15 Institut für Astro- und Teilchenphysik, Leopold-Franzens-Universität Innsbruck, A-6020 Innsbruck, Austria,
16 Laboratoire Leprince-Ringuet, Ecole Polytechnique, CNRS/IN2P3, F-91128 Palaiseau, France,
17 now at Santa Cruz Institute for Particle Physics, Department of Physics, University of California at Santa Cruz, Santa Cruz, CA 95064, USA,
18 Centre for Space Research, North-West University, Potchefstroom 2520, South Africa,
19 LUTH, Observatoire de Paris, CNRS, Université Paris Diderot, 5 Place Jules Janssen, 92190 Meudon, France,
20 LPNHE, Université Pierre et Marie Curie Paris 6, Université Denis Diderot Paris 7, CNRS/IN2P3, 4 Place Jussieu, F-75252, Paris Cedex 5, France,
21 Institut für Astronomie und Astrophysik, Universität Tübingen, Sand 1, D 72076 Tübingen, Germany,
22 Laboratoire Univers et Particules de Montpellier, Université Montpellier 2, CNRS/IN2P3, CC 72, Place Eugène Bataillon, F-34095 Montpellier Cedex 5, France,
23 DSM/Irfu, CEA Saclay, F-91191 Gif-Sur-Yvette Cedex, France,
24 Astronomical Observatory, The University of Warsaw, Al. Ujazdowskie 4, 00-478 Warsaw, Poland,
25 Instytut Fizyki Ja̧drowej PAN, ul. Radzikowskiego 152, 31-342 Kraków, Poland,
26 School of Physics, University of the Witwatersrand, 1 Jan Smuts Avenue, Braamfontein, Johannesburg, 2050 South Africa,
27 Landessternwarte, Universität Heidelberg, Königstuhl, D 69117 Heidelberg, Germany,
28 Oskar Klein Centre, Department of Physics, Stockholm University, Albanova University Center, SE-10691 Stockholm, Sweden,
29 Wallenberg Academy Fellow, ,
30 Université Bordeaux 1, CNRS/IN2P3, Centre d’Études Nucléaires de Borde
H.E.S.S. Collaborationaux Gradignan, 33175 Gradignan, France,
31 Funded by contract ERC-StG-259391 from the European Community, ,
32 School of Chemistry & Physics, University of Adelaide, Adelaide 5005, Australia,
33 APC, AstroParticule et Cosmologie, Université Paris Diderot, CNRS/IN2P3, CEA/Irfu, Observatoire de Paris, Sorbonne Paris Cité, 10, rue Alice Domon et Léonie Duquet, 75205 Paris Cedex 13, France,
34 Univ. Grenoble Alpes, IPAG, F-38000 Grenoble, France; CNRS, IPAG, F-38000 Grenoble, France,
35 Department of Physics and Astronomy, The University of Leicester, University Road, Leicester, LE1 7RH, United Kingdom,
36 Nicolaus Copernicus Astronomical Center, ul. Bartycka 18, 00-716 Warsaw, Poland,
37 Institut für Physik und Astronomie, Universität Potsdam, Karl-Liebknecht-Strasse 24/25, D 14476 Potsdam, Germany,
38 Laboratoire d’Annecy-le-Vieux de Physique des Particules, Université de Savoie, CNRS/IN2P3, F-74941 Annecy-le-Vieux, France,
39 DESY, D-15738 Zeuthen, Germany,
40 Universität Erlangen-Nürnberg, Physikalisches Institut, Erwin-Rommel-Str. 1, D 91058 Erlangen, Germany,
41 Centre for Astronomy, Faculty of Physics, Astronomy and Informatics, Nicolaus Copernicus University, Grudziadzka 5, 87-100 Torun, Poland,
42 Department of Physics, University of the Free State, PO Box 339, Bloemfontein 9300, South Africa,
43 Charles University, Faculty of Mathematics and Physics, Institute of Particle and Nuclear Physics, V Holešovičkách 2, 180 00 Prague 8, Czech Republic,
44 GRAPPA, Institute of High-Energy Physics, University of Amsterdam, Science Park 904, 1098 XH Amsterdam, The Netherlands
∗To whom correspondence should be addressed;
E-mail: nukri.komin@wits.ac.za, chia-chun.lu@mpi-hd.mpg.de,
michael.mayer@physik.hu-berlin.de, stefan.ohm@desy.de, j.vink@uva.nl
Supplementary Materials
Appendix A Materials and Methods
A.1 Correction factor for 30 Dor C flux
The superbubble 30 Dor C and the PWN N 157B have an angular distance of , while the angular resolution ( containment radius of the point-spread-function (PSF)) of H.E.S.S. is . The flux of -ray sources is calculated from the excess of -like events in a pre-defined on-region. As the reconstructed flux of 30 Dor C has been estimated within a test region of around the center of the X-ray superbubble, a part of the -rays from N 157B lies in this on-region due to the tails of the PSF. These additional -rays will result in a larger reconstructed flux for 30 Dor C, and need to be corrected for in order to estimate the “true” flux of 30 Dor C.
The H.E.S.S. PSF is approximately radially symmetric. As the reconstructed extension of N 157B is compatible with that expected for a point source, the distribution of -rays from N 157B is expected to be radially symmetric. Five circular spill-over test regions of a radius of are placed at the same angular distance as between N 157B and 30 Dor C, but rotated around N 157B, as shown in Fig. 5, to estimate the -ray excess contributed by N 157B in the 30 Dor C on-region.
In total, -like excess (using the reflected background method (?)) have been recorded in the test regions, with an area 5 times larger than the on-region. The average -ray excess contributed by N 157B in the 30 Dor C on-region is thus estimated to be . Excluding the region of highest or lowest excess does not significantly change this number, demonstrating the robustness of this estimate with respect to the location of the spill-over test regions. The excess from 30 Dor C before correction is , implying a flux contamination of . The measured flux was correspondingly scaled down by a factor . As the reconstructed -ray spectral index of the superbubble and the PWN are consistent within errors and the energy dependence of the PSF is small in the energy range discussed here, the correction factor is considered to be independent of reconstructed -ray energy.
Another method to calculate the true excess from 30 Dor C is to use the spill-over test regions as background regions. In total, and -like events (including true -rays and -like CRs) have been recorded in the 30 Dor C on-region and the test regions, respectively. The excess from 30 Dor C calculated in this way is , consistent with the value derived from the previous method.
A.2 Fermi-LAT analysis
A search for GeV -rays from the sources detected by H.E.S.S. has been carried out using data from the space-born Fermi-LAT instrument. The LAT is a pair-conversion telescope, operating in the energy range between MeV and GeV. A description of the instrument- and mission-related details is given in (?). Based on the data from an 11 month observation period, the detection of diffuse emission from the Large Magellanic Cloud, best described by either a two-component Gaussian template or an HII template, has been reported (?). Emission from individual point-like sources above this diffuse emission has not been detected in this data-set.
To derive the -ray flux upper limits shown in Figure 4 in the main article, more than 5 years of spacecraft data (2008-08-04 – 2013-10-21) have been analyzed using the Fermi Science Tools (FST) package with version v9r31p1111http://fermi.gsfc.nasa.gov/ssc/data/analysis/documentation/Cicerone/. Only events between GeV have been considered, which results in an excellent angular resolution of and reduces the contribution from the diffuse emission component. Events within a by region and with zenith angles below , centered on RA and Dec (J2000) were analyzed with a binned likelihood analysis using the P7Clean_V6 instrument response functions.
Sources have been modeled according to the Fermi 2-year catalog (?), and additional point-like sources at the positions of 30 Dor C, N 132D, N 157B, and SN 1987A have been added. Note that significant diffuse emission has been detected towards N 157B (?). As the origin of this emission cannot unambiguously be attributed to one of the H.E.S.S. sources, the narrow Gaussian component (G2 in (?)) was removed from the model. The normalization of all sources within as well as that of all diffuse sources has been left free in the fit.
The -ray flux upper limits have been derived in three energy bands: GeV, GeV, and GeV, assuming a power-law in energy with spectral indices as reconstructed for the H.E.S.S. sources (see Table 1). In the case of SN 1987A only flux upper limits could be derived in the TeV regime, therefore a spectral index of , as motivated by (?), is assumed.
A.3 SED modelling of 30 Dor C and N 132D
The leptonic and hadronic model curves shown in Figure 3 in the main paper have been obtained using a model for the time-dependent injection and interaction of electrons and protons (e.g. (?)).
For 30 Dor C electrons and protons are injected at a constant rate and cool via synchrotron and Inverse Compton processes, and proton-proton collisions, respectively. Given the rather low densities under consideration, we ignore Bremsstrahlung and Coulomb losses. The energy-dependent proton-proton cross-section is taken from (?). In a purely hadronic scenario, a total energy in interacting protons of erg is required to explain the H.E.S.S. data (correcting for a 30% contamination from N 157B, and assuming a cutoff energy of 100 TeV and proton spectral index ). This energy needs to be increased to erg, if the cut-off energy in the proton spectrum is reduced to 30 TeV. When assuming a different proton spectral index, the required energy in interacting protons increases significantly to e.g. for the case.
A source of uncertainty in the leptonic scenario is the different radiation fields that contribute to the Inverse Compton process. One component is the 40 K radiation field from 30 Dor C, which we assume to have a constant energy density of 0.5 eV cm-3. The second component originates from the 30 Doradus region. Depending on the integration region of the Tarantula nebula, and the definition of the background region, the radiation field energy density varies between 0.5 eV cm-3 and 1.5 eV cm-3. Note that these estimates assume that the Tarantula nebula and 30 Dor C are at the same projected distance. The derived magnetic fields for these radiation fields vary between 10G and 18G. The energy in electrons is erg to erg for the different models. The X-ray data for 30 Dor C are from (?) and Fermi-LAT limits on the GeV -ray flux have been derived as discussed above.
The modelling of the N 132D SED has been performed in a similar way to the modelling of 30 Dor C. Radio data are from (?), whereas for the upper limit on the X-ray synchrotron flux from N 132D we reanalyzed Chandra data, and based our estimates only on the keV band, which is poor in X-ray line emission (see below). The SNR shell is interacting with a nearby molecular cloud, which is also bright in infrared wavelengths. Given the complex morphology and limited angular resolution of HESS, it is not clear where the HESS emission is coming from. We therefore assume that all the infrared emission (which has a total flux of 3 Jy, (?)) peaks at about 20 m (145 K temperature) and is located in the shell, which has a radius of 11 pc. The actual infrared radiation energy density experienced by the VHE electrons depends on the locations of the VHE electrons, which could be the forward, but perhaps also the reverse shock, with respect to the location from which infrared emission is emitted. If the VHE electrons are located all around the forward shock, and the IR emission emerges from within N 132D all IR photons can in principle be up scattered. Here we assume that about 50% of the photons encounter regions with VHE electrons. Under this assumption the leptonic scenario for the combination of -ray flux and the X-ray synchrotron flux upper limit requires a magnetic field of 20G. Ignoring the IR radiation fields, and thus only considering the Cosmic Microwave Background Radiation (CMBR), the derived magnetic field is 15G. The 20G field is roughly a factor two lower than the equipartition magnetic field in this object. Note, however, that a detailed modelling of the radiation field is beyond the scope of this paper. All input parameters for the non-thermal emission model are summarized in Table 2.
| Parameter | age | , | , | ||||||
|---|---|---|---|---|---|---|---|---|---|
| yrs | TeV | G | cm-3 | erg | erg | K | eV cm-3 | ||
| 30 Dor C | 6000 | 2.0 | 100 | 15 | 40 | 0.38 | 15 | 88, 40 | 1.5, 0.5 |
| N 132D | 2350 | 2.0 | 30 | 20 | 40 | 1.0 | 25 | 145 | 1.0 |
A.4 X-ray Analysis of 30 Dor C and N 132D
The X-ray image of 30 Dor C shown in Fig. 1 in the main article was obtained from XMM-Newton observations (Observation IDs 113020201 and 104660301). Only the MOS1 and MOS2 detectors were used. The data reduction was carried out using the XMM-Newton software of the XMM-Newton Science Analysis Software (SAS, http://xmm.esac.esa.int/sas/). Calibrated event lists were produced for each exposure using the SAS emchain script. The periods affected by soft proton flaring were excluded (?). To generate images in the energy band keV, we created the quiescent particle background (QPB) images, the count images and model exposure maps for each observation and each instrument, using mos-spectra and mos back scale. The combined mosaic map was finally computed taking into account the different efficiencies of the two instruments. The image has been smoothed with a Gaussian with a width of .
The upper limit on the X-ray synchrotron emission of N 132D in the keV continuum dominated band is based on the Chandra X-ray observation of January 9, 2006 (ObsID 5532) processed with the CIAO v4.5 software. We conservatively assumed that all the continuum is X-ray synchrotron emission, whereas in reality a thermally dominated origin for the continuum emission is more likely given that the spectrum is rich in line emission.
A.5 Radiation Fields in N 157B
The magnetic field estimates presented in the N 157B section in the main article sensitively depend on the measured -ray and X-ray spectra, as well as the ratio between the energy densities of magnetic fields and radiation fields. Depending on the location of N 157B in the LMC along the line of sight, different radiation fields can potentially act as target for the IC scattering of high-energy electrons accelerated in N 157B. Besides the omnipresent CMBR, also the infrared radiation from the 30 Doradus star-forming region and the OB association LH 99 can potentially contribute (if not dominate). Table 3 summarizes the properties of all radiation fields that potentially act as targets for the high-energy electrons accelerated in N 157B.
We study two extreme cases with maximum and minimum radiation field energy densities to derive upper and lower limits on the magnetic field in the PWN. In Scenario A it is assumed that N 157B is related to LH 99 and is located at the same projected distance as this OB association, implying that the CMBR, as well as radiation associated with 30 Doradus and LH 99, contribute to the target radiation fields. In Scenario B, N 157B is assumed to be unrelated to LH 99 and to have large distances both to the OB association and to 30 Doradus so that only the CMBR contributes.
Several authors argue that N 157B is located in or behind the OB association (?, ?, ?), which would support Scenario A. In this case the dust emission of LH 99 would be the dominant radiation field. The peak of the corresponding infrared emission is centred on the HII region associated with the young stellar object 2MASS J053750276911071, which is at a projected distance of from N 157B. As shown in (?), a two-component (cold dust and warm dust) modified black body model best describes the spectral energy distribution of the infrared emission from the OB association.
| Radiation Field | Temperature | Energy Density |
|---|---|---|
| K | eV cm-3 | |
| CMBR | 2.7 | 0.26 |
| 30 Doradus | 88 | 2.7 |
| LH 99 (cold dust) | 29 | 12.7 |
| LH 99 (warm dust) | 230 | 5.7 |
The LH 99 components have been modeled by the modified blackbody model proposed in (?), whereas the CMBR and 30 Doradus components are modeled as pure blackbody emitters. Since N 157B is potentially inside the 2MASS J053750276911071 HII region, the derived energy densities were furthermore scaled up by a factor of 1.5, as would be expected for an object at the edge of a homogeneously emitting sphere (?).
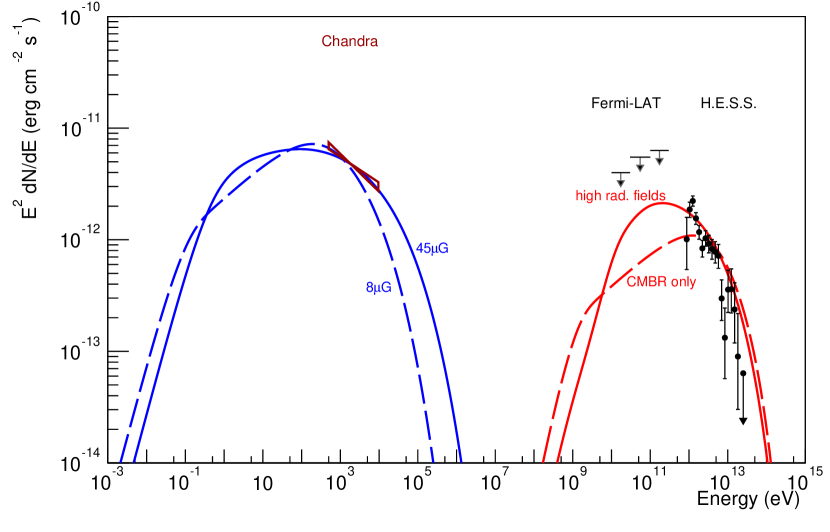
Figure 6 shows the spectral energy distribution of N 157B from radio wavelength to -ray energies and the broadband synchrotron and IC emission expected for the time-independent injection of relativistic electrons ( TeV) over the lifetime of PSR J05376910. In Scenario A an injection of electrons at a constant rate of 7% of the current spin-down power of PSR J05376910 is required to explain the SED, i.e. . In this case, a magnetic field of 45 G is required to fit the data. Since the cooling time of electrons that produce the observed X-ray and TeV emission would be very short (i.e. years for TeV), the spin-down power of the pulsar should not have changed significantly on the scale of the electron cooling time. Consequently, this magnetic field estimate is rather insensitive to the power-law index or cut-off energy of the injected electrons, as well as to the age or braking index of the pulsar. In contrast, in Scenario B, a much smaller magnetic field strength is required to explain the data. At the same time, the power injected into the nebula needs to be increased to 45%. The smallest field strength still compatible with the X-ray and TeV -ray data is 8 G, although the spectral shape at keV energies is poorly reproduced in the low-field case. This mismatch could be overcome if a distribution of magnetic field values is considered, instead of a single-magnetic field. The power injected into the nebula of N 157B in this scenario is comparable to the Crab, however, the magnetic pressure would be much lower (a factor 240). In this scenario, electron cooling times are much longer (i.e. years for TeV) and the model is less reliable.
Note that the modelling of the -ray spectrum is insensitive to the exact choice of the low-energy cut-off in the electron spectrum (400 GeV in this case) as H.E.S.S. spectral points only start at 800 GeV. Even higher-energy electrons are responsible for the observed X-ray emission. The required fraction of pulsar spin down injected into the nebula, however, does change with the minimum electron energy.
A.6 On the flux of N 157B
The differential flux of N 157B of increased by 64% compared to the previously published value (?). A reanalysis of the data set which was used in the previous publication yields spectral results compatible to the values reported here. Thus, the change of the reported flux is not intrinsic to the source, the -ray emission of N 157B should be considered as being constant.
The results presented here and in the previous publication (?) use an image-fitting analysis (?) which provides an improved angular resolution and a higher -ray efficiency. But this reconstruction is also much more susceptible to imperfections in the detailed modelling of the instrument response than the classical Hillas-based analysis. One such imperfection was a misaligned camera which is now corrected in the analysis. In the initial publication (?) this correction was not yet taken into account. The misaligned camera results not only in an underestimated extend of the point-spread function but also in a global shift of the ShowerGoodness, the main event selection parameter (?). The global shift of the ShowerGoodness parameter leads to a misclassification of actual -rays as background and thus an underestimation of the true -ray flux.
This systematic error is relevant only for a small number of publications, which utilise the image-fitting analysis (?). A re-analysis of affected sources is currently underway and errata will be published in due time.