Indirect Violation in Decays at LHCb
Abstract:
Indirect violation in the system can be probed by measuring the parameter , defined as the asymmetry of the effective lifetime of the meson decaying to a eigenstate. This can be significantly enhanced beyond Standard Model predictions by new physics. Measurements of using and decays reconstructed from collisions collected by the LHCb experiment, corresponding to an integrated luminosity of 1.0 , are presented. The results are
where the uncertainties are statistical and systematic, respectively. These are the most precise measurements of their kind to date, and show no evidence of violation.
1 Introduction
Similarly to the and systems, the mass eigenstates of the system, , with masses and widths , are superpositions of the flavour eigenstates , where and are complex and satisfy . This causes mixing between the and states, and allows for “indirect” violation in mixing, and in interference between mixing and decay, when decaying to a eigenstate. Indirect asymmetries in the system can be significantly enhanced beyond Standard Model (SM) predictions by new physics [1]. In decays of mesons to a eigenstate , indirect violation can be probed using [2]
where is the inverse of the effective lifetime of the decay, is the eigenvalue of , , , , , with the decay amplitude, and . The effective lifetime is defined as the average decay time of a particle with an initial state of or , i.e. that obtained by fitting the decay-time distribution of signal with a single exponential.
The LHCb detector at the LHC, CERN, is a forward-arm spectrometer, specifically designed for high precision measurements of decays of and hadrons [3]. During 2011 the experiment collected collisions at corresponding to an integrated luminosity of 1.0 . Due to the large production cross section [4], the decay-time resolution of approximately 50 for decays [5] and the excellent separation of and achieved by the detector [6], it is very well suited to measure with high precision.
2 Methodology
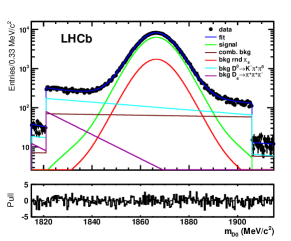
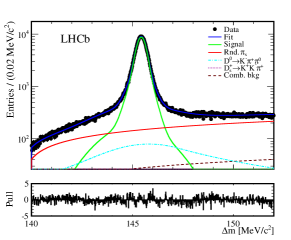
The decay chain is used to determine the flavour of the candidates at production, via the charge of the meson. The -even and final states are used to calculate [7]. The predominant candidate selection criteria require the or tracks to have large impact parameter (IP), large transverse momentum (), invariant mass within 50 of the world average mass, and for the vector sum of their momenta to point closely back to the position of the collision. Using data corresponding to an integrated luminosity of 1.0 , 4.8M candidates and 1.5M candidates are selected. The data are divided by flavour, the polarity of the LHCb dipole magnet, and two separate running periods. Combinatorial and partially reconstructed backgrounds are discriminated using a simultaneous fit to the distributions of mass and . Examples of these fits are shown in Fig. 1 for candidates, for data recorded with the magnet polarity down during the earlier of the two running periods.
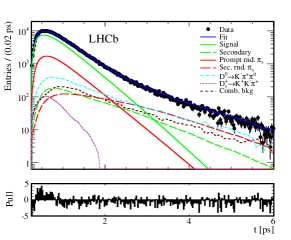
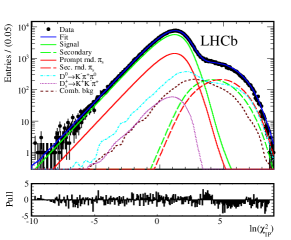
A fit to the decay-time distribution of the candidates is then used to determine the effective lifetimes of the and signal. Only candidates for which the is produced directly at the collision are considered as signal. The background from decays is discriminated by simultaneously fitting the distributions of the decay time and the natural logarithm of the of the hypothesis that the candidate originates directly from the collision (). The selection efficiency as a function of decay time is obtained from data using per-candidate acceptance functions, as described in detail in Ref. [8]. The decay-time and distributions for combinatorial and specific backgrounds are obtained from the data using the discrimination provided by the mass and fits to employ the Weights technique [9] with kernel density estimation [10]. Figure 2 shows fits to the distributions of decay time and for candidates, using the same data subset as Fig. 1. Inaccuracies in the fit model are examined as a source of systematic uncertainty, as discussed in the following section.
3 Results and systematics
The fits detailed in the previous section find
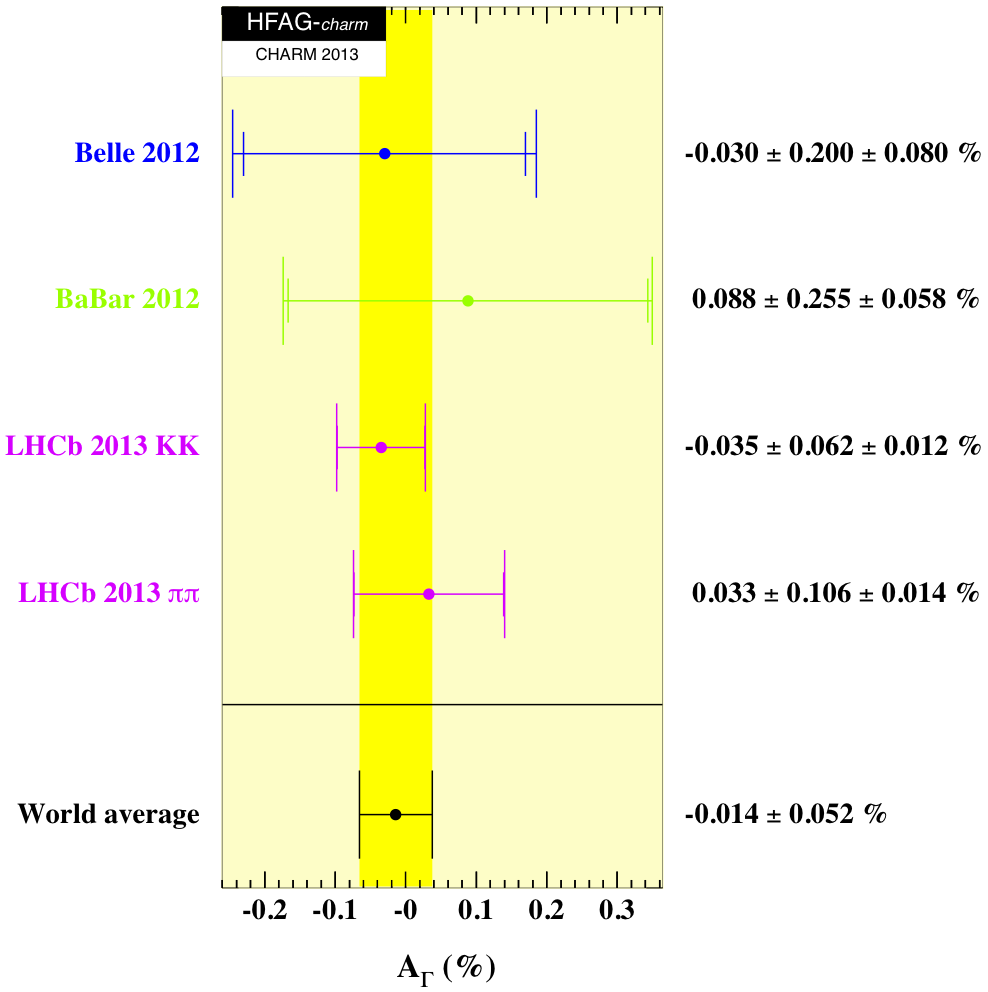
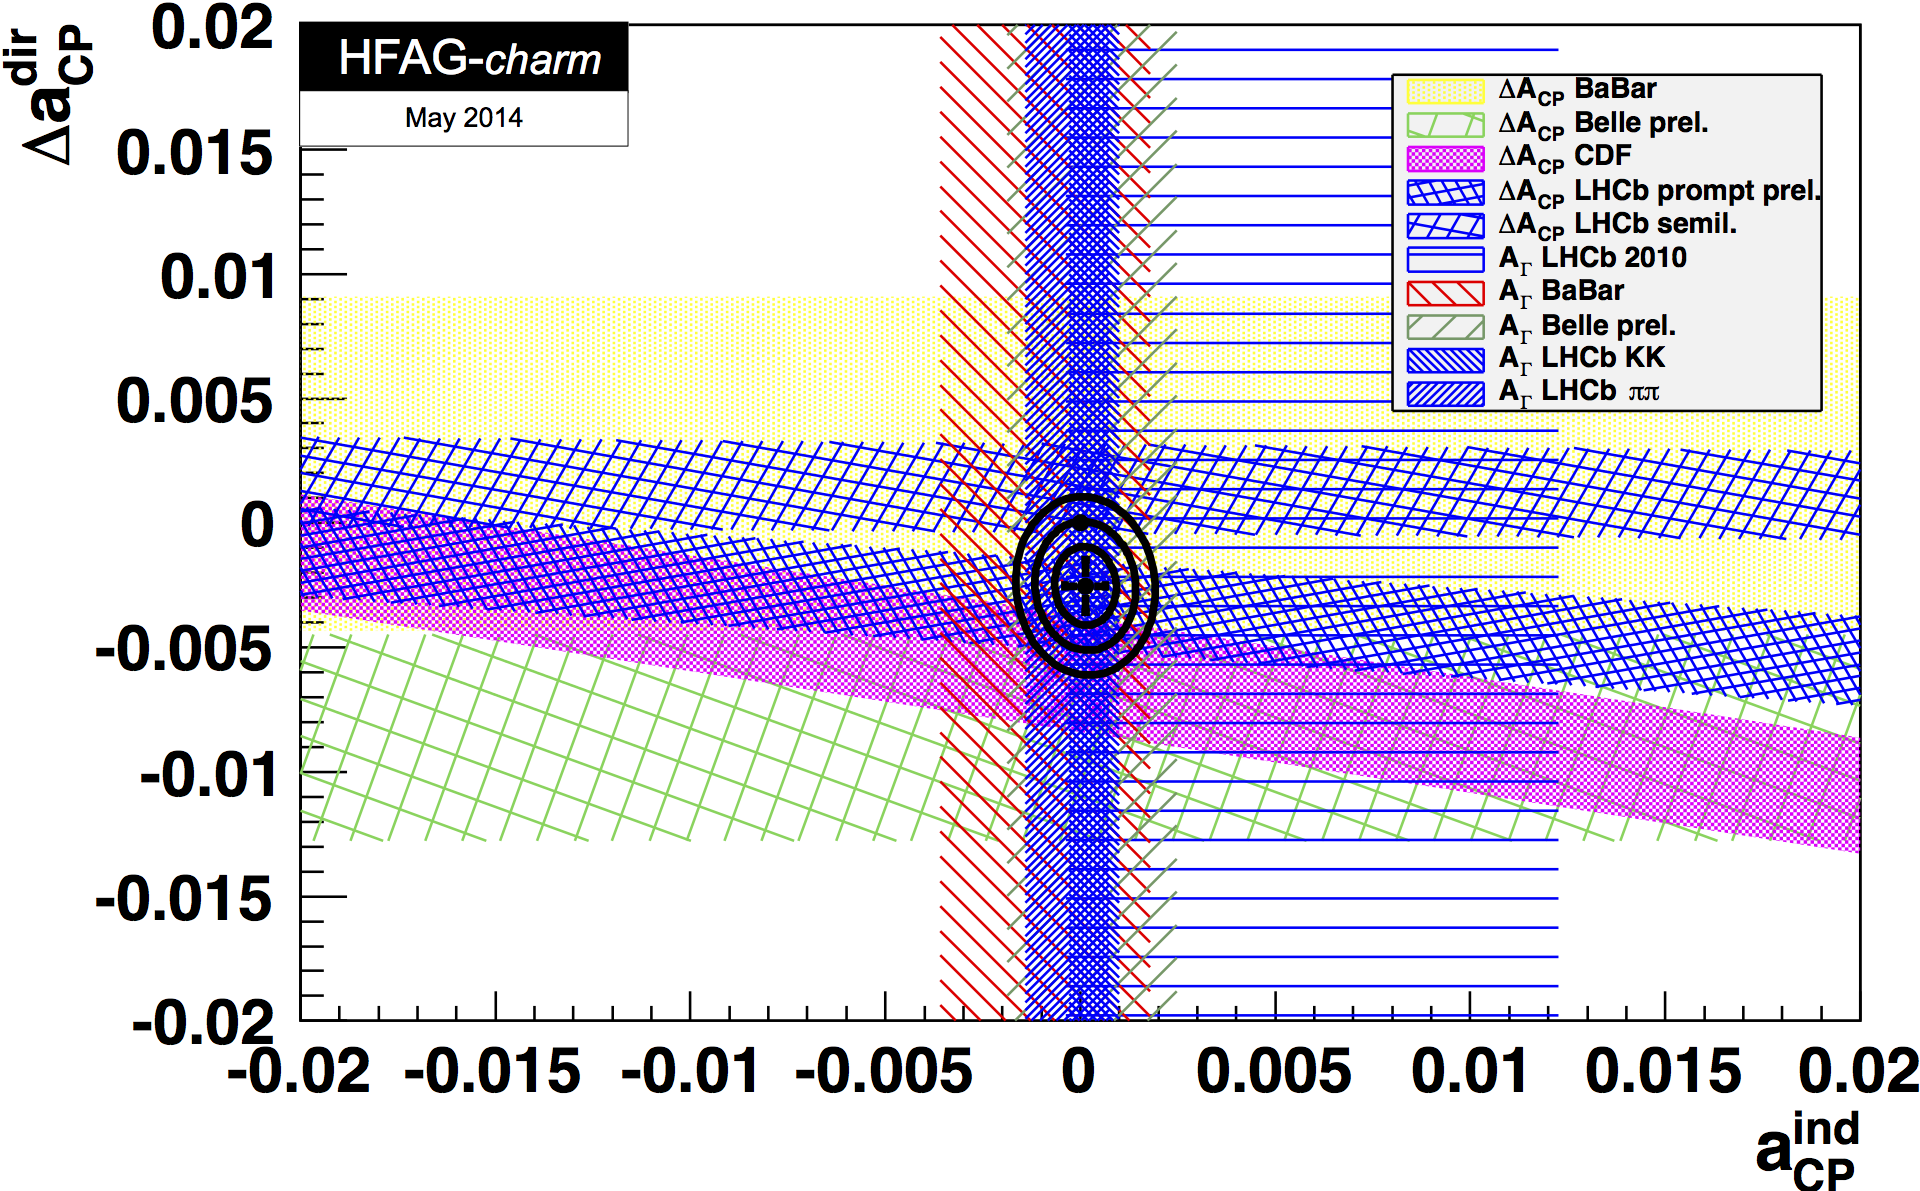
where the uncertainties are statistical and systematic, respectively. These are the most precise measurements of their kind to date, and show no evidence of violation. The dominant systematic uncertainties arise from the modelling of the selection efficiency as a function of decay time, and the modelling of the background from decays. Figure 3 (left) shows the world average of , which is dominated by these measurements and is consistent with zero. Figure 3 (right) shows the combined fit to measurements of direct and indirect violation in decays, which yields a p-value for zero violation of 5.1 % [11].
The precision of these measurements will be improved by the addition of 2.1 of data already collected during 2012. Together with data to be recorded in run II, and, in time, following the LHCb upgrade, measurements with precisions of approximately are possible, giving great potential for the discovery of indirect violation in the system.
References
- [1] M. Bobrowski, A. Lenz, J. Riedl, and J. Rohrwild. How Large Can the SM Contribution to CP Violation in Mixing Be? JHEP, 1003:009, 2010.
- [2] M. Gersabeck, M. Alexander, S. Borghi, V. V. Gligorov, C. Parkes. On the interplay of direct and indirect CP violation in the charm sector. J. Phys. G: Nucl. Part. Phys., 39, 2012. 045005.
- [3] The LHCb collaboration. The LHCb Detector at the LHC. JINST, 3(S08005), 2008.
- [4] The LHCb collaboration. Prompt charm production in pp collisions at. Nuclear Physics B, 871(1):1 – 20, 2013.
- [5] The LHCb VELO group. Performance of the LHCb Vertex Locator. JINST, 9:09007, 2014.
- [6] The LHCb RICH group. Performance of the lhcb rich detector at the lhc. The European Physical Journal C, 73(5), 2013.
- [7] The LHCb collaboration. Measurements of indirect CP asymmetries in and decays. Phys.Rev.Lett., 112(4):041801, 2014.
- [8] The LHCb collaboration. Measurement of mixing and CP violation parameters in two-body charm decays. JHEP, 1204:129, 2012.
- [9] Muriel Pivk and Francois R. Le Diberder. sPlot: a statistical tool to unfold data distributions. Nucl. Instrum. Meth. A, 555:356–369, 2005.
- [10] David W. Scott. Multivariate Density Estimation: Theory, Practice, and Visualization. Wiley Series in Probability and Mathematical Statistics. John Wiley & Sons, Inc., 1992.
- [11] The Heavy Flavor Averaging Group. http://www.slac.stanford.edu/xorg/hfag/, August 2014.