Development of a Big Data Framework for Connectomic Research
Abstract
This paper outlines research and development of a new Hadoop-based architecture for distributed processing and analysis of electron microscopy of brains. We show development of a new C++ library for implementation of 3D image analysis techniques, and deployment in a distributed map/reduce framework. We demonstrate our new framework on a subset of the Kasthuri11 dataset from the Open Connectome Project.
Index Terms:
brain; electron microscopy; connectome; hadoop; map/reduce; service;I Introduction
In recent years, there has been rapid growth in research on the human brain, as well as brains of other animals. The improvement and wide applicability of non-invasive techniques, such as fMRI and new high-resolution electron microscopy, are fueling new research on brain physiology, and brain function. In the past, advanced research on brain physiology was constrained to domain experts from the medical fields, neuroscience and other researchers with access to limited datasets. The advent of “big data” ecosystems, coupled with new brain research initiatives, large datasets and techniques are becoming more widely available. This is opening a new set of problems to a wider audience of professionals from computer science, mathematics and engineering.
This paper outlines a framework for developing and deploying image-based analytics on high-resolution electron microscopy of animal brains. Our focus is design and development of a “full-stack” prototype for deploying analytics in a Hadoop map/reduce ecosystem. By “full-stack”, we include interfaces and services that implement a pipeline from data download to distributed analytic processing and results output. This task was challenging in a short time-frame, so much more work is required to produce a mature system that can be used broadly. This work was completed as part of a graduate course at Columbia University, called “Big Data Analytics”. We plan to continue this research in the follow-on course, “Advanced Big Data Analytics”.
II Related Works
Big Data Analytics is a broad area of research. By its nature, it encompasses research on large frameworks for processing massive quantities of data. Often the data is disparate and multi-modal. Finally, the goal is state-of-the-art application of cutting-edge analytics in a large framework. In recent years, there has been tremendous growth in development of breakthrough advanced mathematical and computer science methods for tackling big data.
In computer vision, areas such as deep learning are advancing the state-of-the-art in significant ways. Also, for years, research and development of probabilistic graphical models, belief propagation and graph analytics have pushed state-of-the-art forward. In particular, in areas of face detection and recognition, probabilistic graphical models have been known to produce state-of-the-art accuracy, when coupled with robust feature extraction, and careful training.
Currently, several centers are researching and developing new technologies that address brain understanding problems. New insight is being gained by collection massive quantities of high resolution imagery, and advanced analytic processing in large frameworks. For this project, we were fortunate to leverage expertise from the Open Connectome Project. See [2], [5] and [7] for further details on this project.
There is a proliferation of big data frameworks, distributed processing and storage architectures, as well as stream processing environments. Prior to undertaking analytic research and development, we surveyed several publicly-available distributed processing frameworks. We wanted to make early decisions on which programming languages and libraries to focus on. Below we provide a list of some of the frameworks that were considered for this project. We do not provide details on each framework here.
II-A Some Publicly-Available Processing Frameworks
Here is a list of publicly available distributed processing frameworks that were considered for this final project:
-
1.
Hadoop Map/Reduce
-
2.
Apache Spark
-
3.
Apache (Twitter) Storm
-
4.
Yahoo! S4
-
5.
IBM InfoSphere Streams
-
6.
MIT CSAIL Streamit
-
7.
ZeroC ICE
-
8.
FastFlow (with ZeroMQ)
-
9.
Muesli
-
10.
SkeTo
-
11.
RayPlatform
-
12.
CAF (C++ Actor Framework)
-
13.
FlowVR
-
14.
OpenMP & MPI
-
15.
Intel TBB
-
16.
Apache (Facebook) Thrift
III System Overview

Developing all the components from Figure 1 in a short time frame is very challenging. We divided research into the following categories:
-
1.
Distributed Download Service
-
2.
Image Handling Service
-
3.
On-demand Web Service
-
4.
Feature Extraction Service
-
5.
Feature Matching Service
-
6.
Graph Reconstruction
One or more components have been developed in each of the six categories above. At this time, a complete pipeline is not fully constructed. We stood-up a cluster of commodity computers for the purpose of this course. We continue to use this cluster for development, testing and giving demos of our services.
Our system is called cloud ganita, and the following section provides more detail. Following that, we describe data used for this project and then outline various components developed for the course project: Brain Edge Detection.
III-A Cloud Ganita
All installations, maintenance and system administration were performed on a small cluster, stood-up for this project. The table below shows the role of individual nodes in the Cloud Ganita cluster.
| Computer name | Hadoop/YARN Type(s) | HBASE/Zookeeper Type |
|---|---|---|
| ganita8 | NN, DN, NM | HM, QP, HRS |
| ganita7 | DN, NM | RS, QP |
| ganita6 | DN, NM | HBM, RS, QP |
| ganita5 | RM, DN, NM, JHS | No ZK |
| ganita4 | DN, NM, JHS | No ZK |
NN=NameNode, RM=ResourceManager, DN=DataNode, NM=NodeManager, JHS=JobHistoryServer, ZK=ZooKeeper, HM=HBase Master, HBM=HBase Backup Master, RS=HBase RegionServer, QP=ZK QuorumPeer, HRS=HBase RESTServer
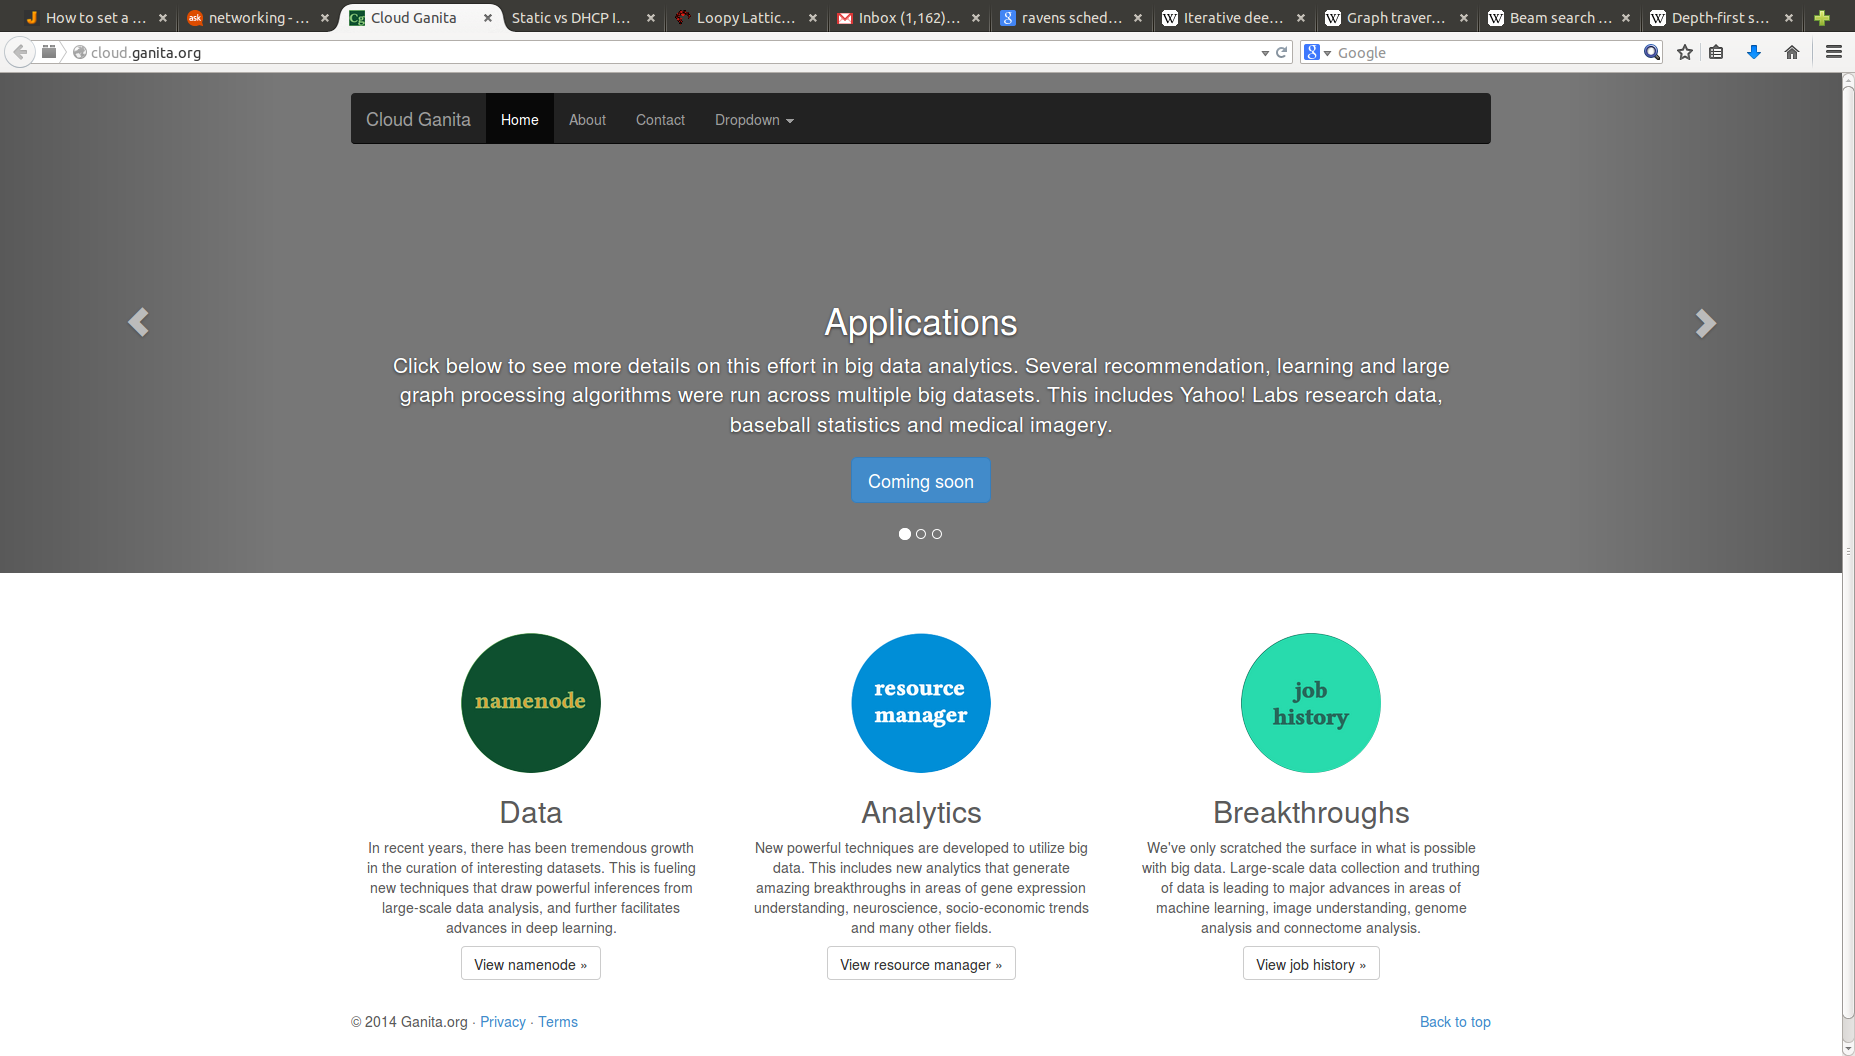
Figure 2 shows a web interface created for this project. From the web interface, it is possible to view namenode, resource manager and job history on the Hadoop cluster. It is currently password protected. Log in - username: ganita and password: cloud.
III-B OCP Electron Microscopy
All of the data used for this project was made available by the Open Connectome Project (OCP). 111See http://www.openconnectomeproject.org/. We focused on high-resolution electron microscopy collected by Bobby Kasthuri (BU & Harvard). It is known as the Kasthuri11 dataset. Here is a description of this data:
-
•
OCP data is available via a RESTful interface
-
•
3x3x30 cubic nanometer spatial resolution
-
•
660 GB of images
-
•
Up to 1,000,000,000,000 pixels
-
•
Focused on 10752 x 13312 x 1850 resolution
-
•
265 billion pixels
-
•
Info http://openconnecto.me/ocp/ca/kasthuri11/info/
III-C System Components
The distributed download service has a UI and allows a user to carve out HDF5 voxels for download and indexing into HDFS. The UI is built using html5, javascript and php. The php commands partition the EM blocks into a manageable number of slices and load a configuration file into HDFS. Then, a php command launches a Hadoop map/reduce job that feeds lines from the configuration file to a ruby script. The ruby script uses curl on each configuration line to start the download from any one of the datanodes in our cluster.
The image handling service allows conversion of hdf5 image data into any of the following formats:
-
•
Uncompressed imagery (PNM/PPM/PGM)
-
•
PNG compressed images
-
•
JPEG compressed images
-
•
OGG/Theora compressed video
-
•
MP4/H.264 compressed video
We used ffmpeg along with the plug-in codecs: libogg, libtheora, libx264, and the standard codecs.
The on-demand web service is the user interface for automatically downloading voxels from OCP.
The feature extraction service includes two main components. The first is a newly built C/C++ library for extracting gradient features from EM data. The second is integration of OpenCV into the cloud environment and application of standard OpenCV feature extractors to the converted imagery. OpenCV is the prevailing open package for deploying and running computer vision algorithms on image or video.
The feature matching service is still in development. It will include feature matching from OpenCV, along with newly created matchers in a C/C++ library.
We may also continue to explore feature extraction and matching in Matlab. It enables quick development of new advanced algorithms. Also, OCP has built a new powerful API (called Cajal3d) that will work directly with the OCP RESTful interface.
For graph reconstruction, we have begun development of a new graph processing engine in C/C++. This engine will be tailored to the EM brain data. Plans are to integrate this engine with other existing graphical capabilities such as System G, libDAI, etc.
IV Algorithms
Several tools and algorithms have been researched and developed for the purpose of processing electron microscopy. Only recently, have massive volumes of high-res EM scans of brains been available. Typically, in the medical imaging fields, focus has been on lower resolution 2D imagery.
Recently, the Open Connectome Project has built a big data framework (using Sun Grid Engine) for deploying computer vision algorithms in a distributed manner. Also, created by OCP is a Matlab API for rapidly developing and testing new algorithms in this framework.
We found that advanced and robust computer vision algorithms are developed in Matlab, C/C++, or in CUDA. We have made an early decision to focus on three main languages (or development environments) for creating new algorithms. With our eye on future research to include development of deep learning algorithms, probabilistic graphical models and dynamical systems approaches, we will focus on a few different deploy-and-test environments.
-
1.
Matlab OCP Sun Grid Engine
-
2.
C/C++ Hadoop streaming & InfoSphere Streams
-
3.
CUDA GPU & caffe
For this paper, we focus on research and development of C/C++ algorithms and deployment of some of these algorithms in a Hadoop map/reduce framework.
Here is a list of the main algorithms developed for this effort:
-
1.
Hadoop streaming HDF5 download service
-
2.
Image handling service (data conversion)
-
3.
Feature building (C++)
-
4.
Graph analytic starter engine (C++)
-
5.
Web interface for project and basic service (html5/JS)
Also, we started testing of basic computer vision feature extractors from OpenCV on the EM data. However, since these algorithms are designed for 2-dimensional data (images or motion frames), we have started development of a new C/C++ library for integration of 3-dimensional volumetric processing of EM data. Initially, we focused on research and development of 3D gradient feature extractors. We developed a 3D Sobel operator, along with modified versions for tuning on high-res EM volumes.
IV-A 3D Sobel Operator
We developed a standard 3D Sobel operator for application on EM voxels. We used the following kernel:
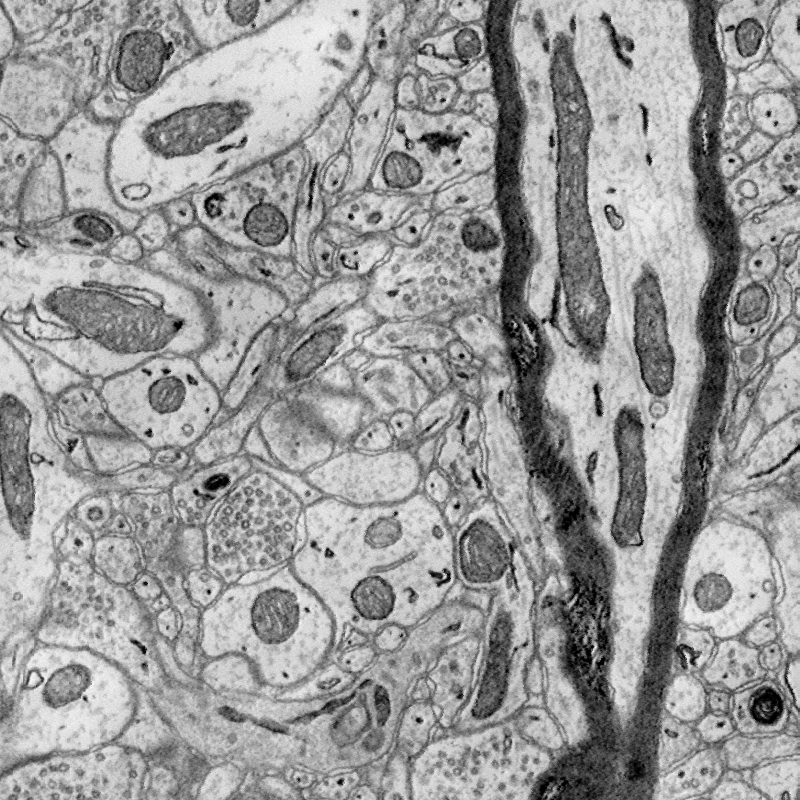
Below are two images: the first shows an original EM slice, and the second shows the output of the 3D Sobel operator.
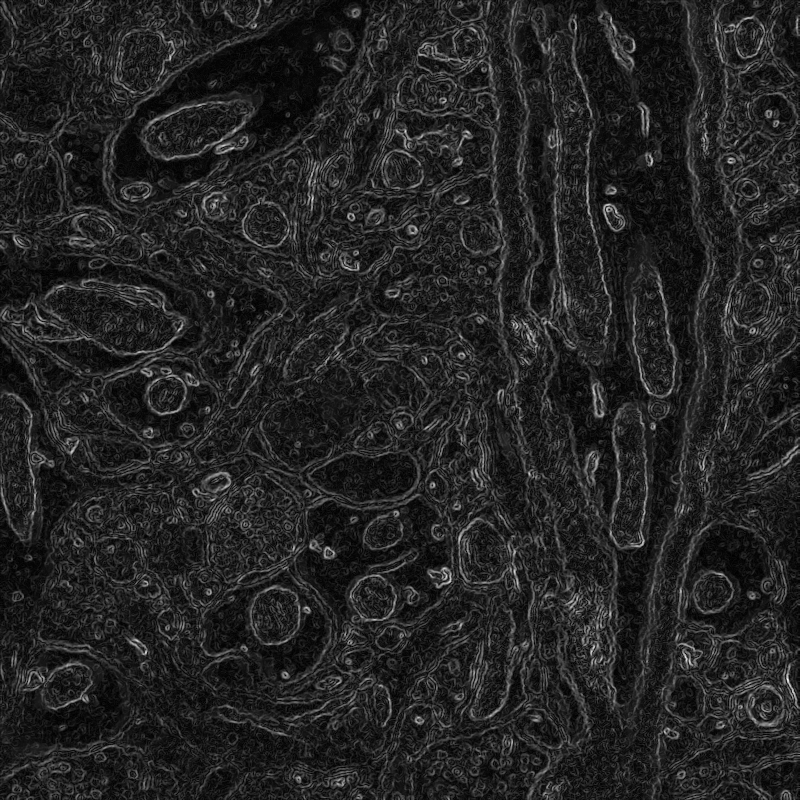
We also added the norm as a parameter and tested a modified Sobel operator with replaced by for various values. Finally, we added the ability to binarize the output of the 3D Sobel operator using mean and standard deviation-based thresholds.
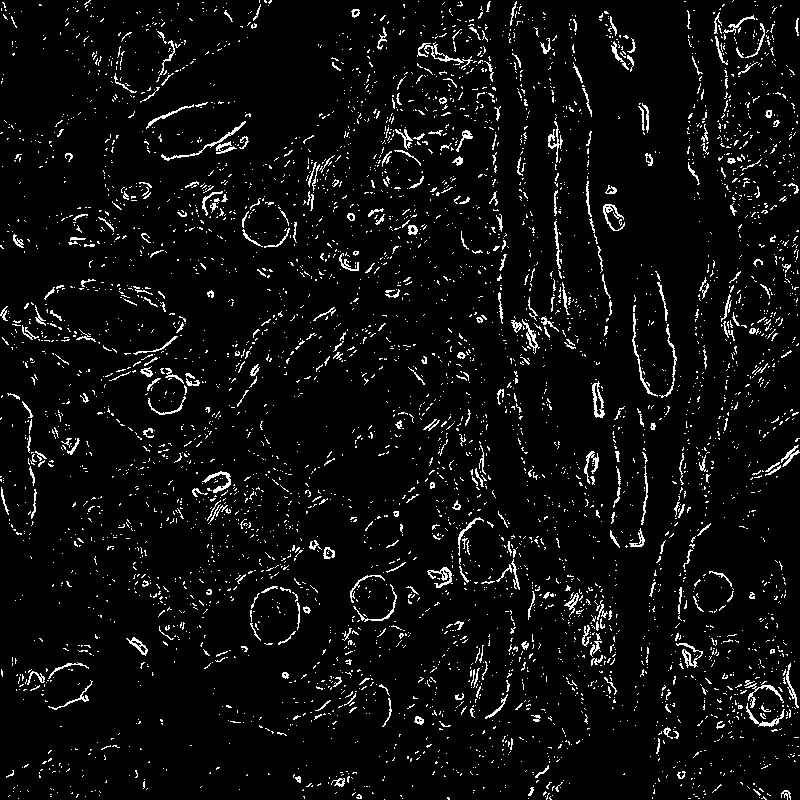
Notice clear remnants of closed curves, many with circular eccentricity. We are working on an algorithm to integrate around points on the closed curves and output a single stable center point. Our main goal is to detect and extract feature patches for registering regions of the connectome. We develop and energy function that can be optimized that outputs many of these center points. From these, a sparse graph can be constructed, and then further dense modeling of EM blocks and connectome regions. We will extract a feature vector based on cell regions, neurons, axons and synapses. We first build a graphical model based on statistically stable regions learned from experiments on large volumes of EM data.
The Ganita feature extraction module consists of two main C++ classes: Ganita3D and GanitaImage. GanitaImage handles reading, writing of images, videos and interfacing with external image and video libraries. Ganita3D implements tailored 3D feature extractors such as the 3D Sobel filter.
IV-B Graph analytic starter engine
We have developed a basic graph processing engine in C++. Our goal is to use this engine to further analyze EM data and integrate with existing probabilistic graphical frameworks. Currently, our plans are to integrate with libDAI which is a free and open source C++ library for Discrete Approximate Inference in graphical models.
To store a graph, several data structures are created. The goal is to avoid allocating locations in memory, since this may be very large. We create an array that stores the index of each vertex, and an array that stores the offset into the edge array for each vertex. Then all edges are packed into a single array of longs in numeric (vertex order, adjacency vertex order). Total number of memory allocations equals:
With each node and edge, a property can be stored. For image processing, the property may contain features from a region of the EM block data. As an example, the graph library can compute the dot product between two nodes (as the sum of common adjacent vertices). This can be computed combinatorically efficiently by scanning through the adjacent vertices in unison, while incrementing.
Note, a standard method for computing the dot product would be to store the edges in an adjacency matrix and compute the dot product of two binary vectors. We do not wish to allocate this much memory.
The Ganita Graph software is composed of the following C++ classes:
V Software Package Description
A new project was created in github that contains some of the source code used for this project. The project name under github is GanitaBrain. The software is structured as shown in Figure 5.
The software in PREP is used to prepare the EM data for analytic processing. This includes distributed download from the Open Connectome Project and conversion to various formats.
The directory FEAT contains the gradient feature extractor, including a 3-dimensional modified Sobel operator. Also, included in the same class is a binarization routine.
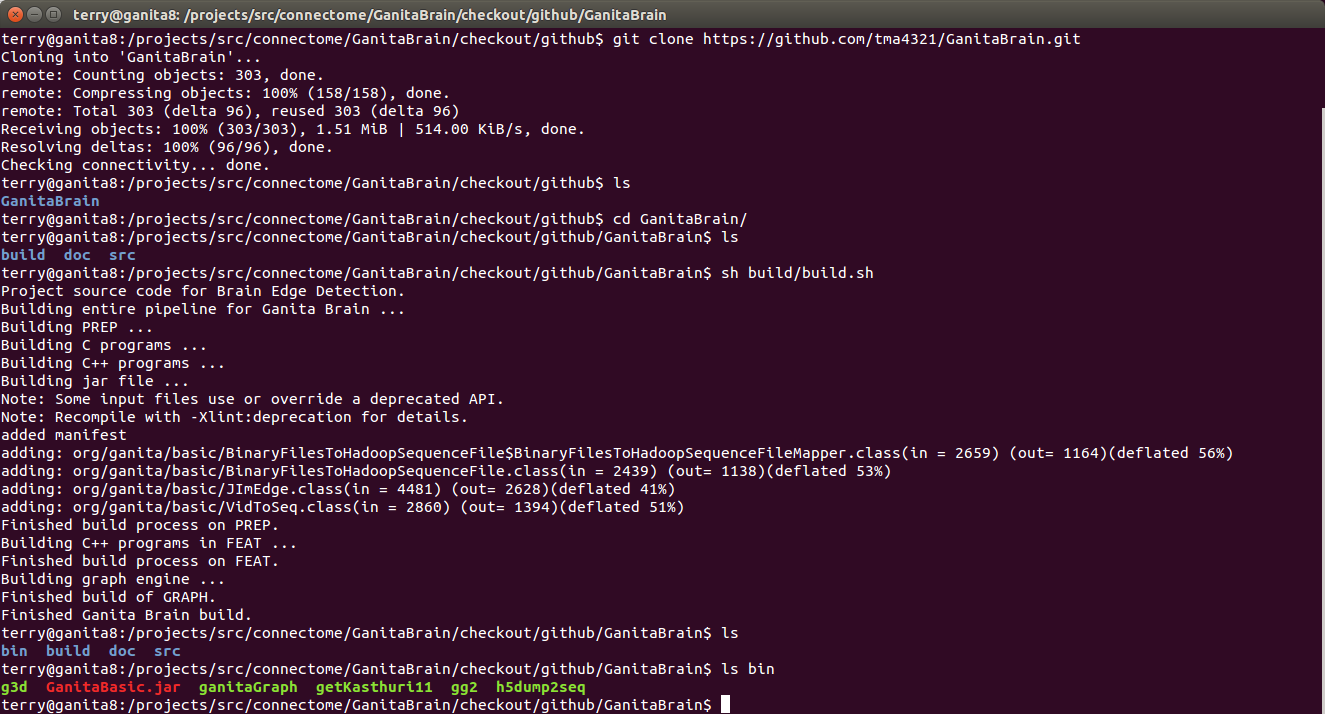
The root directory contains three subdirectories: build, doc and src. To build the software, a user must first install all dependencies. There is a actually a long list of dependencies, but the most important ones are: libcurl, h5dump, hdf5 libraries and executables, ffmpeg, opencv. The C++ software in FEAT and GRAPH can be built without installing most dependencies. To build executables and jar files, a user should change directory to the root directory and enter the command:
The following figure shows the download of GanitaBrain from github and the successful build process.
VI Experiment Results
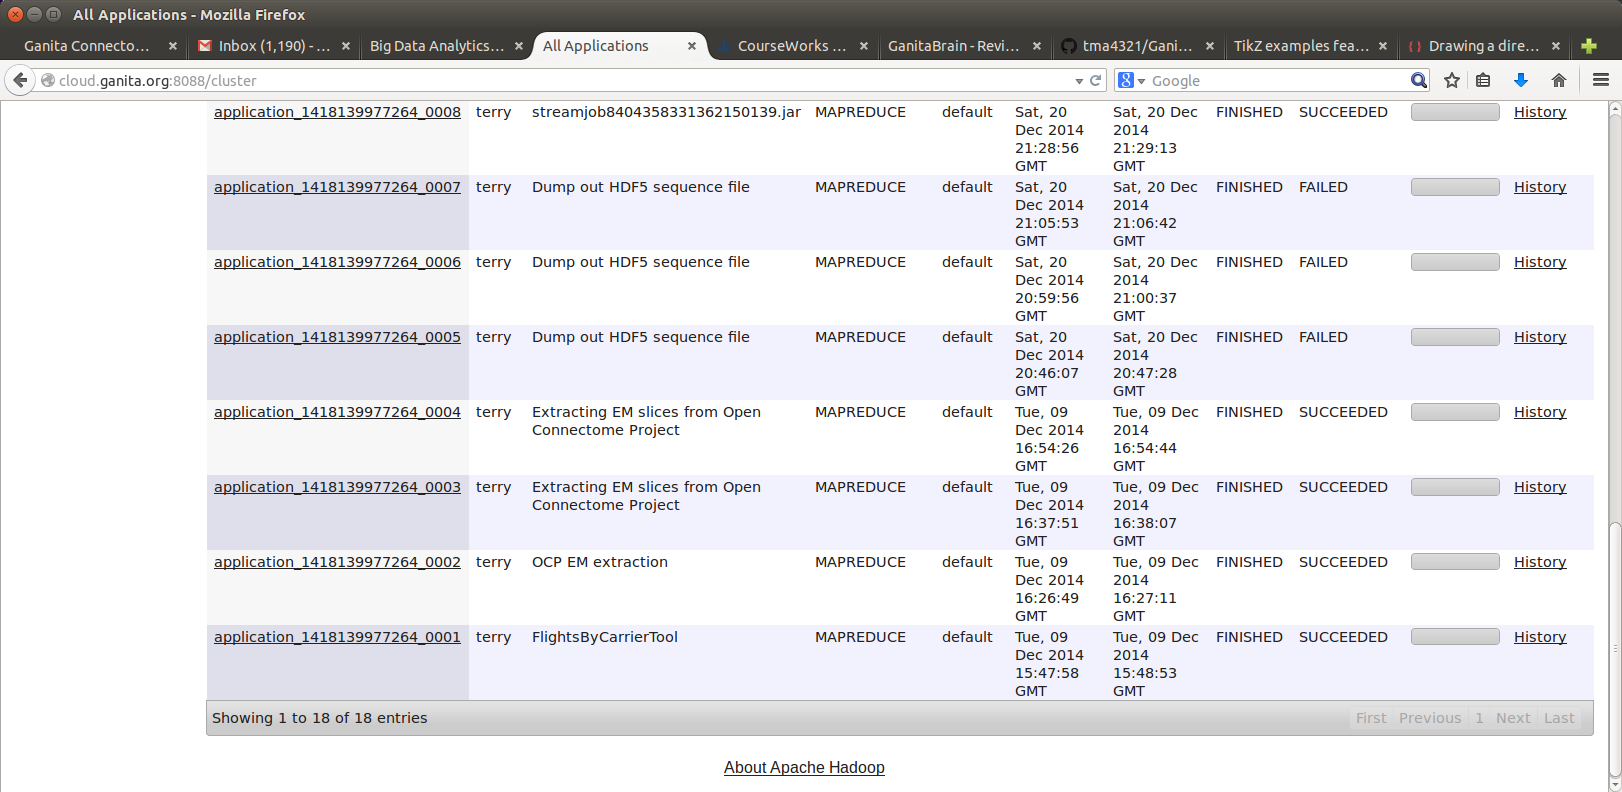
Several experiments were run using the software developed for this effort. Below is a screenshot from Cloud Ganita jobs that perform a distributed download, ingest and indexing of HDF5 imagery.
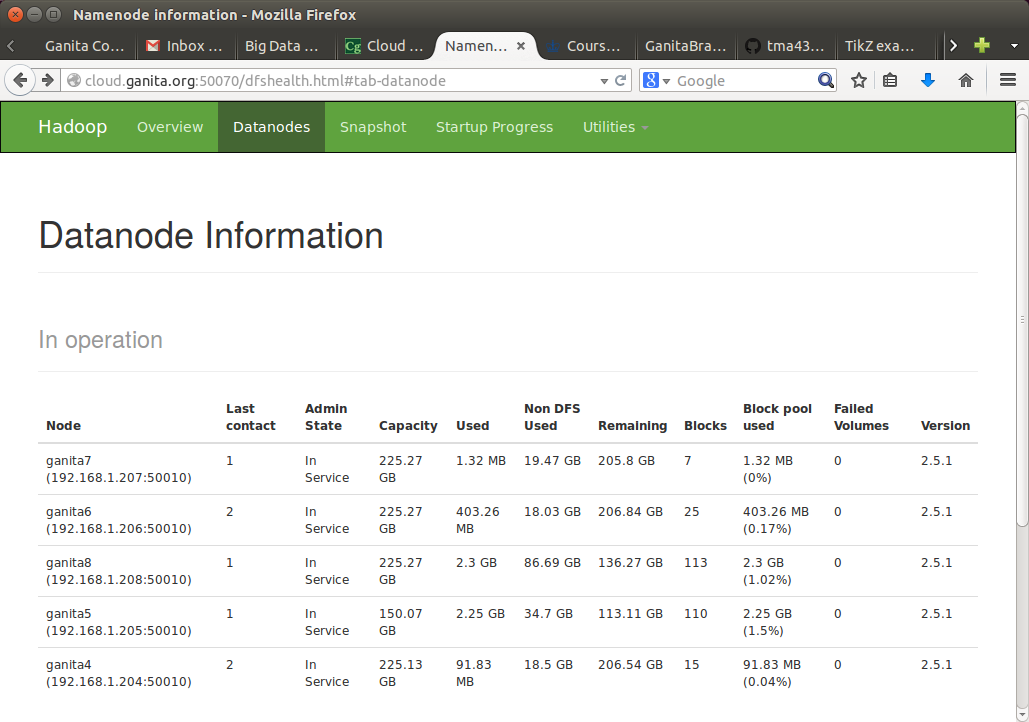
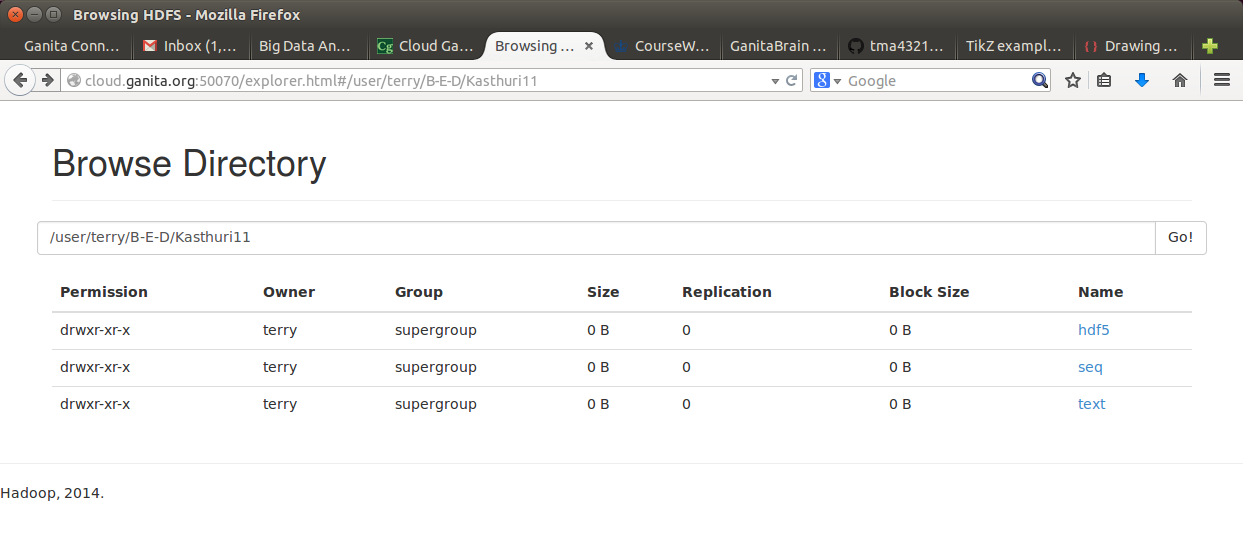
Below are screenshots of Cloud Ganita namenode and datanodes. Following that is a screenshot of the HDFS directory showing EM data stored in 3 different formats: HDF5, SequenceFile and uncompressed PGM text files.
At this time, we have various analytics running in Hadoop/HDFS. We have not yet collected ground-truthed data to test results from our query-by-example framework. This paper focuses on research to identify components for the big data framework, and development to deploy and integrate many of these components. Future research will focus on establishing a pipeline for processing data in an on-demand fashion and comparing results to ground-truth. An interesting task is identifying synapses in the Kasthuri11 dataset.
VII Conclusion
For future directions, this author plans to focus on application of 3D feature extraction, labeling and training of classification using deep learning framework (i.e. caffe), and application of probabilistic graphical models. Focus will be on environments well suited C/C++ algorithm development. Further utilization of Matlab will take place.
Acknowledgment
The author acknowledges assistance from several members of the Open Connectome Project, including Will Gray Roncal, Jacob Vogelstein and Mark Chevillet (Johns Hopkins University). The author did this research while a student in Columbia University’s Big Data Analytics course. The author thanks teacher, Ching-Yung Lin, for several insightful comments that will guide future research.
References
- [1] H. Kopka and P. W. Daly, A Guide to LaTeX, 3rd ed. Harlow, England: Addison-Wesley, 1999.
- [2] The Open Connectome Project, http://www.openconnectomeproject.org/.
- [3] Gray Roncal, Will, Private communication (2014).
- [4] Lin, Ching-Yung, Private communication (2014).
- [5] Burns et. al., The Open Connectome Project Data Cluster: Scalable Analysis and Vision for High-Throughput Neuroscience, http://arxiv.org/pdf/1306.3543v2.pdf, (2013).
- [6] Li, M., Fan, Z., Ji, H. and Shen, Z., Wavelet Frame Based Algorithm For 3D Reconstruction in Electron Microscopy, SIAM Journal on Scientific Computing, 36(1) (2014).
- [7] Bock, D.D. et al., Network anatomy and in vivo physiology of visual cortical neurons, Nature, 471 (2011).
- [8] Yamamoto, M. and Kaneko, K., Parallel image database processing with mapreduce and performance evaluation in pseudo distributed mode, International Journal of Electronic Commerce Studies, 3:2 (2012).
- [9] List of computer vision software, http://www.cs.cmu.edu/ cil/v-source.html (2005).