The Bolocam Galactic Plane Survey. XI.
Temperatures and Substructure of Galactic Clumps Based on 350 m Observations
Abstract
We present 107 maps of continuum emission at 350 m from Galactic molecular clumps. Observed sources were mainly selected from the Bolocam Galactic Plane Survey (BGPS) catalog, with 3 additional maps covering star forming regions in the outer Galaxy. The higher resolution of the SHARC-II images (8.5″ beam) compared with the 1.1 mm images from BGPS (33″ beam) allowed us to identify a large population of smaller substructures within the clumps. A catalog is presented for the 1386 sources extracted from the 350 m maps. The color temperature distribution of clumps based on the two wavelengths has a median of 13.3 K and mean of K, assuming an opacity law index of 1.7. For the structures with good determination of color temperatures, the mean ratio of gas temperature, determined from NH3 observations, to dust color temperature is and the median ratio is 0.76. About half the clumps have more than two substructures and 22 clumps have more than 10. The fraction of the mass in dense substructures seen at 350 m compared to the mass of their parental clump is 0.19, and the surface densities of these substructures are, on average, 2.2 times those seen in the clumps identified at 1.1 mm. For a well-characterized sample, 88 structures (31%) exceed a surface density of 0.2 g cm-2, and 18 (6%) exceed 1.0 g cm-2, thresholds for massive star formation suggested by theorists.
Subject headings:
star: formation submillimeter: ISM Galaxy: structure surveys catalogs dust, extinctionI. Introduction
Although high-mass stars play a key role in the structure and evolution of our Galaxy, there are still many questions that need to be answered before we have a paradigm for their formation process (Stahler et al., 2000; Bally & Zinnecker, 2005; Zinnecker & Yorke, 2007; Tan et al., 2014). Adopting the nomenclature of Williams et al. (2000), star clusters form in dense clumps ( M⊙, sizes pc) of giant molecular clouds while individual stars form in cores ( M⊙, sizes pc). An important step in the observational study of massive star formation is the identification and characterization of clumps and their resolution into cores. Studies of compact structures in our Galaxy will give fundamental “ground truth” for the analysis of nearby galaxies where individual clumps and cores cannot be resolved, and provide source information for observations of the Milky Way with a new generation of instruments, such as the Atacama Large Millimeter/Submillimeter Array.
There are complementary approaches to the study of massive star forming regions. We may consider obtaining molecular line observations, which are a good diagnostic of line-of-sight motions in a cloud, but variations in tracer abundances due to depletion and complex chemical processing, excitation conditions and the impacts of radiation fields and shocks add uncertainties (Evans, 1999). We may also proceed by mapping the continuum emission toward these sources. Newly formed stars heat the dust of their parental molecular cores and this dust emits in the far infrared and submillimeter wavelengths (Garay & Lizano, 1999). Continuum emission observations at (sub) millimeter wavelengths offer a reliable tracer of the column density and clump masses due to the low optical depth of the dust (e.g. Johnstone & Bally, 2006), and they have made an increasingly significant contribution to the understanding of star formation. Reddening and extinction of starlight provide also a measure of column densities (Bohlin et al., 1978), and mid-IR large scale surveys have identified dark patches obscuring the bright-background, which are associated with dense molecular gas (e.g., Egan et al., 1998; Simon et al., 2006). Studies of the physical properties of these regions, called Infrared Dark Clouds, suggest they are the birthplaces of high-mass stars and stellar clusters (e.g., Rathborne et al., 2006, 2010; Battersby et al., 2010). In addition, near infrared extended emission has also been considered a tracer of the column density of dense dark clouds, interpreted as scattered ambient starlight observed from the outer parts of dense cores (“cloudshine”, e.g. Foster & Goodman, 2006; Padoan et al., 2006).
Several studies have made progress toward the characterization of massive star forming regions, but they are usually biased because target selection required existing signposts of newly form high-mass stars, including maser emission, far infrared emission, or the presence of H II regions (Churchwell et al., 1990; Cesaroni et al., 1991; Plume et al., 1992). Therefore, the identification of clumps with a less biased survey will improve our understanding of the early stages of massive stars. Examples include large scale surveys of particular regions, such as the study of the W3 giant molecular cloud with Submillimetre Common-User Bolometer Array (SCUBA) by Moore et al. (2007) or the Cygnus-X molecular cloud complex region with MAMBO receiver by Motte et al. (2007). Large-scale blind surveys of the Galactic Plane at far-IR, submm and mm wavelengths have recently been completed. The ATLASGAL survey mapped the Southern part of the plane at 870 µm using the 12 m APEX telescope (Schuller et al., 2009; Contreras et al., 2013). Space borne missions, such as WISE (Wright et al., 2010) and Spitzer/GLIMPSE (Benjamin et al., 2003) and MIPSGAL (Carey et al., 2009), have mapped most of the Galactic plane at a resolution of a few to 10″, at wavelengths between 3.6 and 24 m. The Herschel/Hi-GAL survey (Molinari et al., 2010) covered the entire Galactic plane with resolution between 5″ and 36″, in five bands at 70, 160, 250, 350 and 500 m. In addition, the 15-m James Clerk Maxwell Telescope is using SCUBA-2 850 m and 450 m emission to map the Galactic plane and several nearby Gould Belt clouds. These surveys have provided a robust tracer of dust properties (column density and mean grain temperature), for different phases of the interstellar medium.
The Bolocam Galactic Plane Survey (BGPS; Aguirre et al., 2011) is one of the first ground-based surveys to map the continuum emission at 1.1 mm over a large region of the northern Galactic plane. The BGPS coverage region extended from to for , at a resolution of 30″, and it identified 8454 compact sources throughout the Galaxy (Rosolowsky et al., 2010). Depending on their distance, millimeter features may be cores, clumps, or clouds (McKee & Ostriker, 2007), although BGPS sources are mostly clumps (Dunham et al., 2011). An improved reduction and a new version (V2.0) of the BGPS maps and catalog was released (Ginsburg et al., 2013), including additional 20 square degree coverage area in the third and fourth quadrant, and 2 square degree in the 1st quadrant. This new reduction shows an improved flux calibration with respect to the former version (V1.0), in agreement with other data surveys on the Galaxy. The characterization of the angular transfer function of the Bolocam pipeline shows that the flux recovery is above 90% for scales between 33″ and 80″, with a steep drop for scales above 100″. While version 2.0 of the catalog contains 8559 sources, 35 sources were unintentionally excluded, and they were added in a new version (V2.1), for a total of 8594 sources. Figure 1 shows the distribution of 40″ aperture flux density of V2.1 sources. Although the basic statistical properties of the catalogs remains unaltered, there are some effects on the source extraction when considering the new map versions with improved quality. Comparing the source extraction in the V1.0 and V2.1 overlap region, V2.1 recovers fewer compact sources (8004), with only of those having a clear V1.0 match, and these are considered more reliable and stable identified sources (see Fig. 10 in Ginsburg et al., 2013). Fig. 11 and 12 in Ginsburg et al. (2013) show visual examples of the lost sources, which are generally small sources on the shoulders of bright ones that have now been included in the bright source in the catalog.
We selected a sample of sources from the BGPS catalog, initially from V1.0 and later from V2.1, towards the most crowded and brightest portions of the Galactic Plane including the Galactic Center, the Molecular Ring near ° and Cygnus-X, and used the Submillimeter High Angular Resolution Camera II (SHARC-II; Dowell et al., 2003) to obtain continuum maps at 350 m of them. The high resolution of the SHARC-II observations (FWHM beam size of 8.5″) is in particular very useful when we observe small structures at great distances in the Galaxy, and the comparison of flux densities of sources at 350 m and 1.1 mm will give us constraints on their dust temperatures, hence improving the determination of masses and column densities of the molecular clumps.
SHARC-II has been used before for studying low-mass dense cores from the Spitzer Legacy Program “From Molecular Cores to Planet-Formation Disks” (Wu et al., 2007, A. Suresh et al. in preparation), concluding that observations with this instrument are better to distinguish between starless and protostellar cores than observations at longer wavelengths. While Mueller et al. (2002) studied dense clumps selected for having massive star formation using SHARC at 350 m, there has not been a comprehensive study of BGPS-selected sources with SHARC-II. A recent study by Ragan et al. (2013) shows how ground-based observations at 350 m continuum emission of regions of high-mass and cluster formation can give information on substructures within them. For a set of 11 nearby Infrared-dark clouds (IRDCs), they obtained data on 350 m continuum emission with the SABOCA instrument at the APEX telescope, finding a large population of small core-like structures. Higher resolution observations at submm wavelengths allow the study of the complex process of massive star formation from fragmentation of molecular clumps to individual substructures, such as cold and hot cores.
We present a set of 107 continuum emission maps at 350 m obtained with SHARC-II. These include 104 maps of clump-like BGPS V2.1 sources, and 3 maps of outer Galaxy sources not included in the catalog. This paper is organized as follows. Section 2 describes the selection of targets from the BGPS catalog and the SHARC-II instrument. Section 3 describes the data reduction and calibration methods for our set of submm continuum maps. Section 4 presents the results of the extraction of sources in the images, including source recovery tests, a catalog of these sources, the procedure for association between sources in the 350 m maps and the 1.1 mm sources, and the comparison between SHARC-II and Herschel at 350 m. Section 5 describes the determination of color temperatures for BGPS sources found in our set of maps,comparing them with temperature determination from spectral energy distribution (SED) fitting from Hi-GAL and other continuum surveys. Correlations between our dust temperature estimations and high-density molecular tracers are also presented. In Section 6, we explore consequences from our results for mass and surface density estimations of millimeter sources. In Section 7, we present conclusions from our analysis..
II. Observations
Observations were taken in several runs between June 2006 and September 2012 at the Caltech Submillimeter Observatory (CSO111The Caltech Submillimeter Observatory was operated by the California Institute of Technology, until 2013 March 31 under cooperative agreement with the National Science Foundation (AST-0838261)). The observations required excellent weather conditions, with a measured optical depth at 225 GHz ranging between 0.030 and 0.094 (measured at zenith position), with an average value of , corresponding to an optical depth at 350 m (857 GHz) of . In general, we observed our targets when they were culminating, and we avoided observing sources below an elevation of 30° or above 80°.
II.1. Target selection
The targets were initially selected from sources in the BGPS V1.0 catalog. We chose sources with strong emission at 1.1 mm (typically with peak emission above 1 Jy beam-1) toward densely populated regions, many of them known as active star forming regions, such as the Galactic Center, , Cygnus-X region, W3 and W5 molecular clouds, GemOB1 region, and others. Several of those targets were extended and they were likely to have unresolved substructure at a resolution of 30″. Most of the time the observation fields were centered directly on a V1.0 source, but in some cases we tried to cover several sources in the same field. Starting in December 2009, we added to our list of targets bright sources selected from new Bolocam maps that were later incorporated in BGPS V2.0. Considering that almost all targets from V1.0 catalog are incorporated in V2.1 (Ginsburg et al., 2013), we consider the latest version of the catalog for our analysis. In just one of our maps, L136.52+1.24, there are three sources marginally detected in V1.0 but not included in subsequent V2.0 or V2.1 catalog versions. We also obtained 350 m maps of the outer Galaxy star forming regions SH2-209, SH2-307 and IRAS 03233+5833 (e.g., Klein et al., 2005; Richards et al., 2012), which were not covered by the BGPS survey. The maps of these regions are L151.610.24, L234.57+0.82, and L142.01+1.77, respectively. These observations are included for completeness, but they are not included in analysis that requires BGPS data.
For a better characterization of our targets with respect to the complete catalog, we consider the brightest V2.1 source in each map as the representative target for that map. In some cases, where adjacent maps share the brightest source, we consider the second brightest source as a representative target. From the 104 maps at 350 m with BGPS sources, we have then a sub-sample of V2.1 sources considered as representative targets. Figure 1 shows in red the distribution of flux density in 40″ apertures for our sample of 104 representative targets. The distribution has an average of 2.63 Jy and a median of 1.37 Jy, much higher than the values for the overall BGPS catalog. However, weaker sources were covered in the same fields, so the final flux density distribution of BGPS sources with 350 m data is closer to that of the full catalog (see black line in Figure 1). We found a total of 619 V2.1 sources in our sample of SHARC-II maps, with an average and median flux density of 0.79 Jy and 0.29 Jy, respectively, about twice the values for the complete V2.1 catalog (average of 0.35 Jy and median of 0.16 Jy for 40″ apertures).
II.2. Instrument and Observational Method
SHARC-II is a background-limited facility camera operating at 350 m or 450 m, located at the CSO on Mauna Kea, Hawaii. It consists of a 3212 array of doped silicon ‘pop-up’ bolometers and it has a mean beam size of at 350 m. The array has a full size of , which makes the instrument start to lose sensitivity to emission on scales larger than 1′. We used the box scan mode of SHARC-II without chopping222See http://www.submm.caltech.edu/sharc/ for mapping regions with sizes significantly larger than the size of the array. In the box scan mode, the scan pattern moves across the rectangular field of view, starting in the center of the array and going straight until the edge of the bounding box, where it changes trajectory emulating the bounce of a ball on a billiard table. The advantage of this scan mode is that it provides better isolation against 1/f noise, with more uniformly distributed noise across the field of view in comparison with the alternative sweep mode with Lissajous scan pattern. Different box sizes were used in our data acquisition, between 2.5′2.5′ and 18′18′, although the bulk of our observations were obtained with 10′10′ boxes. Column 3 in Table 2 shows the size for each map.
For all our observations we used the Dish Surface Optimization System (DSOS)333See http://www.cso.caltech.edu/dsos/DSOS_MLeong.html to correct the dish-surface figure for imperfections and gravitational deformations as the dish moves in elevation during observations.
III. Data reduction and calibration
III.1. Data reduction
The 350 m raw data were reduced using the Comprehensive Reduction Utility for SHARC-II (CRUSH; Kovács, 2006). CRUSH is a Java-based software which solves a series of iterative models, attempting to reproduce atmospheric and instrumental effects on the observations, removing the sky emission common to all bolometers at first order (e.g., Beelen et al., 2006). We used version 2.10 of CRUSH, publicly accessible from the CSO webpage.
Figure 2 shows an example of the error or noise maps that reduction with CRUSH produces for each observed region. In general, all SHARC-II maps are much noisier toward the edges by a factor of 4 with respect to the measured average noise of the image. At a distance of 20″ (twice the beam size) from the edge, the noise is only increased a factor of 2. Also, when taking multiple scans for a single map at different runs, the orientation of the field of view rotates, and the regions that do not overlap in the integration of the source show a significant increase in the noise. The rest of the map shows some residuals of the pattern used in the box scan mode, but in general the inner parts of these maps are well represented by uniform noise.
III.2. Calibration
The maps were reduced in instrumental units of V, and we estimated the flux conversion factors in order to measure the flux densities of the sources in units of Jy. On our analysis, we followed the same method used on SHARC-II maps by Wu et al. (2007), and on SCUBA maps by Shirley et al. (2000), based on aperture calibrations over a given angular size . Flux estimation obtained from aperture corrected photometry are less sensitive to uncertainties due to effects of sidelobes. The observed flux density for an aperture of diameter is , with the voltage measured at wavelength in an aperture of diameter . We used the fluxes from Mars, Uranus and Neptune to obtain the flux conversion factors for two different apertures, 20 and 40. We restricted our flux estimation to 40 considering the limited sensitivity of the instrument to large scale emission. The bulk of the compact structures identified on the maps have sizes below this limit.
To compare the 350 m data with the 1.1 mm images from BGPS survey, we also convolved the 350 m to match the FWHM beam from Bolocam. Therefore, we also estimated the flux conversion factor C for an aperture of 40″ using the images of the calibration sources convolved to a 33″ beam. The flux densities of sources and calibrators in instrumental units were measured using Starlink’s package.
In addition, we estimated the flux conversion factor for one beam, , which we used to express the peak flux of each source and the 1 rms of the maps in units Jy beam-1. is obtained from the integrated flux density of the calibrators in one beam and the peak pixel of the map in instrument units. We have then an average value for the conversion V to Jy pixel-1 = 32.23 Jy beam-1, for the beam size and pixel scale of the instrument. Therefore, the value of will depend of the number of pixels considered. From the maps, the average value of Jy beam-1 V-1, and then
| (1) | |||||
| (2) |
For the calibration of the images, only the observations of planets were considered. While the secondary calibrators mentioned in section IV.1 are useful to check the pointing when planets are not available, they are not as bright and their flux densities are not as well known as planets. Therefore, we avoided using them to minimize uncertainties in the estimation of calibration factors.
Table 6 in the Appendix section gives the observation dates (column 1), the planet observed (column 2), the observed opacity at 225 GHz at that date (column 3), the computed values of (column 4) and at different apertures (columns 5 and 6). Column 7 gives the calibration factor for an aperture of 40 obtained for the planet images convolved to a beam of 33. Table 1 shows the average values of for the different observation epochs. According to these results, the uncertainties in the calibration of the maps are between 15-20, consistent with previous observations and calibration estimations for the SHARC-II instrument (Wu et al., 2007).
While some sources may have significant contributions to the broad-band flux density from line emission, it is usually a small fraction of the dust continuum emission (e.g., Groesbeck 1995). The continuum flux measured with SHARC-II (780 - 910 GHz for the 350 m filter) could in principle be contaminated by the CO line. Hatchell & Dunham (2009) estimated a contribution less than 100 mJy beam-1 in the SHARC-II 350 m band for a CO integrated intensity of 100 K km s-1, which is smaller that the typical sensitivity found in our maps, and they considered that the CO line may contribute 20% of the continuum emission in the 350 m band. We adopted that limit in this work as a conservative value for possible line contamination.
IV. Results
IV.1. Map description
Figure 3 shows as an example the 350 m continuum map of L133.71+1.21, corresponding to the W3 Main region (see Rivera-Ingraham et al., 2013; Megeath et al., 2008, and references therein). Besides the two bright infrared sources IRS5 and IRS4 (Wynn-Williams et al., 1972), the small beam size of the 350 m maps allows us to identify several sources near them, and some elongated, filamentary-like structures and scattered faint sources. These types of features are found recurrently in the 350 m maps and we characterize their correspondence with 1.1 mm sources later in section IV.5.
We obtained a total sample of 107 maps, with an average noise of 744 mJy beam-1, and a standard deviation of 443 mJy beam-1. These maps are presented in Figure 25 in the Appendix. Because the noise increases at the edges of the images (see Section III.1), we estimated a more representative value of the mean rms of each map on a region toward the central area. In the 10′10′ maps, the considered area has a diameter of 7′. Column 7 in Table 2 shows the representative rms noise of each map. The average 1 noise value estimated this way is 478 mJy beam-1, with a median of 375 mJy beam-1 and a standard deviation of 298 mJy beam-1. Each map has an angular scale of 1.618 arc-seconds per pixel. Table 2 lists, for each map observed, the configuration used, the size and center of each map, the date on which the map was taken, and the 1 noise of the map in units of mJy beam-1. Integration time was obtained in blocks of 14 minutes. The pointing was checked on planets such as Mars, Uranus and Neptune, and with secondary objects when the planets were not available, such as IRAS 16293-2422, K350, G34.3, W75N and CRL 618. The blind pointing uncertainty varied between 1.8 and 2.1 for azimuth and between 0.8 and 1.6 for zenith angle.
IV.2. Source Extraction
To facilitate comparison with the BGPS sources, we used the same algorithm for source extraction as was used for the BGPS catalogs, Bolocat (Rosolowsky et al., 2010). Bolocat identifies sources based on their significance with respect to the local estimate of the noise in a map, subdividing regions with high significance into individual sources based on local maxima inside that region. Each pixel is assigned to an individual source using a seeded watershed, in a similar way to other source extraction algorithms (Clumpfind, Williams et al. 1994; SExtractor, Bertin & Arnouts 1996). The source identification process is determined by three parameters: , the amplitude of the signal compared to a local estimation of the noise (noise estimation as ); , the base level of emission at which the identified region is expanded; and the deblending parameter , used in decomposing regions of emission with multiple local maxima. First, Bolocat masks all data above of a particular image, and extends a region to include all connected regions of emission above =1 since areas with marginal significance adjacent to regions of emission are probably real. Second, each identified region is examined and subdivided according to the level of contrast between local maxima. For each pair of local maxima in a region, the amplitudes of emission, and , are compared with the highest contour of emission containing the local maxima pair, , and if any or is less than above , that local maximum is discarded as a subregion. Bolocat also avoids recovering sources (and sub-sources from the deblending process) with sizes less than the beam FWHM. A detailed description of the algorithm is presented in Rosolowsky et al. (2010). BGPS catalogs V1.0 and V2.1 used as parameters for the extraction of sources =2, =1 and =0.5, with the local noise estimation, as a function of Galactic coordinates, on the BGPS maps.
We tested Bolocat in the SHARC-II maps varying the , and parameters, checking which of them reproduce a “by eye” extraction of sources in those maps. Using the same parameters as BGPS, spurious low brightness sources were recovered across the maps, with several of them toward the noisy edges of the maps, and bright extended sources are sub-divided until the routine reaches small areas, comparable to the beam size of the maps. Better results were obtained considering =3, =1 and =1, and these values were used for all maps (inclusive those outside the BGPS coverage) and the following catalog of BPGS substructures at 350 m.
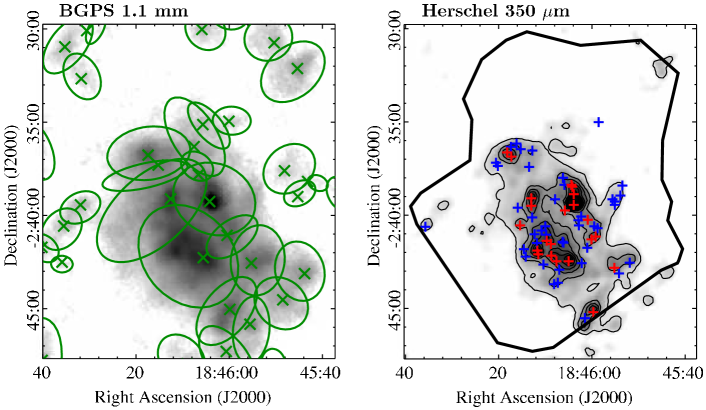
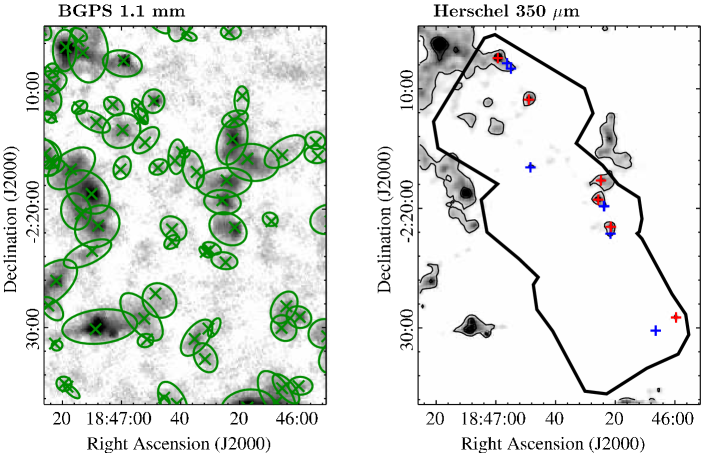
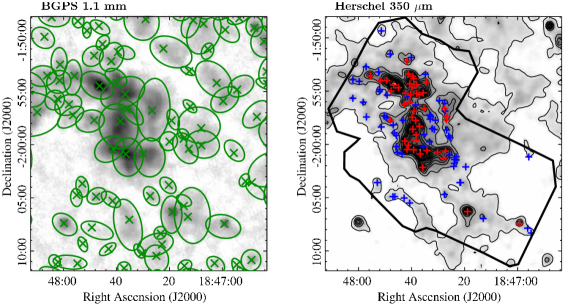
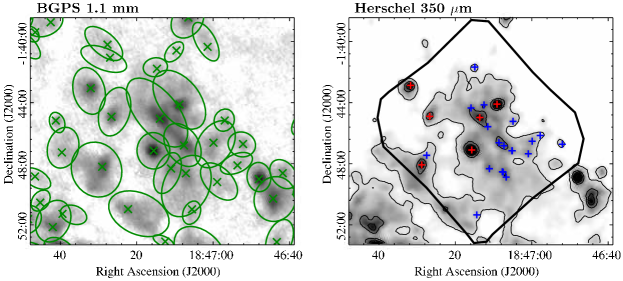
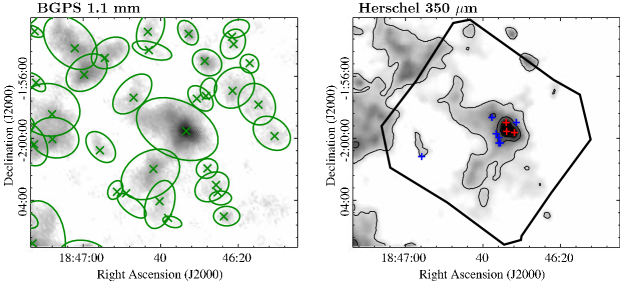
Figure 4 shows an example of one SHARC-II map and the corresponding image at 1.1 mm obtained from BGPS. The angular scales of SHARC-II and BGPS images are 1.6 arc-seconds per pixel and and 7.2 arc-seconds per pixel, respectively. The better angular resolution of SHARC-II reveals substructures within the clumps identified by the BGPS catalogue. Crowded fields and extended clumps identified at 1.1 mm show small components and filaments when they are observed at 8.5 resolution.
IV.3. Source recovery experiments
We performed similar tests to the ones done for BGPS to assess catalog properties compared with the real distribution of emission on the sky. For these tests, we inserted sources in selected maps that do not have detected sources, or that have just a couple of compact identified sources. The selected maps are those of L030.15+0.00 (2 identified sources), L078.920.19 (0), L079.62+0.49 (0), L079.110.35 (1), L080.86+0.38 (2), L111.260.77 (2), L111.79+0.71 (0), L136.52+1.24 (2), and L137.69+1.46 (0). The median rms noise of these maps is 667 mJy beam-1, larger than 83 of the estimated noise in the whole set of maps. This set of maps will be considered as a conservative representation of an emission free SHARC-II map. For those maps that already have identified sources, we flagged the detection of those sources and any input sources near them, and therefore the recovered properties of input sources will not be affected by the emission prior to the test. After the artificial Gaussian objects were added, the maps were reduced in the same standard way as the rest of the SHARC-II maps. Although Gaussian brightness profiles do not quite represent all structures observed in the 350 m maps, they are still good models of compact sources. Thus, the bulk of sources will be well represented in these tests.
We examined the degree of completeness of the catalog of substructures at different flux density limits. For the nine test maps, we input sources with FWHM of 9″ and amplitudes uniformly ranging between 0.1 and 15, with the noise of each map. For mJy beam-1, this range correspond to sources with flux densities between 0.19 Jy to 28.5 Jy. Taking into account that the edges of the maps have a larger noise than the central area of the map with uniform noise, we consider the detection fraction of sources across the whole map, and sources inside a central area of 7′ in diameter. Figure 5 shows the results of the test of completeness. The vertical lines represent 1 to 6 times the average value of the complete set of SHARC-II maps. For sources inside the central area of the map, the detection is 99% complete at the 6 level. For sources with amplitude less than 3, the detection fraction is less than . For the rest of our test, we only considered sources inside a central area of radius 3.5′ to avoid noisy edge effects.
The next test we performed was examining the properties recovered by the extracting algorithm for a distribution of input sources. We compared input and extracted flux densities for objects with FWHM equal to 23″ (2.7 times the beam size of the 350 m maps). Initially, we tested the flux recovery of artificial sources on apertures of 20″ and 40″, and the total integrated flux, in units of V. The integrated flux is estimated from the area of significant emission defined by the watershed extraction. At an aperture smaller than the source size, we only recovered part of the total intensity as expected, and the flux recovery at a larger aperture as 40″ is almost equivalent to the integrated flux. All the sources extracted in our catalog have a recovered flux density less than 3000 V ( Jy). Figure 6 shows results of this flux recovery test. For the integrated emission, calibration was done using the Cbeam conversion factor, and flux recovery at 20″ and 40″ was calibrated using C20 and C40, respectively. The image indicates that the 40″ aperture flux density could be underestimating the amount of flux recovered for input sources, with a difference with respect to the curve of the integrated flux of %. That difference between integrated and aperture flux density recovery gets bigger for input sources with larger size. For example, for input sources with FWHM equal to 4 times the beam size (30″), the difference between a 40″ aperture and the integrated flux is around 35%.
The size recovered with Bolocat for input sources with a peak signal of 50 is shown in Figure 7. The sizes of small sources are well recovered by the algorithm, but they become underestimated for sources larger than ″. These results are similar to those found in the BGPS maps, where the radii of recovered sources become underestimated for radii ″. The largest source that we found in the 350 m maps has a size of 48″, with a major-axis of 65″.
Finally, we inspected how the algorithm decomposes sources into individual substructures. We tested how blended sources are identified as a single or as a couple of individual objects, considering pairs of input objects in the set of test maps. Each source of the pair of input fake sources have sizes between 14″ and 34″, and peak flux density of 50. Figure 8 shows the fraction of blended sources as a function of the separation between pairs of input sources. In general, sources at a distance less than the beam FWHM cannot be recovered individually and they are assigned to the same source in the recovered catalog, and more than 50% of the pairs of input sources are recovered individually at distances larger than 20″ (2.4 times the beam size). Figure 8 also shows that pairs of input sources with sizes less than 24″ are better resolved at shorter distance than pairs with larger sizes than that. Pairs of sources are resolved more than 50% at separations of 16″ for small input sources, and at 25″ for larger sources.
IV.4. Catalog of sources in the 350 m maps
We have recovered from the Bolocat extraction 1386 sources in the 350 m maps. We name our sources in a similar way as described in the BGPS catalog, using the peak position of the source in galactic coordinates: SHARC_G. An additional digit with respect to the BGPS catalog was required to account for the better resolution and smaller pixel size in the SHARC-II maps. Table 3 presents the properties recovered for the extracted sources. The positions of the recovered sources in the SHARC-II maps are shown in Figure 25 in the Appendix.
Figure 9 shows the distribution of recovered flux for these sources using three methods from our catalog: photometry in 20″ and 40″ apertures, and the integrated flux. For the 20″ aperture, the average and median value of the flux density are 23.151.59 Jy and 8.95 Jy, respectively. For the 40″ aperture, the average and median values are 45.112.82 Jy and 16.63 Jy, resp. For the integrated flux density, the average and median values are 59.595.19 Jy and 12.06 Jy, resp.
Figure 10 shows the deconvolved radii and the aspect ratio distribution. The deconvolved radius distribution extends to 46″, and the catalog has 257 sources (% of the total) with radii not resolved. These small sources are usually faint, with an average value of their peak signal-to-noise ratio of 4.4. The average and median of the radius distribution are 15.0″ and 14.0″, respectively. The aspect ratio is defined as , and its average and median values are 1.53 and 1.45, respectively. A similar median aspect ratio is found in the BGPS V2.1 catalog, and this could be a common feature of millimeter and submillimeter sources, or an artifact of the extraction algorithm.
IV.5. Correlation with BGPS sources
We performed a spatial position matching analysis to get a correlation between sources found in the 350 m maps and the BGPS V2.1 sources contained in them. Therefore, we excluded from this analysis the 3 maps of outer Galaxy regions outside the coverage area of BGPS. A simple criterion to match sources from catalogs at different resolutions is to take the position of maximum intensity for sources of one catalog, and find which sources in the second catalog are 1 beam distant from that position. For example, Contreras et al. (2013) performed this kind of matching between sources of the ATLASGAL survey (870 m, 19.2″ FWHM beam size) and BGPS V1.0 sources, considering that sources between these catalogs are associated if their peak positions are less than 40″ in angular distance, finding around 3000 likely matches. One of the issues with this approach is that it does not yield a one-to-one association. This has special importance in catalogs based on sources extracted from maps at different resolutions. Even more, Ginsburg et al. (2013) found that for the same 1.1 mm data at 33″ FWHM beam resolution, re-processed V2.1 maps with better spatial filtering recover in some cases more than the one source that previous V1.0 maps found, and in others V2.1 maps recover a single structure where V1.0 recovered many. Then, sources required more than simple matching at beam distance to compare different versions of the catalog.
Considering the different beam size of the 350 m maps (8.5″) and 1.1 mm maps (33″), we expect to resolve extended millimeter sources in some cases into multiple smaller components, and we put the constraint that compact sources identified in the 350 m maps must be associated with a single 1.1 mm source. For the following analysis, we will consider as a “parental clump” a 1.1 mm source from the BGPS catalog harboring one or more associated matched structures on the 350 m maps, which we will refer to as “high-resolution sources” or just simply as “substructures”.
We made use of one of the sub-products of the Bolocat algorithm, the mask produced for each map in the identification of individual significant emission. These labelmask maps give information on which particular position in a map contains emission, and associates that position with a single source from the catalog produced for that map. Our approach was taking the position of maximum intensity from the 350 m sources, and if that peak is within the labelmask of a BGPS V2.1 source, it is considered associated.
For the sample of 104 SHARC-II maps containing BGPS sources, there are 1374 high-resolution sources. Only 24 (2%) of those sources have their peak position not associated to a BGPS V2.1 source from the labelmask maps. The association between 350 m high resolution sources and 1.1 mm sources suffers from intrinsic, noise driven uncertainty in the peak flux density position, and the algorithm uncertainties in the labelmask area assigned to a specific source. We improved the matching of sources considering also the labelmask maps of the 350 m emission, overlapping both masks and estimating how much of the substructure mask area is associated with the parental source in the BGPS labelmask area. Two of the 24 sources have most of their mask area associated with a parental source and therefore are re-considered as matched sources. For the sample 350 m sources with a match, there are 17 sources with their mask area shared between two parent sources, and for them we made a visual inspection to see the most likely correct parental association. Figure 11 shows a couple of examples for association between 350 m and 1.1 mm labelmask regions.
We obtained a total of 1352 high-resolution sources associated with 349 different parental sources. The results of the previously described spatial matching of 350 m SHARC-II and 1.1 mm BGPS sources are shown in Figure 12. Half of the parental clumps have only one or two associated high-resolution sources, but toward several of the parental clumps we found a large multiplicity of sources, indicating possible fragmentation. The clumps with the largest multiplicity are BGPSv2_G213.705-12.603 (34 substructures), BGPSv2_G034.256+00.154 (27), BGPSv2_G133.716+01.220 (25), BGPSv2_G000.014-00.017 (23), BGPSv2_G029.916-00.045 (22), BGPSv2_G081.477+00.020 (20), and BGPSv2_G029.958-00.017 (19). There are 22 parental millimeter sources with more than 10 substructures, containing a total of 350 high-resolution sources (26% of the total).
These parental sources show some clear strong compact sources in them, but also some elongated, filamentary structures are present. We explored whether the large number of substructures in parental sources is due to spurious low brightness sources, and/or algorithm fragmentation of large sources. We consider the peak signal-to-noise ratio identified for each source by Bolocat, and compare the number of identified sources under different ranges of this ratio. Table 4 presents the number of substructures with amplitude (described in section IV.2) above 6, 10 and 20 for the 22 BGPS sources with large multiplicity. For these, 66% of 350 m sources have of 6, 42% of 10, and 19% of 20. Figure 11 shows two examples of the distribution at different peak signal-to-noise levels for two of these parental sources. While compact, strong sources have above 10, detections below this limit recover not only isolated low emission objects, but also filament-like features in chains of sources, and weak detections produced in the decomposition process of the algorithm. We conclude then that sources with above 10 (“compact substructure”) are more related with possible dense core-like structures in the interior of millimeter clumps, and sources below this limit (“faint substructure”) trace a more diffuse medium in addition to weak sources. For the total number of high-resolution sources recovered from the SHARC-II maps, only 437 (32%) are considered compact substructures. Column 14 in Table 3 indicates if a source recovered in the 350 m maps is “compact” or “faint”.
IV.6. Flux densities of BGPS sources at 350 m
We determined the flux densities at 350 m of BGPS V2.1 sources by measuring the flux density in an aperture of 40″ on our sample of SHARC-II maps. To match the 33″ FWHM effective BGPS beam at 1.1 mm, the 350 m images, (1.618″ per pixel) were convolved with gaussian kernels (using IRAF task GAUSS) having = 13.5″ (8.33 pixels), i.e., convolving with a gaussian FWHM″.
From the total of 619 BGPS V2.1 sources in the 350 m maps, there are 82 sources that appear in more than one map; we preferred the flux determination from the maps where those sources suffer fewer sampling artifacts, such as high noise due to map edge proximity, or negative bowls around the source. In case there are not evident problems in the source flux estimation, we just considered the averaged result of the flux density. In addition, there are 45 BGPS sources with negative integrated fluxes on the 350 m maps due to proximity to noisy edges or negative bowls surrounding areas of strong emission, and therefore these sources are not considered as reliable measurements.
Results of the estimated values of 350 m continuum emission from BGPS sources are presented in Table 5. Column 1 gives the name of the source in the V2.1 catalog. Column 2 gives the flux density integrated in an aperture of 40 centered on the peak position of the 1.1 mm source. The values of the flux density are corrected by the factor 1.46 suggested by Aguirre et al. (2011) for the 40″ aperture flux obtained in BGPS catalog. Column 3 gives the integrated flux density for aperture photometry in the same previous position, but this time in the 350 m convolved maps.
IV.7. Comparison between SHARC-II and Herschel images
From Molinari et al. (2010), we used the Hi-GAL images at 350 m obtained during science demonstration phase centered toward °, ° and compared the results of flux recovery between the Herschel/SPIRE image and the 10 SHARC-II maps contained in that area. The Herschel image has a FWHM beam resolution of 24.9″, and details in the reduction process are found in detail in Traficante et al. (2011). Figure 26 in the Appendix shows 1.1 mm BGPS images, and their corresponding Hi-GAL images at 350 m toward °, °, for regions mapped with SHARC-II. While the 1.1 mm images in this figure show the position of the sources from the BGPS V2.1 catalog, the 350 m images show in blue () or red () the objects identified in our high-resolution source catalog. There are 213 of these substructures found, with only one left out of the following analysis due to noisy edge effects.
First, we compared the flux obtained on the sources recovered directly by Bolocat in this set of SHARC-II images, with emission measured in the Herschel map. Upper panel of Figure 13 shows the ratio between the density flux at 40″ aperture and the recovered flux at the same aperture, centered on the peak position of the high-resolution sources, obtained from the Herschel image, . For faint substructures, the flux ratio is in general below 0.3, with a cut around Jy, which suggests that the Herschel image is recovering additional flux from diffuse, large scale emission that SHARC-II maps do not recover.
Uniform background emission ranging between 2700 - 3300 MJy sr-1 in the Herschel image would give a flux density into a 40″ aperture of 80 - 100 Jy. Figure 14 shows one of the SHARC-II maps toward °, L029.95-0.05, and the Herschel emission in the same region. This figure also presents the SHARC-II map convolved to a resolution of 24.9″, to match the beam size of Hi-GAL data at the same wavelength. The emission level at 17 in the Herschel data corresponds to 2790 MJy sr-1, and the morphology of emission recovered above that contour level in the Herschel map is similar to the structures detected above 3 level in the SHARC-II images. A “background emission” level for the Herschel maps would lie at about 2460 MJy sr-1, corresponding to the 15 level (white contour in Fig. 14), and a 40″ aperture integrated flux density of 73 Jy. The beam-matched SHARC-II image shows that the 1 emission level has a good resemblance with that background emission level.
Inspecting Figure 26, most of the faint substructures do not look like well-defined entities at a 10 contour, but instead they seem to be immersed in background extended emission. For the compact substructures recovered in the SHARC-II maps, the average and median values for the flux ratio are 0.560.03 and 0.53, respectively. For those high-emission compact sources with peak signal-to-noise above 50, represented by green points in Figure 13, flux recovery in the SHARC-II maps and the Herschel map are nearly the same (average flux ratio of 1.000.11).
We performed a similar analysis for the 102 BGPS sources found in this region. We first convolved the 350 m Herschel image to match the 33″ resolution of Bolocam, and compare later the 40″ aperture flux emission obtained toward the peak position of BGPS sources. Results are shown in bottom panel of Figure 13. Errors in the flux ratio consider conservative uncertainties of 20% in the flux from the Herschel image, and 30% in fluxes from SHARC-II data. Sources without any substructure associated have low mm emission and flux ratio on average lower than 0.1. For those 1.1 mm parental clumps associated with compact substructures (shown in red in the figure), the average and median values of the flux ratio are 0.760.08 and 0.69, respectively.
We emphasize that the differences arise from the better angular resolution of SHARC-II compared to Herschel/SPIRE data, and not properly to the background subtraction; SHARC-II images are able to better disentangle the very dense and inner parts of clumps from the surrounding diffuse emission.
V. Analysis
V.1. Temperature determination
The data at 350 m and 1.1 mm can be used to define a color temperature. We will refer to this quantity through this analysis as the “dust temperature”, although variations in temperature across and along the line of sight make this color temperature only a rough guide to the actual dust temperatures.
The observed intensity of continuum emission is given by , where is the beam solid angle (33″ beam) for both the 1.1 mm data and the convolved, beam matched, 350 m observations, is the optical depth of the emitting dust at each frequency and is the Planck function at the dust temperature . The optical depth in the submm to mm regime is considered proportional to . In the optically thin limit, the temperature can be estimated according to:
| (3) |
and are the integrated flux densities obtained in 40″ apertures in the convolved SHARC-II maps and in the BGPS maps, respectively. The distribution of the ratio for the 574 V2.1 sources with reliable flux values is shown in Figure 15. The ratio distribution has a maximum of 181.0, with a median value of 19.7.
Equation 3 cannot be solved analytically for . The adjustment of the pair of parameters and has been a recurrent issue in the study of the interstellar medium and star formation. Frequently, a value of 2 in the millimeter to submillimeter regime is assumed, referring to studies of dust grains composed by graphite and silicate (Draine & Lee, 1984), but models with variations of ice mantles due to coagulation give lower values (e.g., Ossenkopf & Henning, 1994, estimated for their OH5 model). Values near 1 may be appropriate for circumstellar disks (e.g., Beckwith & Sargent, 1991). Shirley et al. (2005) summarize different opacity models in the submillimeter-millimeter regime for low-mass pre-protostellar cores, with values of between 1.3 and 2.3. For the present analysis, we obtained dust temperatures considering three different values of : 1.0, 1.7, and 2.0. Nevertheless, considering that most BGPS sources properties are related with dust clumps of dense material, should be the closest model of the true nature of these structures. Figure 16 shows the fitted values for temperatures as a function of the ratio / for the three models previously described. For , uncertainties in the determination of temperatures are shown in the figure, considering an error of the flux ratio of 10%.
The large uncertainty for high temperatures is unavoidable with these data. At high temperatures ( K, see below), both 1.1 mm and 350 m flux densities approach the Rayleigh-Jeans limit, and therefore the ratio becomes nearly constant, increasing significantly the uncertainty in the determination of .
The computed temperatures using three different values of are presented in Table 5. Columns 4 and 5 gives the source color temperature determined from equation 3, using a emissivity index , and the upper and lower limit for that temperature. Values of temperatures and upper and lower limits for a spectral index of and are given in Columns 6-7 and 8-9, respectively.
From equation 3, sources with flux ratio / below 70.2 have temperatures lower than 1000 K for . Only 32 V2.1 sources ( of sample) have estimated temperatures above 1000 K, most of them (24) found toward the Galactic Center region. In only one source, the large flux ratio is the consequence of low emission at 1.1 mm and comparable noise level, and almost half of the rest have Jy, which included well-known regions such as G034.256+00.154, G029.958-00.017, G030.702-00.067, and the “Brick” IRDC (Longmore et al., 2012). These very high temperatures reflect flux density ratios near those expected in the Rayleigh-Jeans limit, and the temperatures are not constrained by our data. A centrally heated region will produce strong 350 m emission; using a ratio with the 1.1 mm emission, which traces a larger region of cold dust, can produce an artificially high color temperature.
At a limiting temperature of 50 K, the corresponding flux ratio is 52.7 for , and a variation of 10% of this ratio will give an increase of 40% in the estimated temperature. Therefore, to avoid large uncertainties we consider as a “good fit” a determined temperature less or equal than 50 K, and a similar limiting temperature value is found for and . There are 512 sources in our sample below this limit for , and 30 sources with temperatures between 50 and 290 K with quite large uncertainties.
Figure 17 shows the temperature distribution for the 512 sources, assuming , with good fits for temperature. The median value is 13.3 K, with an average of 16.30.4 K. The difference between the median and the average is explained by the positive skewness of the distribution. The figure also shows the distribution of sources with different models for the spectral index. Considering a value of , the sample of V2.1 sources tends to have larger values of temperature, and then the number of these sources with K is 322, with a median value of 17.3 K and an average of 19.60.5 K. For , the distribution of fitted temperatures has lower values, with 543 sources below 50 K, and with median and average temperatures of 11.2 K and 13.30.3 K, respectively.
Figure 18 plots temperature versus flux density at 1.1 mm for a fixed value . For faint mm sources, uncertainties in the flux dominate the uncertainties in the temperature. In contrast, temperatures above 30-40 K are uncertain because of the weak constraints as the Rayleigh-Jeans limit is approached. The figure also shows the presence of 8 sources with high flux density ( Jy at 1 mm) and low estimated temperatures ( K). These are BGPSv2_G359.946-00.045 on the Galactic center region, BGPSv2_G075.834+00.400 and BGPSv2_G076.384-00.622 on Cygnus-X, BGPSv2_G133.716+01.220 on W3 main, BGPSv2_G031.411+00.307, and the sources BGPSv2_G206.557-16.361 and BGPSv2_G206.534-16.356 on NGC 2024, toward the Orion B South molecular cloud. In the case of BGPSv2_G133.716+01.220, corresponding to W3 East, Rivera-Ingraham et al. (2013) recovered a higher temperature ( K for ) for this source using Herschel data from the HOBYS program (Motte et al., 2010), difference that is explained in part for the underestimation of the flux at 350 m due to a shift on the peak of the BGPS source (and therefore the integration aperture), and the peak of the source on the SHARC-II map. In fact, there is a better agreement on the sources W3 West (BGPSv2_G133.698+01.216; K, ) and W3 SE (BGPSv2_G133.747+01.198; K, ), and the values estimated by Rivera-Ingraham et al. for these clumps (25 K and 21 K, respectively).
In the case of the clump associated to the G31.41+0.31 hot core (Cesaroni et al., 1994), an isothermal temperature of K was estimated for this source by Mueller et al. (2002) from continuum data modeling, which could indicate that the low temperature is the result of unreliability on the measurement of derived fluxes.
For the two clumps on the Orion B cloud, Johnstone et al. (2006) considered for both sources a temperature of 50 K, though they were unable to obtain color temperatures for them from SCUBA 450 m and 850 m continuum data due to high flux ratios, inconsistent with modified blackbody emission.
There are other 22 sources with Jy and K. These sources could be dense, prestellar clumps, but further observations and analysis, particularly in molecular line observations of high-density tracers, are necessary to test their nature.
V.2. Comparison of temperatures with other surveys
We found in general a good agreement between our determination of temperatures and estimations of temperature from other surveys of high-mass star forming regions. In this section, we describe details of these comparisons.
Faúndez et al. (2004) performed an analysis of physical properties of 146 continuum emission structures detected at 1.2 mm with SIMBA toward IRAS sources associated with CS(21) detections. The temperature and spectral index of these sources were obtained from SED fitting using additional IRAS four band fluxes, obtaining values for ranging between 1.5 and 2.5, with average temperature for their sample of 32 K. Temperatures found for their millimeter structures are larger than ours because their sample was biased toward IRAS sources that are intrinsically warm. Their sample has strong emission at 1.2 mm, with all their sources (except one) above 1 Jy and with an average flux density of 16.33.2 Jy. Considering the emission at 1.1 mm from our sources that are, within uncertainties and corrections, comparable with their sample, the average temperature for the 124 V2.1 sources with 40″ aperture flux at 1.1 mm above 1 Jy is 38 K for . Similarly, Mueller et al. (2002) modeled SEDs of a group of 51 massive star forming clumps, originally selected by having water masers, and found that a temperature of K best characterized the sources. Cross-matching their sample with BGPS sources inside SHARC-II maps, considering one beam (33″) in distance associations between samples, we found 13 BGPS clumps with good determination of dust temperature associated with the sources in Mueller et al. (2002). These sources have average and median values for their 40″ aperture integrated flux of 8.5 Jy and 7 Jy, respectively, with only one source with integrated flux below 1 Jy. One of these sources corresponds to BGPSv2_G031.411+00.307, for which its fitted dust temperature is considered underestimated (see Section V.1). Excluding this source, the fitted dust temperatures of the rest of the clumps have an average of 27 K, and a median of 29 K. Thus, the parameters that we found in sources with strong (1 Jy) integrated emission at 1.1 mm are similar to those found with SED fitting, giving some confidence to our values based on only two wavelengths. In addition, BGPS clumps associated with massive star forming regions generally have strong emission at mm and submm wavelengths, with warm temperatures 30 K, lying above 89% of the distribution of fitted temperatures of BGPS sources with T50 K.
Battersby et al. (2011) used Hi-GAL 70 to 500 m data to identify significant dust continuum emission in two 2°2° regions centered at ° and °, and obtained temperature and column density maps for them by fitting spectral energy distributions for each pixel. While the temperature is a free parameter for their fitting model, the spectral index is fixed to 1.75 following Ossenkopf & Henning (1994). From our sample, we have 91 BGPS V2.1 sources with determined temperatures in the ° map, and none in the ° map. Considering the fitted temperature obtained from equation 3, the median and average temperature for those sources from our analysis is 18 K and 344 K for . We estimated a value of the temperature of these sources from the maps presented by Battersby et al., , averaging the temperature values of each pixel on an aperture of 40″ centered on the peak position of each source. Figure 19 shows the ratio / as a function of the flux density at 1.1 mm for the sample of BGPS sources. The average ratio from this figure, without considering those sources with K for which the uncertainties are much larger, is 0.830.05, while the weighted mean is 0.500.01.
To identify dense material associated with the formation of massive stars and clusters, Battersby et al. (2011) performed iterative removal of cirrus cloud emission on Hi-GAL images. The spectral emission distribution fitted for each point across the map results in a median value for temperature of T23 K for a spectral index of 1.7 on °. The region considered as source emission is roughly the contour at (1070 MJy sr-1) in the 350 m SPIRE band, and hence SHARC-II maps still miss extended emission that is considered to be source emission by Battersby et al.. From their temperature map, we estimated a temperature for this extended background emission, masking the region above 15 from the 350 m SPIRE map, and also masking circular areas of 80″ diameter centered on each BGPS V2.1 source on the map. We found a temperature of 25 K, for a fixed 1.75 for the emission considered for SED fitting by Battersby et al. but filtered out in SHARC-II maps.
We tested then the estimation of color temperature on compact sources, if additional background emission were considered. A simple model of a source emitting uniformly as a modified blackbody, characterized by a temperature and a spectral index , combined with background emission, also modeled as a modified blackbody, with Tback and . The measured fluxes of the composite emission, and , correspond to the sum of individual contributions at those wavelengths, and following equation 3, differences between and , and and , will recover a new set of measured values and . For a field near , where the very dense structures are likely spread over diffuse emission with K and , we simulated the recovery of properties for input sources with a range of parameters characteristic of clump-like features, K, and . The ratio of the input to the determined temperatures, as a function of the measured 1.1mm flux, are shown in the lower panel of Fig 19. The results are qualitatively similar to the comparison between and , with low-flux, cold sources having low ratios of temperatures; warm, strong mm emission clumps have ratios of temperatures slightly above 1.0; and with sources with temperatures of 10-20 K (the bulk of BGPS clumps in °) with temperature ratios in the range 0.4-1.0.
A more direct comparison can be performed with compact sources extracted on Herschel images using the CUTEX method, designed for detection of sources on intense and highly variable fore/background (Molinari et al., 2011). Using a similar method as presented by Elia et al. (2013), a catalog of extracted compact sources and their associated physical parameters, using the five bands of Hi-GAL, have been obtained for the inner Galaxy () (D. Elia et al., in preparation). These sources are extracted from background emission and therefore considered to represent the very dense clump-core features across molecular clouds. From a simple spatial match performed to the 102 BGPS sources toward ° that have estimated color-temperatures, 76 of these clumps have a counterpart Hi-GAL compact source, and preliminary results produce much better agreement with the temperatures derived in this paper from SHARC and BGPS data; the ratio between these temperatures have a mean of 1.05 and a median of 0.97. In both cases, a fixed value of the spectral index was considered. Several considerations need to be assessed, such as different beam resolutions between observation bands, and a more complete analysis between the presented sample of SHARC-II maps and properties of extracted sources with Hi-GAL, including substructures and association with emission at 70 m, will be the subject of a forthcoming work.
V.3. Comparison between gas temperature from NH3 and color temperature
Figure 20 shows the ratio of gas to dust temperatures for a sample of BGPS sources. The gas temperatures were determined from NH3 observations (Dunham et al., 2010; Wienen et al., 2012, and BGPS team in prep.). For those observations not centered on peak positions of BGPS sources, we associated the NH3 detections to their closest BGPS source within one beam distance. Only the 49 clumps with dust temperatures below 50 K and gas temperatures below 30 K are plotted. The ratio has a weighted average of 0.88 and a median of 0.76. There are few sources with equal temperatures, but instead a group with lower and a group with higher .
V.4. Comparison with tracers of dense gas
Schlingman et al. (2011) presented spectroscopic observations of HCO+ and N2H+ (3-2) for 1882 sources from BGPS. The selection of sources was made between Galactic longitudes , considering all sources with integrated flux in a 40″ aperture greater than S0.4 Jy, and from bins of logarithmically spaced flux of 0.1 for sources with S Jy. A new, complete version of this catalog by Shirley et al. (2013) includes all 6194 sources in the BGPS V1.0 catalog between of this pair of molecular transitions. After considering a one-to-one match between sources from V1.0 and V2.1 catalogs, with a spatial matching of one beam of distance (33″), we checked which of those sources are present in our sample of SHARC-II maps. There are 300 V2.1 sources with spectroscopy data, 250 of them with HCO+ detections and estimated dust temperatures from our analysis, and 199 with N2H+ detections with dust temperatures. Figure 21 shows the peak main beam temperature versus our fitted temperature for that group of sources. The points scatter widely about the plot. Considering only the sources with dust temperatures less than 50 K (169 for N2H+ and 223 for HCO+), the Spearman’s rank correlation coefficient of the distributions of log() and log() are 0.51 for sources with N2H+ detections, and 0.33 for sources with HCO+ detections. We tested the null hypothesis of no significant correlation between log() and log() for these distributions. For a sample size , the Student’s value for the Pearson correlation coefficient is estimated from , with . For a two-tailed probability value , our sample requires , corresponding to and . The estimated values for the correlation coefficients of our sample are and for N2H+ and HCO+, respectively, rejecting the null hypothesis at a 95% confidence. Therefore, although the correlation is weak, in both cases it is statistically significant for the detected peak main beam temperature and the fitted dust temperature. In the case of N2H+, the correlation can be fitted as log() = Blog() + A, with fitted values A=1.55 and B=1.040.13. For HCO+, the fitted parameters are A=0.59 and B=0.520.08.
Shirley et al. (2013) suggested that BGPS sources with a higher N2HHCO+ ratio could be clumps with dense core-like structures in them, as a consequence of cold, CO-depleted gas within those cores. Nevertheless, we did not find a clear correlation between the ratio of high density tracers N2HHCO+, and number of substructures or estimated dust temperature in our source sample. Parental clumps with large multiplicity of substructures and high N2HHCO+ ratios represent good candidates for future interferometric observations to study core properties in regions of clustered massive-star formation.
VI. Discussion
VI.1. Mass and surface density of substructures
We use the following equation to calculate the mass:
| (4) |
where is the flux density, is the distance to the source, and is the dust mass opacity coefficient.
We use a dust opacity of 1.14 cm2g-1 of dust at 1.1 mm (Ossenkopf & Henning, 1994) for a model with thin ice mantles (OH5). Assuming a dust-to-gas mass ratio of , the mass of gas and dust will be given by:
| (5) | |||||
From our sample of 512 BGPS sources with temperatures K, we can give some estimates of how the values of masses will change when a fixed temperature is used. The average ratio between the clump mass , with the fitted dust temperature from continuum observations between 350 m and 1.1 mm, and the mass estimated at a fixed temperature, , is obtained from:
| (6) |
Figure 22 shows the results of the above equation for different values of . It is common to use for simplicity a fixed value of 20 K in determination of masses from millimeter surveys of Galactic star forming regions (e.g. Motte et al., 2007; Schlingman et al., 2011; Urquhart et al., 2013). Using K, the average value of the ratio is 2.430.11, with a median value of 1.83. Therefore, assuming a fiducial value for the temperature of 20 K for our sample of clumps, the estimation of masses would be underestimated on average, with respect to the mass obtained from our analysis of color temperatures.
From Ellsworth-Bowers et al. (2013, 2015), kinematic distances were determined for a large number of BGPS sources. Only a fraction of our sample of BGPS clumps have estimated distances, so we cannot calculate masses for the entire group. However, we can estimate the contribution of masses from substructures detected at 350 um with respect to the parental clump, because both substructures and clump are located at the same distance. We use the flux density at 350 m to compute masses of the substructures. Similar to equation 5, but with appropriate change in the exponential and with a dust opacity of 11 cm2g-1 (OH5), the mass measured at 350 m is as follows:
| (7) | |||||
From our sample of 349 BGPS parental clumps associated with 1352 high-resolution sources, the fraction of the total mass estimated for structures at 350 m with respect to the mass of the parental 1.1 mm clump is determined by:
| (8) | |||||
where is the emission of the parental BGPS clump and represent the total emission of substructures inside that clump. We consider the same dust temperature , fitted from equation 3, for substructures and their parental clump. Here the integrated emission recovered by Bolocat for each clump is taken into account, which estimates the total flux for the area delimited by the labelmask region (see Section IV.5). In that way, the contribution of each substructure will be associated with a single parental clump, with both considered at the same dust temperature.
Figure 23 shows the ratio between masses obtained for high-resolution sources at 350 m and their parental BGPS clump, as a function of the dust temperature and as a function of the integrated flux at 1.1 mm. Black points represent the mass ratio considering the flux contribution of all high-resolution sources, and red points only consider emission from strong, compact sources. The average and median values for the mass ratio when all substructures are considered, are 0.48 and 0.40, respectively, with a mean weighted by errors of 0.220.01. Parental clumps that are more massive and cold have smaller uncertainties, so the mean mass ratio weighted inversely by uncertainty is smaller. When only compact substructures (see Section IV.5) are considered, the average and median of the distribution are 0.39 and 0.37, respectively, with a mean weighted by errors of 0.190.01. These results for the mass fraction are larger than the results from Ragan et al. (2013), who fit SEDs and obtained a value of % for the mass contribution of core-like features observed at a resolution of 7.8″ compared to the total mass of their harboring IRDCs. Possible explanations of this difference are our larger sample of sources (Ragan et al. consider 11 IRDCs, harboring a total of 83 substructures), and also that, contrary to BGPS sources, IRDCs are not limited to compact structures. Besides, our sample of clumps has a broader range of evolutionary stages, not necessarily limited to the coldest, initial stages of massive star formation, represented by the IRDC phase.
Assuming a uniform temperature will also introduce errors in the mass determination. The parental molecular clump will be affected by both embedded stars and the external radiation field, and it is likely that substructures will have a different temperature from their surrounding medium. In addition, SHARC-II and Bolocam are sensitive to different spatial scale emission (see Section IV.3), and therefore the recovered flux at 1.1 mm could include faint, extended background emission not detected in 350 m continuum emission. A better analysis of the mass ratio between parental clumps and their internal structures (compact, core-type sources, and faint, filamentary emission) will require a comparison between SHARC-II and Herschel maps at 350 m, or modeling these sources using radiative transfer codes.
Figure 24 shows the surface density estimated for the substructures found in the 350 m map, as a function of the surface density of their parental clump, . We considered the deconvolved radius of resolved substructures at 8.5″and resolved clumps at 33″. Identified substructures have in general larger surface densities than their parental BGPS source. For the sample of spatially resolved sources, there are 418 compact substructures, 286 of which have estimated temperatures K. These are represented by red points in the figure. A linear fit of the compact sources indicate that they have 2.2. Eighteen of them (6%) have g cm-2, a theoretically predicted threshold for the formation of massive stars (Krumholz & McKee, 2008). More recently a lower value of 0.2 g cm-2 was proposed by Butler & Tan (2012) as the initial condition of massive star formation in the Galaxy; 88 (31%) of our sources meet that criterion.
Thus, for our sample of high-resolution structures observed at 350 m, there are probably many dense cores, whose physical parameters suggest on-going or imminent formation of massive stars.
VI.2. Uncertainties on determined physical parameters of clumps
Following equation 3, the presence of additional integrated flux densities observed at 350 m and 1.1 mm not related to the dust emission of a given clump-like source, such as emission from the surrounding environment of the compact source, or contamination from molecular lines on those bands, can introduce dissimilarities between the recovered and real flux ratio and therefore in subsequent derived physical parameters. As seen in Section V.2, the temperature estimated for a source embedded in a background with different temperature (or spectral index) may differ from the actual source temperature. While the data-reduction pipeline of the Hi-GAL survey is coded to remove low frequency noise, which imply that the 350 m Herschel images recover faint diffuse emission (Traficante et al., 2011), SHARC-II maps filter out most of that emission and recover the very dense, compact structures, and BGPS maps are not sensitive to extended emission at scales larger than 2′-3′ (Ginsburg et al., 2013). The precise amount of additional flux per band is determined by the temperature and spectral index of the background extended emission (see Fig. 19).
In the case that observations of a particular clump recover some background emission in the 1.1 mm BGPS but not in the 350 m SHARC-II maps, their overall effect would consist of lower measured color temperature, and higher mass estimation. Contamination of CO lines by the 350 m emission is not expected for the bulk of clumps in this work. The level of CO is 155 K above ground, and even though this line has been seen in sources with kinetic gas temperature of 25 K (Krugel et al., 1989), emission is expected only in the warmer and denser clumps. No line contamination is possible at 1.1 mm since the passband of Bolocam excludes the strong CO line.
To quantify these uncertainties, we consider two hypothetical cases of clumps with equal spectral index and temperatures of 20 K and 40 K, respectively. These sources have an associated value of the ratio of integrated flux densities observed at 350 m and 1.1 mm, and additional emission in these bands will produce variation of the measured value of the flux ratio, . For the case K, differences of less than 20% between and the intrinsic flux ratio of the source , will imply a measured temperature also 20% different from the source temperature . From equation 5, the uncertainty in the determination of the clump mass and surface density will be 30%.
For warmer sources, even small changes to the flux ratio will result on large uncertainties in the measured . For K, differences of 10% between and will result in differences of 30% of with respect to , and clump mass and surface density will also have uncertainties 30%. In the case of differences of 20% between and , measured temperatures could be 80% different from the real , and clump mass and surface density will have additional uncertainties of 50%.
VII. Summary and Conclusions
We presented a set of 107 SHARC-II 350 m maps toward star forming clumps. Most of maps are observed toward sources from the BGPS V2.1 catalog, with additional maps covering three outer Galaxy star forming regions. The maps have a resolution of 8.5″, improving upon the resolution of the BGPS maps at 1.1 mm (33″) and revealing a population of substructures.
We used Bolocat to identify significant emission in the SHARC-II maps, and we obtained a catalog of 1386 high-resolution sources, with average fluxes of 23.151.59 Jy and average radius of 15″. We found that 32% of these features have peak emission above 10, and we consider these “compact substructures” as core-like sources immersed in parental clumps. Below this limit, recovered sources are called “faint substructures”, and they are related with fragmentation of filamentary features, isolated low intensity sources, and residuals from the source extraction algorithm.
We found 619 BGPS V2.1 sources in our set of 350 m maps, only 56% of which are associated with 1352 high-resolution substructures. While most of the parental clumps have only one or two associated substructures, we found significant multiplicity in some of them, with 22 clumps having more than 10 substructures in them.
We compared the 350 m continuum emission from SHARC-II maps with Herschel images from the Hi-GAL survey toward the region at same wavelengths. Strong emission detected in SHARC-II maps is in general in good agreement with the Hershel fluxes, but faint sources from the SHARC-II maps are immersed in background emission.
We estimated temperatures for different models of the spectral index. For the 512 sources with “good fits” in the determination of temperatures ( K), the median and average values of their temperatures are 13.3 K and 16.30.4 K, respectively, in reasonable agreement with other temperature determination methods based on SED analysis.
Comparison to gas temperatures derived from NH3 observations reveals sources with ratios of both larger and smaller than unity, but with mean value of 0.88.
Sources with N2H+ and HCO+ detections present weak correlations between their observed peak main beam temperature and their fitted dust temperature. There is no clear correlation between the ratio T(N2H+)T(HCO+) and the number of substructures found on parental clumps.
The fraction of the mass contained in substructures compared with the total parental clump mass has an average of 0.48, but this value decreases to 0.22 when weighted by uncertainties. Considering only the compact structures, likely to be core sources, the mass fraction between substructures and parental clumps is 0.19, higher than other studies of high angular resolution at 350 m.
Small, but significant fractions of substructures satisfy theoretical thresholds for massive star formation of 0.2 (31%) or 1.0 (6%) g cm-2.
References
- Aguirre et al. (2011) Aguirre, J. E., Ginsburg, A. G., Dunham, M. K., et al. 2011, ApJS, 192, 4
- Bally et al. (2010) Bally, J., Aguirre, J., Battersby, C., et al. 2010, ApJ, 721, 137
- Bally & Zinnecker (2005) Bally, J., & Zinnecker, H. 2005, AJ, 129, 2281
- Battersby et al. (2010) Battersby, C., Bally, J., Jackson, J. M., et al. 2010, ApJ, 721, 222
- Battersby et al. (2011) Battersby, C., Bally, J., Ginsburg, A., et al. 2011, A&A, 535, A128
- Beckwith & Sargent (1991) Beckwith, S. V. W., & Sargent, A. I. 1991, ApJ, 381, 250
- Beelen et al. (2006) Beelen, A., Cox, P., Benford, D. J., et al. 2006, ApJ, 642, 694
- Benjamin et al. (2003) Benjamin, R. A., Churchwell, E., Babler, B. L., et al. 2003, PASP, 115, 953
- Bertin & Arnouts (1996) Bertin, E., & Arnouts, S. 1996, A&AS, 117, 393
- Bohlin et al. (1978) Bohlin, R. C., Savage, B. D., & Drake, J. F. 1978, ApJ, 224, 132
- Butler & Tan (2012) Butler, M. J., & Tan, J. C. 2012, ApJ, 754, 5
- Carey et al. (2009) Carey, S. J., Noriega-Crespo, A., Mizuno, D. R., et al. 2009, PASP, 121, 76
- Cesaroni et al. (1991) Cesaroni, R., Walmsley, C. M., Koempe, C., & Churchwell, E. 1991, A&A, 252, 278
- Cesaroni et al. (1994) Cesaroni, R., Olmi, L., Walmsley, C. M., Churchwell, E., & Hofner, P. 1994, ApJ, 435, L137
- Churchwell et al. (1990) Churchwell, E., Walmsley, C. M., & Cesaroni, R. 1990, A&AS, 83, 119
- Contreras et al. (2013) Contreras, Y., Schuller, F., Urquhart, J. S., et al. 2013, A&A, 549, A45
- Draine & Lee (1984) Draine, B. T., & Lee, H. M. 1984, ApJ, 285, 89
- Dowell et al. (2003) Dowell, C. D., et al. 2003, Proc. SPIE, 4855, 73
- Dunham et al. (2010) Dunham, M. K., Rosolowsky, E., Evans, N. J., II, et al. 2010, ApJ, 717, 1157
- Dunham et al. (2011) Dunham, M. K., Rosolowsky, E., Evans, N. J., II, Cyganowski, C., & Urquhart, J. S. 2011, ApJ, 741, 110
- Egan et al. (1998) Egan, M. P., Shipman, R. F., Price, S. D., et al. 1998, ApJ, 494, L199
- Elia et al. (2013) Elia, D., Molinari, S., Fukui, Y., et al. 2013, ApJ, 772, 45
- Ellsworth-Bowers et al. (2013) Ellsworth-Bowers, T. P., Glenn, J., Rosolowsky, E., et al. 2013, ApJ, 770, 39
- Ellsworth-Bowers et al. (2015) Ellsworth-Bowers, T. P., Rosolowsky, E., Glenn, J., et al. 2015, ApJ, 799, 29
- Evans (1999) Evans, N. J., II 1999, ARA&A, 37, 311
- Faúndez et al. (2004) Faúndez, S., Bronfman, L., Garay, G., et al. 2004, A&A, 426, 97
- Foster & Goodman (2006) Foster, J. B., & Goodman, A. A. 2006, ApJ, 636, L105
- Garay & Lizano (1999) Garay, G., & Lizano, S. 1999, PASP, 111, 1049
- Ginsburg et al. (2013) Ginsburg, A., Glenn, J., Rosolowsky, E., et al. 2013, ApJS, 208, 14
- Groesbeck (1995) Groesbeck, T. D. 1995, PhD thesis, California Institute of Technology
- Hatchell & Dunham (2009) Hatchell, J., & Dunham, M. M. 2009, A&A, 502, 139
- Johnstone & Bally (2006) Johnstone, D., & Bally, J. 2006, ApJ, 653, 383
- Johnstone et al. (2006) Johnstone, D., Matthews, H., & Mitchell, G. F. 2006, ApJ, 639, 259
- Klein et al. (2005) Klein, R., Posselt, B., Schreyer, K., Forbrich, J., & Henning, T. 2005, ApJS, 161, 361
- Kovács (2006) Kovács, A., SHARC-2 350 m Observations of Distant Submillimeter-Selected Galaxies and Techniques for the Optimal Analysis and Observing of Weak Signals, PhD Thesis, Caltech, 2006.
- Krugel et al. (1989) Krugel, E., Densing, R., Nett, H., et al. 1989, A&A, 211, 419
- Krumholz & McKee (2008) Krumholz, M. R., & McKee, C. F. 2008, Nature, 451, 1082
- Longmore et al. (2012) Longmore, S. N., Rathborne, J., Bastian, N., et al. 2012, ApJ, 746, 117
- McKee & Ostriker (2007) McKee, C. F., & Ostriker, E. C. 2007, ARA&A, 45, 565
- Megeath et al. (2008) Megeath, S. T., Townsley, L. K., Oey, M. S., & Tieftrunk, A. R. 2008, Handbook of Star Forming Regions, Volume I: The Northern Sky Astronomical Society of the Pacific Monograph Publications, Vol. 4. Edited by Bo Reipurth, p.264
- Molinari et al. (2010) Molinari, S., Swinyard, B., Bally, J., et al. 2010, PASP, 122, 314
- Molinari et al. (2011) Molinari, S., Schisano, E., Faustini, F., et al. 2011, A&A, 530, AA133
- Moore et al. (2007) Moore, T. J. T., Bretherton, D. E., Fujiyoshi, T., et al. 2007, MNRAS, 379, 663
- Motte et al. (2007) Motte, F., Bontemps, S., Schilke, P., Schneider, N., Menten, K. M., & Broguière, D. 2007, A&A, 476, 1243
- Motte et al. (2010) Motte, F., Zavagno, A., Bontemps, S., et al. 2010, A&A, 518, LL77
- Mueller et al. (2002) Mueller, K. E., Shirley, Y. L., Evans, N. J., II, & Jacobson, H. R. 2002, ApJS, 143, 469e
- Ossenkopf & Henning (1994) Ossenkopf, V., & Henning, T. 1994, A&A, 291, 943
- Padoan et al. (2006) Padoan, P., Juvela, M., & Pelkonen, V.-M. 2006, ApJ, 636, L101
- Plume et al. (1992) Plume, R., Jaffe, D. T., & Evans, N. J., II 1992, ApJS, 78, 505
- Ragan et al. (2013) Ragan, S. E., Henning, T., & Beuther, H. 2013, A&A, 559, AA79
- Rathborne et al. (2006) Rathborne, J. M., Jackson, J. M., & Simon, R. 2006, ApJ, 641, 389
- Rathborne et al. (2010) Rathborne, J. M., Jackson, J. M., Chambers, E. T., et al. 2010, ApJ, 715, 310
- Richards et al. (2012) Richards, E. E., Lang, C. C., Trombley, C., & Figer, D. F. 2012, AJ, 144, 89
- Rivera-Ingraham et al. (2013) Rivera-Ingraham, A., Martin, P. G., Polychroni, D., et al. 2013, ApJ, 766, 85
- Rosolowsky et al. (2010) Rosolowsky, E., Dunham, M. K., Ginsburg, A., et al. 2010, ApJS, 188, 123
- Schuller et al. (2009) Schuller, F., et al. 2009, A&A, 504, 415
- Shirley et al. (2000) Shirley, Y. L., Evans, N. J., II, Rawlings, J. M. C., & Gregersen, E. M. 2000, ApJS, 131, 249
- Shirley et al. (2005) Shirley, Y. L., Nordhaus, M. K., Grcevich, J. M., et al. 2005, ApJ, 632, 982
- Shirley et al. (2011) Shirley, Y. L., Huard, T. L., Pontoppidan, K. M., et al. 2011, ApJ, 728, 143
- Shirley et al. (2013) Shirley, Y. L., Ellsworth-Bowers, T. P., Svoboda, B., et al. 2013, ApJS, 209, 2
- Stahler et al. (2000) Stahler, S. W., Palla, F., & Ho, P. T. P. 2000, Protostars and Planets IV, 327
- Schlingman et al. (2011) Schlingman, W. M., Shirley, Y. L., Schenk, D. E., et al. 2011, ApJS, 195, 14
- Simon et al. (2006) Simon, R., Jackson, J. M., Rathborne, J. M., & Chambers, E. T. 2006, ApJ, 639, 227
- Tan et al. (2014) Tan, J. C., Beltran, M. T., Caselli, P., et al. 2014, arXiv:1402.0919
- Traficante et al. (2011) Traficante, A., Calzoletti, L., Veneziani, M., et al. 2011, MNRAS, 416, 2932
- Urquhart et al. (2013) Urquhart, J. S., Moore, T. J. T., Schuller, F., et al. 2013, MNRAS, 431, 1752
- Wienen et al. (2012) Wienen, M., Wyrowski, F., Schuller, F., et al. 2012, A&A, 544, A146
- Williams et al. (1994) Williams, J. P., de Geus, E. J., & Blitz, L. 1994, ApJ, 428, 693
- Williams et al. (2000) Williams, J. P., Blitz, L., & McKee, C. F. 2000, Protostars and Planets IV, 97
- Wright et al. (2010) Wright, E. L., Eisenhardt, P. R. M., Mainzer, A. K., et al. 2010, AJ, 140, 1868
- Wu et al. (2007) Wu, J., Dunham, M. M., Evans, N. J., II, Bourke, T. L., & Young, C. H. 2007, AJ, 133, 1560
- Wynn-Williams et al. (1972) Wynn-Williams, C. G., Becklin, E. E., & Neugebauer, G. 1972, MNRAS, 160, 1
- Zinnecker & Yorke (2007) Zinnecker, H., & Yorke, H. W. 2007, ARA&A, 45, 481
| Date | Cbeam | C20 | C40 | C |
|---|---|---|---|---|
| (Jy beam) | (Jy) | (Jy) | (Jy) | |
| 2006 Jun | 9.840.68 | 0.350.03 | 0.280.02 | 0.420.03 |
| 2007 Jul | 7.010.21 | 0.230.01 | 0.200.01 | 0.290.01 |
| 2007 Oct | 8.080.32 | 0.270.01 | 0.230.01 | 0.340.01 |
| 2009 Sep | 6.050.25 | 0.210.02 | 0.170.01 | 0.260.02 |
| 2009 Dec | 5.890.11 | 0.220.01 | 0.170.01 | 0.250.01 |
| 2010 JulaaDoes not include calibration from July 24, 2010. | 7.310.25 | 0.240.01 | 0.200.01 | 0.300.01 |
| 2010 Jul 24 | 17.832.50 | 0.670.06 | 0.510.06 | 0.770.09 |
| 2010 Dec | 6.690.16 | 0.230.01 | 0.190.01 | 0.280.01 |
| 2011 Dec | 10.820.39 | 0.380.01 | 0.310.01 | 0.460.02 |
| 2012 Sep | 15.590.85 | 0.520.03 | 0.430.02 | 0.650.04 |
| Map | Config.aaA: BOX SCAN 571.429 600 40.0 45. B: BOX SCAN 345.600 360 30.0 45. C: BOX SCAN 228.571 240 20.0 45. D: BOX SCAN 606.1 636.4 60.0 45. E: BOX SCAN 169.7 167.5 60.0 45. F: BOX SCAN 144.6 148.0 60.0 45. G: BOX SCAN 144.6 148.0 60.0 45. H: BOX SCAN 707.1 669.9 60.0 45. I: BOX SCAN 1060.7 1157.1 60.0 45. The configuration BOX SCAN X Y R A indicates that the map has a size of X(arcsec)Y(arcsec), a scan rate R (arcsec/sec), and a scanning angle A (deg). | Size | Map Center | Obs. Date | 1 NoisebbRepresentative noise is estimated on the central area of each map, avoiding edges (see Section IV.1). | |
|---|---|---|---|---|---|---|
| R.A. (J2000) | Dec. (J2000) | (mJy beam-1) | ||||
| L359.85+0.00ccAdditional SHARC-II 350 m continuum data on the Galactic center were presented by Bally et al. (2010). | A | 17:45:15.356 | -29:03:48.64 | 2006Jun | 994 | |
| L000.00+0.00ccAdditional SHARC-II 350 m continuum data on the Galactic center were presented by Bally et al. (2010). | A | 17:45:38.222 | -28:56:15.83 | 2006Jun | 1453 | |
| L000.15+0.00ccAdditional SHARC-II 350 m continuum data on the Galactic center were presented by Bally et al. (2010). | A | 17:45:59.055 | -28:48:38.10 | 2006Jun | 1438 | |
| L000.30+0.00ccAdditional SHARC-II 350 m continuum data on the Galactic center were presented by Bally et al. (2010). | A | 17:46:20.056 | -28:40:51.99 | 2006Jun | 1086 | |
| L029.95-0.05 | A | 18:46:10.078 | -02:40:45.19 | 2006Jun | 514 | |
| L030.00+0.00 | A | 18:46:05.764 | -02:36:40.25 | 2006Jun | 462 | |
| L030.15+0.00 | A | 18:46:21.926 | -02:28:41.39 | 2006Jun | 426 | |
| L030.30+0.00 | A | 18:46:38.373 | -02:20:39.29 | 2006Jun | 496 | |
| L030.45+0.00 | A | 18:46:54.711 | -02:12:38.81 | 2006Jun | 603 | |
| L030.60+0.00 | A | 18:47:11.158 | -02:04:35.09 | 2006Jun | 888 | |
| L030.70-0.07 | A | 18:47:36.576 | -02:01:32.42 | 2006Jun | 510 | |
| L030.80-0.05 | A | 18:47:43.784 | -01:55:09.17 | 2006Jun | 529 | |
| L030.88+0.13 | A | 18:47:13.872 | -01:45:57.32 | 2006Jun | 367 | |
| L034.26+0.15 | A | 18:53:19.759 | +01:14:36.57 | 2006Jun | 395 | |
| L076.16+0.09 | A | 20:23:52.185 | +37:36:41.20 | 2006Jun | 249 | |
| L077.93+0.02 | A | 20:29:23.675 | +39:00:58.88 | 2006Jun | 389 | |
| L078.14-0.32 | A | 20:31:26.817 | +38:58:53.21 | 2006Jun | 408 | |
| L078.96+0.37 | A | 20:31:03.924 | +40:02:54.24 | 2006Jun | 445 | |
| L079.28+0.30 | A | 20:32:20.042 | +40:15:45.21 | 2006Jun | 558 | |
| L080.92-0.11 | A | 20:39:16.364 | +41:19:41.83 | 2006Jun | 724 | |
| L081.45+0.04 | A | 20:40:23.200 | +41:50:33.25 | 2006Jun | 274 | |
| L081.68+0.54 | A | 20:39:01.659 | +42:19:37.11 | 2006Jun | 802 | |
| L082.55+0.14 | A | 20:43:35.922 | +42:46:07.20 | 2006Jun | 255 | |
| L075.76+0.41 | A | 20:21:24.076 | +37:27:55.95 | 2007Jul | 652 | |
| L076.12-0.24 | B | 20:25:07.547 | +37:23:14.34 | 2007Jul | 388 | |
| L076.35-0.58 | B | 20:27:10.982 | +37:22:29.34 | 2007Jul | 430 | |
| L078.92-0.19 | A | 20:33:18.191 | +39:41:24.34 | 2007Jul | 689 | |
| L078.17-0.31 | A | 20:31:29.785 | +39:00:20.75 | 2007Jul | 800 | |
| L079.62+0.49 | A | 20:32:36.698 | +40:39:16.34 | 2007Jul | 1489 | |
| L079.11-0.35 | A | 20:34:33.491 | +39:44:46.95 | 2007Jul | 1226 | |
| L080.86+0.38 | A | 20:37:00.649 | +41:34:35.34 | 2007Jul | 1874 | |
| L110.11+0.05 | C | 23:05:11.371 | +60:14:41.67 | 2007Oct | 288 | |
| L111.62+0.38 | C | 23:15:32.196 | +61:07:30.77 | 2007Oct | 342 | |
| L134.28+0.86 | C | 02:29:02.834 | +61:33:28.83 | 2007Oct | 275 | |
| L134.83+1.31 | C | 02:34:45.364 | +61:46:15.77 | 2007Oct | 296 | |
| L136.38+2.27 | C | 02:50:08.515 | +61:59:54.27 | 2007Oct | 257 | |
| L136.83+1.07 | C | 02:49:04.352 | +60:43:23.95 | 2007Oct | 250 | |
| L111.28-0.66 | A | 23:16:04.681 | +60:02:06.00 | 2009Sep-2009Dec | 286 | |
| L111.54+0.78 | A | 23:13:44.302 | +61:28:10.18 | 2009Sep | 496 | |
| L133.71+1.21 | A | 02:25:41.066 | +62:05:42.68 | 2009Sep-2009Dec | 338 | |
| L133.95+1.06 | A | 02:27:03.912 | +61:52:14.05 | 2009Sep-2009Dec | 338 | |
| L111.26-0.77 | A | 23:16:11.144 | +59:55:27.74 | 2009Dec | 538 | |
| L111.78+0.59 | A | 23:16:13.500 | +61:22:51.01 | 2009Dec | 412 | |
| L111.79+0.71 | D,A | 23:15:52.220 | +61:30:02.26 | 2009Dec-2012Sep | 307 | |
| L111.88+0.82 | D,A | 23:16:15.419 | +61:37:42.69 | 2009Dec | 473 | |
| L136.52+1.24 | D | 02:47:25.531 | +61:00:34.20 | 2009Dec | 260 | |
| L136.85+1.14 | E | 02:49:28.155 | +60:47:02.96 | 2009Dec | 337 | |
| L136.95+1.09 | D | 02:50:02.727 | +60:41:52.32 | 2009Dec | 475 | |
| L137.69+1.46 | H | 02:56:47.527 | +60:41:21.90 | 2009Dec | 667 | |
| L138.30+1.56 | D,A | 03:01:34.013 | +60:29:10.72 | 2009Dec-2011Dec-2012Sep | 205 | |
| L138.48+1.63 | D,A | 03:03:09.052 | +60:27:39.61 | 2009Dec-2011Dec-2012Sep | 266 | |
| L173.14+2.36 | A | 05:37:57.556 | +36:00:18.63 | 2009Dec | 777 | |
| L173.17+2.35 | G | 05:37:59.420 | +35:58:27.54 | 2009Dec | 320 | |
| L173.47+2.43 | F | 05:39:07.589 | +35:46:02.82 | 2009Dec | 487 | |
| L173.57+2.44 | F | 05:39:24.823 | +35:40:55.71 | 2009Dec | 421 | |
| L173.62+2.81 | D | 05:41:07.430 | +35:50:21.17 | 2009Dec | 359 | |
| L173.72+2.70 | G | 05:40:52.684 | +35:41:45.31 | 2009Dec | 387 | |
| L173.76+2.67 | G | 05:40:51.995 | +35:38:53.79 | 2009Dec | 301 | |
| L188.79+1.03 | A | 06:09:06.309 | +21:50:45.79 | 2009Dec | 259 | |
| L188.95+0.88 | D,A | 06:08:52.987 | +21:38:19.76 | 2009Dec | 268 | |
| L189.03+0.78 | D,A | 06:08:39.856 | +21:31:11.38 | 2009Dec | 290 | |
| L189.12+0.64 | A | 06:08:20.114 | +21:22:04.54 | 2009Dec | 403 | |
| L189.68+0.19 | D,A | 06:07:47.653 | +20:39:28.06 | 2009Dec | 155 | |
| L189.85+0.39 | I | 06:08:53.475 | +20:36:24.00 | 2009Dec | 505 | |
| L190.17+0.74 | A | 06:10:51.620 | +20:29:49.63 | 2009Dec | 184 | |
| L192.60-0.16 | D | 06:12:28.348 | +17:56:17.12 | 2009Dec | 340 | |
| L192.60-0.05 | D,A | 06:12:53.279 | +17:59:28.55 | 2009Dec-2010Dec | 271 | |
| L192.72+0.04 | A | 06:13:28.147 | +17:55:38.60 | 2009Dec | 335 | |
| L192.81+0.11 | D | 06:13:55.135 | +17:53:09.02 | 2009Dec | 328 | |
| L192.98+0.14 | D | 06:14:21.502 | +17:45:02.52 | 2009Dec | 383 | |
| L196.42-1.66 | A | 06:14:36.606 | +13:52:04.40 | 2009Dec | 470 | |
| L203.23+2.06 | A | 06:41:00.779 | +09:33:56.58 | 2009Dec | 269 | |
| L203.35+2.03 | A | 06:41:07.741 | +09:26:52.53 | 2009Dec | 314 | |
| L213.71-12.62 | D | 06:07:42.663 | -06:23:27.15 | 2009Dec | 421 | |
| L217.37-0.07 | A | 06:59:17.374 | -03:59:14.04 | 2009Dec | 704 | |
| L234.57+0.82 | D | 07:35:28.482 | -18:45:34.36 | 2009Dec | 1051 | |
| L001.10-0.07 | A | 17:48:28.655 | -28:01:44.77 | 2010Jul | 849 | |
| L023.31-0.26 | A | 18:34:39.947 | -08:40:36.21 | 2010Jul | 379 | |
| L023.43-0.22 | A | 18:34:45.046 | -08:32:55.27 | 2010Jul | 375 | |
| L024.50-0.08 | A | 18:36:14.747 | -07:31:49.77 | 2010Jul | 306 | |
| L024.65-0.13 | A | 18:36:44.447 | -07:25:23.71 | 2010Jul | 357 | |
| L024.78+0.12 | A | 18:36:04.446 | -07:11:28.75 | 2010Jul | 363 | |
| L025.40-0.18 | A | 18:38:16.246 | -06:47:09.20 | 2010Jul | 482 | |
| L030.61+0.16 | A | 18:46:39.147 | -01:59:36.24 | 2010Jul | 349 | |
| L031.28+0.05 | A | 18:48:14.651 | -01:26:51.80 | 2010Jul | 303 | |
| L081.11-0.16 | A | 20:40:05.498 | +41:26:56.24 | 2010Jul | 341 | |
| L081.28+1.01 | A | 20:35:39.600 | +42:17:38.79 | 2010Jul | 250 | |
| L081.39+0.73 | A | 20:37:12.963 | +42:12:38.77 | 2010Jul | 341 | |
| L081.48+0.00 | A | 20:40:37.896 | +41:50:26.77 | 2010Jul | 353 | |
| L081.76+0.60 | A | 20:39:01.567 | +42:25:36.73 | 2010Jul | 329 | |
| L031.41+0.31 | A | 18:47:34.152 | -01:12:46.30 | 2010Jul24 | 791 | |
| L081.88+0.77 | A | 20:38:39.559 | +42:37:37.68 | 2010Jul24 | 717 | |
| L183.40-0.58 | A | 05:51:16.720 | +25:43:32.50 | 2010Dec | 255 | |
| L189.78+0.33 | A | 06:08:32.990 | +20:38:33.34 | 2010Dec | 294 | |
| L202.58+2.42 | A | 06:41:06.051 | +10:18:59.80 | 2010Dec | 370 | |
| L142.01+1.77 | A | 03:27:29.910 | +58:43:55.31 | 2011Dec | 305 | |
| L151.61-0.24 | A | 04:11:07.205 | +51:09:21.54 | 2011Dec | 266 | |
| L154.37+2.58 | A | 04:36:18.153 | +51:11:02.11 | 2011Dec | 266 | |
| L169.18-0.89 | A | 05:13:26.754 | +37:27:38.75 | 2011Dec | 232 | |
| L172.88+2.27 | A | 05:36:53.085 | +36:10:29.56 | 2011Dec | 315 | |
| L211.53-19.27 | A | 05:39:57.873 | -07:27:48.36 | 2011Dec | 254 | |
| L111.42+0.76 | A | 23:12:52.873 | +61:24:31.27 | 2012Sep | 375 | |
| L111.88+0.99 | A | 23:15:45.489 | +61:47:37.40 | 2012Sep | 226 | |
| L134.20+0.75 | A | 02:28:05.671 | +61:29:25.54 | 2012Sep | 525 | |
| L189.85+0.50 | A | 06:09:19.407 | +20:39:39.18 | 2012Sep | 506 | |
| L189.94+0.34 | A | 06:08:53.761 | +20:30:07.72 | 2012Sep | 590 | |
| L206.60-16.37 | A | 05:41:47.488 | -01:57:59.97 | 2012Sep | 563 | |
| No. | Name | P.A. | Type | ||||||||||
|---|---|---|---|---|---|---|---|---|---|---|---|---|---|
| (°) | (°) | (°) | (°) | (″) | (″) | (°) | (″) | (Jy) | (Jy) | (Jy) | |||
| (1) | (2) | (3) | (4) | (5) | (6) | (7) | (8) | (9) | (10) | (11) | (12) | (13) | (14) |
| 1 | SHARC_G000.0002-00.0200 | 0.0002 | -0.0200 | 359.9995 | -0.0175 | 8 | 6 | 36 | 15 | 42.914.51 | 118.5611.11 | 100.416.94 | F |
| 2 | SHARC_G000.0006-00.0246 | 0.0006 | -0.0246 | 359.9994 | -0.0253 | 7 | 6 | 64 | 13 | 55.845.86 | 122.3811.47 | 96.416.66 | C |
| 3 | SHARC_G000.0008-00.0304 | 0.0008 | -0.0304 | 0.0002 | -0.0305 | 5 | 4 | 102 | 7 | 26.852.82 | 55.235.18 | 26.291.82 | F |
| 4 | SHARC_G000.0013-00.0784 | 0.0013 | -0.0784 | 0.0008 | -0.0780 | 5 | 4 | 142 | 7 | 13.621.43 | 23.032.17 | 12.710.89 | F |
| 5 | SHARC_G000.0065-00.0557 | 0.0065 | -0.0557 | 0.0058 | -0.0575 | 13 | 8 | 153 | 22 | 49.255.17 | 104.719.81 | 146.5710.13 | C |
| 6 | SHARC_G000.0067-00.0146 | 0.0067 | -0.0146 | 0.0052 | -0.0139 | 6 | 5 | 104 | 9 | 30.573.21 | 89.528.39 | 37.292.58 | F |
| 7 | SHARC_G000.0075-00.0199 | 0.0075 | -0.0199 | 0.0058 | -0.0208 | 11 | 6 | 67 | 17 | 68.117.15 | 162.6815.24 | 163.4611.30 | C |
| 8 | SHARC_G000.0089+00.0034 | 0.0089 | 0.0034 | 0.0092 | 0.0035 | 5 | 3 | 17 | 7.530.80 | 13.341.26 | 5.000.35 | F | |
| 9 | SHARC_G000.0120-00.0201 | 0.0120 | -0.0201 | 0.0129 | -0.0182 | 12 | 8 | 47 | 21 | 80.668.47 | 188.9317.70 | 237.9016.44 | C |
| 10 | SHARC_G000.0121-00.0513 | 0.0121 | -0.0513 | 0.0113 | -0.0511 | 9 | 7 | 34 | 17 | 60.036.30 | 121.6611.40 | 122.438.46 | C |
| 11 | SHARC_G000.0130+00.0064 | 0.0130 | 0.0064 | 0.0127 | 0.0065 | 9 | 4 | 164 | 10 | 15.161.60 | 34.253.21 | 21.751.51 | F |
| 12 | SHARC_G000.0135-00.0217 | 0.0135 | -0.0217 | 0.0156 | -0.0233 | 7 | 5 | 165 | 10 | 78.048.19 | 161.4215.12 | 102.547.09 | C |
| 13 | SHARC_G000.0142+00.0364 | 0.0142 | 0.0364 | 0.0148 | 0.0359 | 10 | 8 | 111 | 19 | 26.862.82 | 48.544.55 | 55.723.86 | F |
| 14 | SHARC_G000.0145+00.0127 | 0.0145 | 0.0127 | 0.0150 | 0.0125 | 3 | 3 | 169 | 5.000.54 | 7.710.74 | 3.050.22 | F | |
| 15 | SHARC_G000.0188+00.0040 | 0.0188 | 0.0040 | 0.0186 | 0.0072 | 7 | 5 | 20 | 11 | 26.132.75 | 59.595.58 | 39.782.75 | F |
| 16 | SHARC_G000.0195-00.0067 | 0.0195 | -0.0067 | 0.0184 | -0.0077 | 12 | 6 | 62 | 19 | 32.013.36 | 56.135.26 | 63.154.37 | F |
| 17 | SHARC_G000.0196-00.0501 | 0.0196 | -0.0501 | 0.0199 | -0.0511 | 12 | 10 | 30 | 24 | 73.007.66 | 143.6213.46 | 208.1314.38 | C |
| 18 | SHARC_G000.0197+00.0017 | 0.0197 | 0.0017 | 0.0197 | 0.0016 | 6 | 5 | 165 | 10 | 27.632.90 | 58.825.51 | 34.292.37 | F |
| 19 | SHARC_G000.0238+00.0359 | 0.0238 | 0.0359 | 0.0237 | 0.0357 | 11 | 6 | 78 | 16 | 15.411.62 | 33.583.15 | 33.122.30 | F |
| 20 | SHARC_G000.0247+00.0032 | 0.0247 | 0.0032 | 0.0252 | 0.0024 | 7 | 5 | 166 | 11 | 19.902.09 | 39.843.74 | 26.181.81 | F |
| 21 | SHARC_G000.0279-00.0533 | 0.0279 | -0.0533 | 0.0279 | -0.0538 | 7 | 6 | 14 | 13 | 29.313.08 | 79.587.46 | 55.473.84 | F |
| 22 | SHARC_G000.0281-00.0576 | 0.0281 | -0.0576 | 0.0278 | -0.0587 | 8 | 4 | 87 | 10 | 23.222.44 | 55.015.16 | 32.712.26 | F |
| 23 | SHARC_G000.0308+00.0211 | 0.0308 | 0.0211 | 0.0303 | 0.0218 | 11 | 7 | 18 | 18 | 35.873.77 | 65.866.17 | 71.754.96 | F |
| 24 | SHARC_G000.0315-00.0512 | 0.0315 | -0.0512 | 0.0304 | -0.0507 | 5 | 4 | 35 | 7 | 26.452.78 | 65.316.12 | 26.941.86 | F |
| 25 | SHARC_G000.0331+00.0054 | 0.0331 | 0.0054 | 0.0337 | 0.0061 | 8 | 4 | 90 | 8 | 15.371.62 | 15.111.43 | 16.671.16 | F |
Note. — (1) Running source number. (2) Name derived from Galactic coordinates of the maximum intensity in the object. (3), (4) Galactic coordinates of maximum intensity in the catalog object. (5), (6) Galactic coordinates of emission centroid. (7)(9) Major and minor axis 1/e widths and position angle of source. (10) Deconvolved angular size of source. (11), (12) Flux densities derived for 20 and 40 apertures. (13) Integrated flux density in the object. (14) Type of substructure: “C”compact or “F”faint, as defined in section IV.5.
(This table is available in its entirety in a machine-readable form in the online journal. A portion is shown here for guidance regarding its form and content.)
| BGPS V2.1 name | Peak emission of 350 m substructures | |||
|---|---|---|---|---|
| TotalaaTotal number of associated substructures (compact and faint) found on SHARC-II maps per each BGPS parental clump. See Section IV.5 for details. | ||||
| BGPSv2_G213.705-12.603 | 34 | 24 | 15 | 12 |
| BGPSv2_G034.256+00.154 | 27 | 18 | 15 | 8 |
| BGPSv2_G133.716+01.220 | 25 | 15 | 9 | 4 |
| BGPSv2_G000.014-00.017 | 23 | 9 | 5 | 1 |
| BGPSv2_G029.916-00.045 | 22 | 18 | 8 | 3 |
| BGPSv2_G029.958-00.017 | 19 | 13 | 6 | 4 |
| BGPSv2_G359.867-00.083 | 16 | 12 | 8 | 4 |
| BGPSv2_G081.477+00.020 | 16 | 11 | 6 | 0 |
| BGPSv2_G359.982-00.069 | 14 | 12 | 7 | 1 |
| BGPSv2_G359.946-00.045 | 14 | 5 | 1 | 0 |
| BGPSv2_G030.751-00.051 | 14 | 8 | 7 | 5 |
| BGPSv2_G081.753+00.593 | 13 | 9 | 7 | 5 |
| BGPSv2_G076.359-00.600 | 13 | 11 | 7 | 1 |
| BGPSv2_G030.786-00.025 | 13 | 12 | 11 | 3 |
| BGPSv2_G203.223+02.076 | 12 | 8 | 1 | 0 |
| BGPSv2_G192.598-00.049 | 12 | 7 | 5 | 1 |
| BGPSv2_G203.320+02.058 | 11 | 7 | 6 | 4 |
| BGPSv2_G023.437-00.183 | 11 | 5 | 2 | 1 |
| BGPSv2_G023.273-00.211 | 11 | 7 | 1 | 0 |
| BGPSv2_G081.721+00.573 | 10 | 9 | 8 | 7 |
| BGPSv2_G030.690-00.043 | 10 | 4 | 3 | 0 |
| BGPSv2_G024.493-00.039 | 10 | 7 | 6 | 3 |
| BGPS source | 1.1 mm | Convolved 350 maaFluxes were obtained from SHARC-II maps convolved to match a 33″ beam size (see Section IV.6). | Temperature | |||||
|---|---|---|---|---|---|---|---|---|
| Flux 40 | Flux 40 | |||||||
| (Jy) | (Jy) | (K) | (K) | (K) | ||||
| BGPSv2_G024.743+00.179 | 0.510.11 | 17.820.64 | 1000.0 | 23.5 | 16.7 | |||
| BGPSv2_G024.745+00.161 | 0.600.12 | 18.420.66 | 351.7 | 20.2 | 15.1 | |||
| BGPSv2_G024.757+00.091 | 1.360.12 | 61.752.19 | 1000.0 | 34.9 | 21.2 | |||
| BGPSv2_G024.759+00.065 | 0.430.09 | 8.470.38 | 33.3 | 14.2 | 11.6 | |||
| BGPSv2_G024.760+00.163 | 0.340.13 | 4.800.18 | 20.8 | 11.7 | 10.0 | |||
| BGPSv2_G024.773+00.125 | 0.220.09 | 1.670.07 | 12.9 | 8.9 | 8.0 | |||
| BGPSv2_G024.791+00.083 | 10.070.64 | 556.6519.73 | 1000.0 | 58.6 | 27.1 | |||
| BGPSv2_G024.795+00.101 | 3.140.22 | 142.574.87 | 1000.0 | 34.8 | 21.2 | |||
| BGPSv2_G024.807+00.039 | 0.320.09 | 5.840.23 | 29.1 | 13.5 | 11.2 | |||
| BGPSv2_G024.815+00.189 | 0.100.09 | -0.750.05 | ||||||
| BGPSv2_G024.817+00.129 | 0.480.09 | 6.690.27 | 20.7 | 11.6 | 9.9 | |||
| BGPSv2_G024.824+00.181 | 0.170.09 | 1.890.07 | 16.5 | 10.3 | 9.0 | |||
| BGPSv2_G024.850+00.085 | 0.900.11 | 36.601.32 | 1000.0 | 28.9 | 19.0 | |||
| BGPSv2_G024.863+00.145 | 0.160.09 | 1.080.04 | 12.2 | 8.6 | 7.7 | |||
| BGPSv2_G025.329-00.196 | 0.560.12 | 3.950.16 | 12.4 | 8.7 | 7.8 | |||
| BGPSv2_G025.339-00.170 | 0.190.12 | 0.760.04 | 9.5 | 7.3 | 6.6 | |||
| BGPSv2_G025.355-00.156 | 0.190.13 | 1.490.08 | 13.2 | 9.1 | 8.1 | |||
| BGPSv2_G025.355-00.190 | 1.460.15 | 40.941.53 | 116.1 | 18.6 | 14.2 | |||
| BGPSv2_G025.382-00.182 | 3.230.24 | 115.444.01 | 1000.0 | 24.0 | 17.0 | |||
| BGPSv2_G025.399-00.140 | 4.560.31 | 152.145.34 | 1000.0 | 22.1 | 16.1 | |||
| BGPSv2_G025.405-00.256 | 0.310.15 | 3.140.11 | 15.8 | 10.1 | 8.8 | |||
| BGPSv2_G025.413-00.176 | 0.650.12 | 17.800.64 | 98.2 | 18.2 | 14.0 | |||
| BGPSv2_G025.455-00.210 | 1.640.17 | 75.412.61 | 1000.0 | 35.9 | 21.5 | |||
| BGPSv2_G025.467-00.126 | 0.120.12 | 0.330.06 | 8.4 | 6.7 | 6.1 | |||
| BGPSv2_G025.477-00.136 | 0.100.12 | 1.730.06 | 27.0 | 13.1 | 10.9 | |||
Note. — (This table is available in its entirety in a machine-readable form in the online journal. A portion is shown here for guidance regarding its form and content.)


Appendix A Calibrators
Table 6 presents in detail the flux calibration and the observed values of at 225 GHz for each observation run. Flux conversion factors for one beam (), 20″ and 40″ aperture conversion factors on SHARC-II maps ( and ), and 40″ aperture conversion factors for SHARC-II maps convolved to a resolution of 33″ are shown in the table.
| Date | Calibrator | Cbeam | C20 | C40 | C | |
|---|---|---|---|---|---|---|
| (Jy beam) | (Jy) | (Jy) | (Jy) | |||
| 2006 Jun 11 | Mars | 0.071 | 10.86 | 0.39 | 0.31 | 0.46 |
| Mars | 0.071 | 10.15 | 0.42 | 0.30 | 0.46 | |
| Mars | 0.071 | 11.63 | 0.40 | 0.33 | 0.49 | |
| 2006 Jun 23 | Uranus | 0.061 | 8.55 | 0.28 | 0.24 | 0.36 |
| Uranus | 0.062 | 8.02 | 0.28 | 0.23 | 0.34 | |
| 2007 Jul 9 | Mars | 0.068 | 7.56 | 0.27 | 0.22 | 0.33 |
| Uranus | 0.058 | 6.55 | 0.22 | 0.18 | 0.27 | |
| Uranus | 0.068 | 7.57 | 0.25 | 0.21 | 0.31 | |
| Neptune | 0.058 | 6.76 | 0.22 | 0.19 | 0.28 | |
| Neptune | 0.064 | 6.42 | 0.21 | 0.18 | 0.27 | |
| Neptune | 0.060 | 7.18 | 0.23 | 0.20 | 0.30 | |
| 2007 Oct 24 | Uranus | 0.053 | 7.80 | 0.26 | 0.22 | 0.32 |
| Uranus | 0.053 | 8.02 | 0.27 | 0.23 | 0.34 | |
| Neptune | 0.055 | 9.29 | 0.31 | 0.26 | 0.39 | |
| Neptune | 0.055 | 9.20 | 0.30 | 0.26 | 0.38 | |
| 2007 Oct 27 | Uranus | 0.052 | 7.18 | 0.23 | 0.20 | 0.30 |
| Uranus | 0.047 | 7.80 | 0.25 | 0.22 | 0.33 | |
| Uranus | 0.047 | 7.29 | 0.24 | 0.20 | 0.30 | |
| 2009 Sep 10 | Uranus | 0.055 | 5.80 | 0.19 | 0.16 | 0.24 |
| Mars | 0.062 | 6.31 | 0.23 | 0.18 | 0.27 | |
| 2009 Dec 13 | Uranus | 0.050 | 6.34 | 0.22 | 0.18 | 0.26 |
| Uranus | 0.050 | 6.13 | 0.23 | 0.18 | 0.26 | |
| Mars | 0.065 | 5.73 | 0.20 | 0.17 | 0.24 | |
| Mars | 0.065 | 5.67 | 0.20 | 0.16 | 0.24 | |
| 2009 Dec 14 | Uranus | 0.068 | 6.01 | 0.22 | 0.17 | 0.25 |
| Mars | 0.058 | 5.28 | 0.22 | 0.16 | 0.24 | |
| 2009 Dec 29 | Uranus | 0.060 | 5.84 | 0.20 | 0.16 | 0.24 |
| Uranus | 0.052 | 5.85 | 0.19 | 0.16 | 0.24 | |
| Mars | 0.062 | 5.72 | 0.22 | 0.17 | 0.26 | |
| Mars | 0.062 | 5.78 | 0.22 | 0.17 | 0.26 | |
| Mars | 0.056 | 5.80 | 0.22 | 0.17 | 0.26 | |
| 2009 Dec 30 | Uranus | 0.050 | 7.06 | 0.24 | 0.19 | 0.28 |
| Uranus | 0.051 | 7.08 | 0.24 | 0.19 | 0.28 | |
| Mars | 0.047 | 5.70 | 0.22 | 0.17 | 0.25 | |
| Mars | 0.052 | 5.68 | 0.22 | 0.17 | 0.25 | |
| Mars | 0.040 | 5.66 | 0.22 | 0.17 | 0.25 | |
| Mars | 0.040 | 5.81 | 0.24 | 0.18 | 0.26 | |
| 2009 Dec 31 | Uranus | 0.051 | 6.43 | 0.22 | 0.18 | 0.27 |
| Uranus | 0.049 | 6.32 | 0.22 | 0.18 | 0.26 | |
| Uranus | 0.050 | 6.26 | 0.22 | 0.18 | 0.27 | |
| Mars | 0.048 | 4.87 | 0.19 | 0.15 | 0.22 | |
| Mars | 0.048 | 4.79 | 0.20 | 0.15 | 0.22 | |
| 2010 Jan 01 | Mars | 0.045 | 5.69 | 0.22 | 0.17 | 0.25 |
| 2010 Jul 24 | Neptune | 0.063 | 19.30 | 0.61 | 0.54 | 0.80 |
| Uranus | 0.070 | 26.18 | 0.87 | 0.72 | 1.07 | |
| Uranus | 0.075 | 18.00 | 0.76 | 0.52 | 0.81 | |
| Uranus | 0.056 | 11.68 | 0.58 | 0.36 | 0.55 | |
| Uranus | 0.065 | 13.98 | 0.55 | 0.39 | 0.61 | |
| 2010 Jul 25 | Neptune | 0.077 | 9.63 | 0.32 | 0.27 | 0.41 |
| Uranus | 0.042 | 6.09 | 0.20 | 0.17 | 0.25 | |
| Uranus | 0.039 | 5.79 | 0.19 | 0.16 | 0.24 | |
| Uranus | 0.046 | 7.12 | 0.25 | 0.20 | 0.30 | |
| 2010 Jul 28 | Neptune | 0.056 | 6.76 | 0.21 | 0.19 | 0.28 |
| Uranus | 0.056 | 6.57 | 0.25 | 0.18 | 0.27 | |
| Uranus | 0.046 | 6.37 | 0.20 | 0.18 | 0.26 | |
| 2010 Jul 31 | Neptune | 0.050 | 8.58 | 0.28 | 0.23 | 0.35 |
| Neptune | 0.050 | 7.71 | 0.26 | 0.21 | 0.32 | |
| Neptune | 0.050 | 7.82 | 0.27 | 0.22 | 0.33 | |
| Neptune | 0.050 | 8.22 | 0.27 | 0.23 | 0.34 | |
| Uranus | 0.058 | 6.67 | 0.23 | 0.19 | 0.28 | |
| 2010 Aug 01 | Neptune | 0.036 | 7.42 | 0.24 | 0.20 | 0.30 |
| Neptune | 0.060 | 7.67 | 0.25 | 0.21 | 0.31 | |
| Neptune | 0.050 | 7.46 | 0.25 | 0.20 | 0.30 | |
| Uranus | 0.053 | 7.06 | 0.24 | 0.19 | 0.29 | |
| 2010 Dec 05 | Uranus | 0.060 | 5.75 | 0.20 | 0.17 | 0.24 |
| Uranus | 0.030 | 5.96 | 0.21 | 0.17 | 0.25 | |
| Uranus | 0.030 | 6.66 | 0.23 | 0.19 | 0.27 | |
| Uranus | 0.040 | 6.38 | 0.21 | 0.18 | 0.26 | |
| 2010 Dec 06 | Uranus | 0.030 | 7.07 | 0.25 | 0.19 | 0.29 |
| Uranus | 0.050 | 7.07 | 0.26 | 0.20 | 0.30 | |
| Uranus | 0.038 | 7.26 | 0.24 | 0.19 | 0.30 | |
| Uranus | 0.038 | 7.04 | 0.25 | 0.19 | 0.29 | |
| Uranus | 0.068 | 6.78 | 0.26 | 0.19 | 0.29 | |
| Uranus | 0.049 | 6.93 | 0.23 | 0.19 | 0.28 | |
| 2011 Dec 23 | Uranus | 0.036 | 11.35 | 0.38 | 0.32 | 0.49 |
| Uranus | 0.071 | 10.06 | 0.37 | 0.29 | 0.43 | |
| Uranus | 0.070 | 11.06 | 0.38 | 0.31 | 0.45 | |
| 2012 Sep 14 | Uranus | 0.050 | 12.73 | 0.42 | 0.35 | 0.52 |
| Uranus | 0.057 | 12.88 | 0.44 | 0.36 | 0.53 | |
| Uranus | 0.057 | 12.60 | 0.42 | 0.35 | 0.52 | |
| Uranus | 0.062 | 17.32 | 0.57 | 0.47 | 0.70 | |
| Uranus | 0.065 | 17.37 | 0.59 | 0.48 | 0.72 | |
| 2012 Sep 21 | Uranus | 0.070 | 17.47 | 0.56 | 0.49 | 0.73 |
| Uranus | 0.094 | 17.79 | 0.57 | 0.50 | 0.74 | |
| Uranus | 0.094 | 16.58 | 0.55 | 0.47 | 0.70 |
Appendix B SHARC-II maps
We present in Figure 25 our complete sample of 107 regions mapped with SHARC-II. For each of them, the image shows grey scale maps with emission contours at 3, 6, 10, 15, 30, 50, and 100, with the rms noise. The value of in units of mJy beam-1 is stated below each map. The image also shows the high-resolution sources extracted with Bolocat. Red contours represent sources with signal-to-noise values above 10 (compact sources), and blue contours sources below this limit (faint sources).


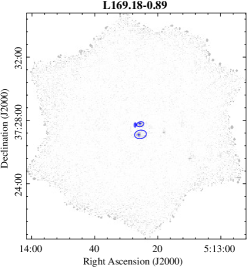
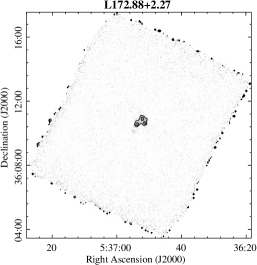
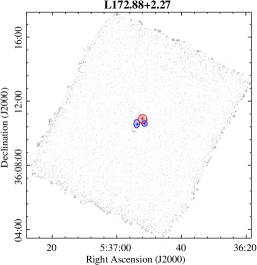
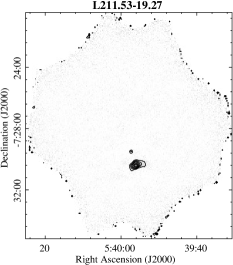
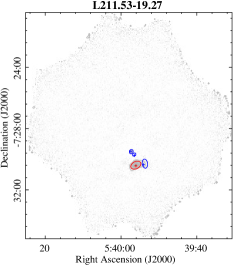
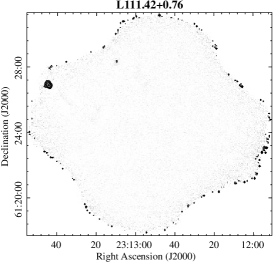
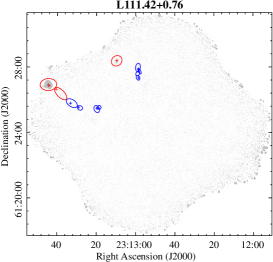
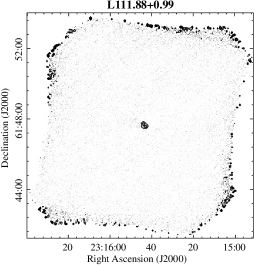
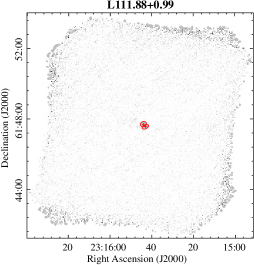
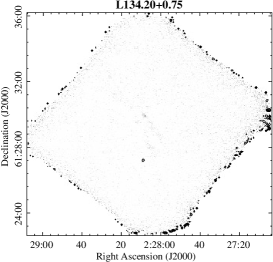
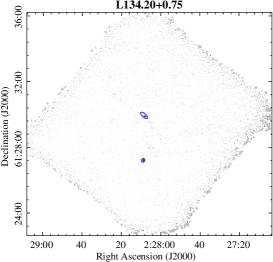
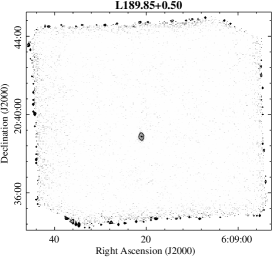
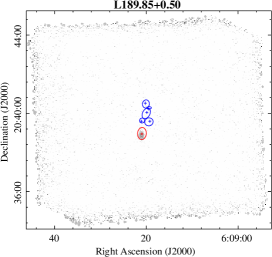
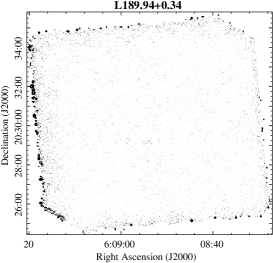
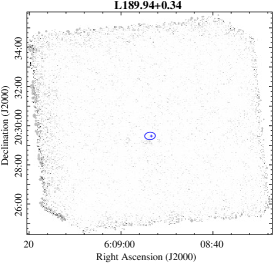
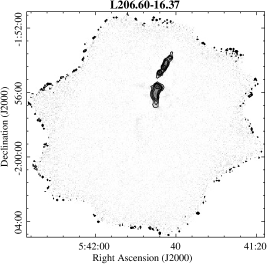
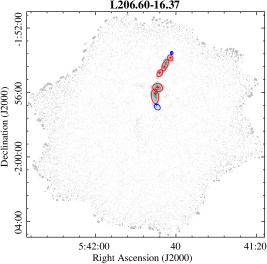
Appendix C Hi-Gal SPIRE images at 350 m for
In this section we indicate the locations of the high-resolution sources identified in the 350 m SHARC-II maps (8.5″beam size) toward , and their comparison with structures observed at lower resolution (24.9″) in the corresponding Herschel/SPIRE maps at the same wavelength and BGPS maps at 1.1 mm at a resolution of 33″. Figure 26 shows 1.1 mm continuum gray scale maps with green contours representing sources from the BGPS catalog, and Herschel grey scale maps with contours representing the emission at 10, and increasing steps of 5, with =164 MJy sr-1. The thick black line on each map represent the area covered by the SHARC-II maps, with the name of those maps indicated for each region. Peak positions of detected high-resolution sources from SHARC-II maps are overlaid in red and blue crosses, representing sources with signal-to-noise above and below a value of 10, respectively. Most sources with high signal-to-noise are well associated with strong emission in the Herschel maps, but several of the low signal-to-noise sources are not individually identified and they are part of extended background emission detected in Herschel maps but not recovered in SHARC-II maps.
