A search for H emission in high-metallicity damped Lyman- systems at
Abstract
We report on a sensitive search for redshifted H line-emission from three high-metallicity damped Ly absorbers (DLAs) at with the Near-infrared Integral Field Spectrometer (NIFS) on the Gemini-North telescope, assisted by the ALTtitude conjugate Adaptive optics for the InfraRed (ALTAIR) system with a laser guide star. Within the NIFS field-of-view, corresponding to kpc kpc at , we detect no statistically significant line-emission at the expected redshifted H wavelengths. The measured root-mean-square noise fluctuations in apertures are erg s-1 cm-2. Our analysis of simulated, compact, line-emitting sources yields stringent limits on the star-formation rates (SFRs) of the three DLAs, M⊙ yr-1 () for two absorbers, and M⊙ yr-1 () for the third, at all impact parameters within kpc to the quasar sightline at the DLA redshift. For the third absorber, the SFR limit is M⊙ yr-1 for locations away from the quasar sightline. These results demonstrate the potential of adaptive optics-assisted, integral field unit searches for galaxies associated with high- DLAs.
keywords:
quasars: absorption lines – galaxies: high redshift – quasars: individual: Q0201+365 – quasars: individual: Q0311+430 – quasars: individual: Q2343+1251 Introduction
The damped Ly systems (DLAs; Wolfe et al., 1986, 2005) define the class of absorption-line systems discovered in the rest-frame UV spectra of distant quasars, with H I column densities as measured from the analysis of damping wings in the Ly profile. These large values, characteristic of gas in the interstellar medium of modern, star-forming galaxies (e.g. Walter et al., 2008), have led researchers to associate high- DLAs with young galaxies in the early Universe. This association is well supported by theoretical models of galaxy formation (e.g. Haehnelt et al., 1998; Maller et al., 2001; Bird et al., 2014) and recent numerical simulations that predict large H I surface densities extending out to tens of kpc from active, star-forming regions (e.g. Rahmati et al., 2013; Fumagalli et al., 2014a) and even to distances of kpc from the centres of the most massive halos (Pontzen et al., 2008). Further empirical evidence connecting high- DLAs to galaxies includes the omnipresence of heavy elements in the gas typically at levels exceeding estimates for the intergalactic medium which indicates previous, if not recent, pollution by stars (e.g. Pettini et al., 1994, 1997; Prochaska et al., 2003; Penprase et al., 2010; Rafelski et al., 2012). At low redshifts, where one may more sensitively search for associated galaxies, several studies have identified galaxy counterparts to the absorbers (e.g. le Brun et al., 1997; Rao et al., 2003; Chen et al., 2005).
Detailed analysis of DLA absorption lines offer unparalleled insight into the interstellar medium (ISM) of these galaxies, including their chemical abundance patterns, gas temperature, molecular content, dust depletion, and kinematics (e.g. Pettini et al., 1997; Prochaska & Wolfe, 1997; Kanekar & Chengalur, 2003; Ledoux et al., 2003; Dessauges-Zavadsky et al., 2006; Noterdaeme et al., 2008; Kanekar et al., 2014). Indeed, DLA studies provided the first and (still) the most comprehensive view of the ISM at high redshifts. To properly place this wealth of ISM measurements within galaxy formation theories, however, it is critical to connect the gas to the stars and to the processes of star formation. Establishing this connection directly by observing the stars and/or H II regions, however, has proven to be remarkably challenging.
Early works searched first for Ly emission, both in the core of the H I Ly absorption profile and with narrow-band imaging or, more recently, with integral field spectroscopy (e.g. Smith et al., 1989; Hunstead et al., 1990; Wolfe et al., 1992; Møller & Warren, 1993; Kulkarni et al., 2006; Christensen et al., 2007). These provided a few rare detections (e.g. Djorgovski et al., 1996; Fynbo et al., 1999; Møller et al., 2004) and mostly upper limits to the star-formation rates (SFRs), , albeit subject to substantial systematic uncertainties related to dust depletion and Ly radiative transfer. The community then searched sensitively for far-UV continuum emission in broad-band imaging, applying the Lyman-break technique when possible to pre-select candidates at high redshifts (e.g. Møller & Warren, 1993; Warren et al., 2001; Prochaska et al., 2002); these surveys were largely unsuccessful, with only a few positive detections. This implied inherently faint ultraviolet emission and/or that the absorbing galaxies were drowned out by the glare of the background quasar. More recently, Fumagalli et al. (2010) introduced a novel technique to address the problem of detecting a faint DLA close to a bright quasar, using a high- absorption system at a redshift close to that of the background quasar to “block” its far-ultraviolet light, thus allowing a sensitive search for emission from a second, lower-redshift DLA along the sightline. Unfortunately, even this technique has so far yielded null results, albeit yielding more stringent constraints, SFR at all impact parameters (Fumagalli et al., 2014b, 2015).
| QSO | RA (J2000) | DEC (J2000) | [Z/H]∗ | References | |||
|---|---|---|---|---|---|---|---|
| QSO0201+365 | 02:04:55.60 | +36:49:18 | 2.912 | 2.4628 | 20.38 | 1, 2 | |
| QSO0311+430 | 03:14:43.60 | +43:14:05.1 | 2.870 | 2.2898 | 20.30 | 3, 4, 5 | |
| QSO2343+125 | 23:46:28.22 | +12:48:59.9 | 2.763 | 2.4313 | 20.34 | 6, 7, 8 |
Notes to the table:
∗ The metallicity estimates are based on [Zn/H] (QSO0201+365)
and [Si/H] (QSO0311+430 and QSO2343+125).
† The metallicity of the DLA towards QSO2343+125
is from the HIRES spectrum of Lu
et al. (1998). We have re-analysed these
data and obtain a slightly higher, albeit consistent, metallicity of
[Si/H]. We note that Ledoux et al. (2006) obtained
a lower metallicity from the Znii lines, [Zn/H],
while Dessauges-Zavadsky et al. (2004) used Sii lines to obtain
[S/H] (consistent with the metallicity estimate
of Lu
et al. (1998)).
References: (1) Prochaska &
Wolfe, 1996; (2) Prochaska
et al., 2001;
(3) York et al., 2007; (4) Ellison et al., 2008; (5) Kanekar et al., 2014;
(6) Lu
et al., 1998; (7) Dessauges-Zavadsky et al., 2004; (8) Prochaska et al., 2007.
Somewhat stymied, the community has made two changes in the observational strategy: (1) focus the effort on the most heavily enriched DLAs under the expectation that these will be associated with brighter galaxies having higher SFRs and/or larger stellar masses (e.g. Møller et al., 2004; Ledoux et al., 2006), and (2) search for the strong nebular emission lines associated with H II regions (e.g. O III, H). Earlier studies using the latter approach yielded relatively weak upper limits on the SFRs of DLAs, at (e.g. Bechtold et al., 1998; Mannucci et al., 1998; Bunker et al., 1999; Kulkarni et al., 2000, when converted to the LCDM cosmology used in this paper). However, this method has recently been significantly advanced by technical progress, i.e. the commissioning of higher throughput near-infrared (near-IR) spectrometers on large-aperture telescopes. Several of these include integral field units (IFUs) which permit a “blind” search for emission in a modest field around each DLA. These new efforts, mostly with the Very Large Telescope (VLT), have met with somewhat greater success: counterparts to DLAs at have recently been discovered, at impact parameters from the quasar sightlines in the range kpc111Throughout this paper, we will use a flat -cold dark matter cosmology, with , and H km s-1 Mpc-1 (Planck Collaboration, 2013)., and with SFRs (e.g. Fynbo et al., 2010; Fynbo et al., 2011, 2013; Péroux et al., 2011, 2012; Noterdaeme et al., 2012). There have also been a few recent detections of Ly emission in the trough of the DLA Ly absorption line (e.g. Møller et al., 2004; Hennawi et al., 2009; Kulkarni et al., 2012; Krogager et al., 2012; Noterdaeme et al., 2014).
One is scientifically motivated to search for star-formation from DLAs for several reasons beyond mere studies of this absorber population. In contrast to the multitude of surveys of star-forming galaxies at (e.g. Daddi et al., 2004; Erb et al., 2006; Förster Schreiber et al., 2009), one may link the gas directly to the stars and star-forming regions in these young galaxies. For H I in particular, absorption-line analysis represents the only means for assessing the surface density of gas around these galaxies and thereby an estimate of the gaseous extent.
Studies of the star-forming regions of DLAs also offer a complementary assessment of emerging trends in galaxies between stellar mass , metallicity and star-formation rate. Large spectroscopic surveys have revealed that star-forming galaxies follow a relatively tight main sequence, in which the SFR correlates with the stellar mass (e.g. Noeske et al., 2007; Daddi et al., 2007; Rodighiero et al., 2011). This has inspired a series of simple models of galaxy formation within the CDM framework that consider the balance of gas accretion, star formation, and the outflow of material by feedback processes (e.g. Dekel et al., 2009; Lilly et al., 2013; Forbes et al., 2014). Observers have also explored second-order relations in the galaxy properties, emphasizing the existence of a fundamental metallicity relation (FMR) where the SFR is systematically higher in lower metallicity galaxies at a fixed mass (Mannucci et al., 2010; Bothwell et al., 2013; Stott et al., 2013). With the DLAs, one may examine whether absorption-selected galaxies follow the same trends as these traditional samples. In addition, one may further test the simple models by incorporating the ISM properties constrained directly by DLA observations (e.g. H I extent, ISM metallicity, star formation history, gas temperature, etc).
In this manuscript, we report on our own project to search for H emission from high- DLAs with the Near-infrared Integral Field Spectrometer (NIFS; McGregor et al., 2003) on the Gemini-North telescope. We pre-selected a set of DLAs with high metallicity and with absorption redshifts well-suited to the detection of nebular emission lines (e.g. strong sky lines were avoided). In addition, we used the ALTtitude conjugate Adaptive optics for the InfraRed (ALTAIR) with a laser guide star to isolate the light of the background quasar and maximize the signal from these (presumably) small galaxies. We note red that Jorgenson & Wolfe (2014) also employed a similar approach, with laser-guided adaptive optics and an IFU with the Keck I telescope to analyze a previously known galaxy counterpart to a DLA with [O III] and H emission.
2 Observations and Data Reduction
From the set of known DLAs at in 2007, with accurately measured metallicities (e.g. Ledoux et al., 2006; Prochaska et al., 2007), we considered all systems with enrichment exceeding solar abundance. We further restricted this set to have good visibility from Mauna Kea and chose five systems with absorption redshifts that placed their H lines at favorable wavelengths for deep, near-IR spectroscopy (i.e. avoiding bright sky lines and strong telluric absorption). Unfortunately, two of the DLAs were observed with incorrect wavelength settings, so we were left with three absorbers; Table 1 summarizes their properties.
We used NIFS on Gemini-North to search for redshifted H emission from the three DLAs in 2008, with ALTAIR and laser guide stars to improve the point spread function (PSF). Nearby stars or the QSO itself were used for the tip-tilt mode correction in the laser guiding. The data were acquired in queue-observing mode during semester 2008B under Program ID GN-2008B-Q-61. The observing conditions were photometric with natural seeing better than in the optical -band as measured by the ALTAIR wave-front sensor.
We used the grating to search for H emission from the three DLAs at . For each target, the observing band covered a wavelength range of approximately 4000 Å, centered at the expected DLA H wavelength (see Table 2). The NIFS field-of-view is approximately on a side, corresponding to kpc at . Each exposure was set to 560 seconds, a compromise between minimizing the effects of instrumental flexure and read-out noise. The exposures were dithered along R.A. and Dec. with offsets to obtain better estimates of the sky background. This offset was chosen to match the expected PSF of . However, the actually achieved PSF is worse than this (see below), leading to a less optimal sky subtraction for slightly extended objects. We did not take off-target exposures to independently measure the sky background. A0V stars at similar airmass were observed immediately before and/or after the target observations with an identical instrumental setup to estimate telluric absorption and to perform flux calibration. Images of Ar and Xe arc lamps were obtained to provide wavelength calibration.
| Field | Date (UT) | (m) | Telluric Stars | (sec) | Magtt | |
|---|---|---|---|---|---|---|
| QSO2343+125 | 2008 Oct 4 | 2.2519 | HD 21501 | 4480 | ||
| QSO0201+365 | 2008 Oct 7 | 2.2726 | HD 1561, HD 21038 | 5600 | ||
| QSO0311+430 | 2008 Oct 7 | 2.1590 | HD 12559 | 2800 |
Magtt and are the magnitudes of the tip-tilt guide stars and their angular distances to the targets, respectively.
The data were reduced with our own programmes written in the Interactive Data Language environment. The images were first dark subtracted and flattened; Figure 1a shows an example of one processed frame. As is evident from the figure, the NIFS lenslets project spectra onto the detector with different wavelength zeropoints. To begin sky subtraction, we first registered the sky lines by applying a rigid pixel offset to each row derived from a 1-D cross-correlation, after a re-sampling in the spectral dimension. Because the re-sampled spectral pixels have a size of 1.03 Å, this rigid pixel offset does not introduce a wavelength error larger than Å.
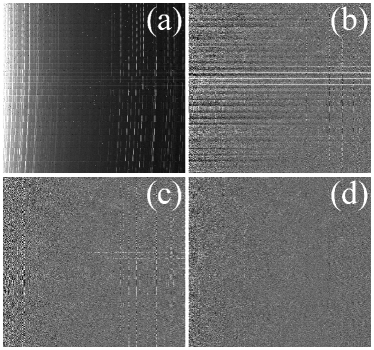
After the rows of spectra were aligned, a constant sky background was subtracted column by column (Figure 1b). At this stage, this simple sky-subtraction was sufficient to allow detection of the QSOs over the entire spectral range, in each 560s exposure. The original NIFS 2-D images have a spatial pixel size of and spectral pixel sizes of Å. The images were reformatted and re-sampled into 3-D cubes of Å pixel sizes. The cubes were collapsed along the spectral axes to form continuum images of the QSOs (Figure 2, top panels). Centroids of the quasar emission were used to derive dither offsets for the multiple exposures with a precision that is much smaller than the pixel size. We also estimated the PSF provided by the ALTAIR adaptive optics (AO) system to lie in the range (full width at half maximum; FWHM).
To sensitively search for the DLA H emission, one requires a much higher fidelity approach to sky subtraction and cosmic ray removal. Figure 1b shows obvious residuals at the brightest sky lines and also “ripples” in the spatial dimension that we associate with spatial variations in the sky background and/or non-uniformities in the lenslets that have not been captured by the flat-fielding procedure. We also wished to search sensitively for H emission close to, or even at, the position of each QSO. Therefore, we fitted a 5th or 6th-order polynomial, column by column and then row-by-row, to each NIFS 2D image and subtracted the fitted values. Figure 1c shows a resultant image. This procedure is designed to remove slowly varying flux fluctuations related to the background and the QSO without eliminating narrow features such as emission lines and cosmic rays. For the latter, we flagged all pixels with fluxes above the background and verified (by eye) that none of these could be consistent with an emission feature. Lastly, we median-combined the five to ten dithered images without alignment to generate a final residual map of the sky background including the effects of “hot” pixels. This residual map was subtracted from each image (e.g. Figure 1d) and these images were reformatted to 3-D cubes. The dithered cubes of each target were then aligned and combined with sigma-clipping to form the final data cube for each field.
The spectral images of the Ar/Xe arc lamps and the A0V stars were processed separately. Sky-subtraction was not carried out here since the sources are much brighter than the structure in the sky background. The extracted Ar/Xe spectra were used to derive wavelength solutions, accurate to Å over the observed spectral ranges, which is sufficient for our science. The extracted A0V spectra were used to derive telluric absorptions and perform flux calibration. First, we masked the 2.166 m hydrogen absorption lines on the A0V spectra and interpolated over the masked regions in the continua. The spectra were then compared with the model spectrum of Vega (Kurucz, 1979) to derive the telluric absorptions as a function of wavelength. Absorption corrections of were applied to both the data cubes of the targets and the A0V spectra. Finally, the absolute flux calibrations were estimated with the 2MASS fluxes of the A0V stars and their observed spectral fluxes in the 2MASS passband ( m). The flux zero points derived from the four A0V stars under three different spectral settings agree very well with each other (to within ), suggesting that our flux calibration is accurate to within 5%.
3 Results

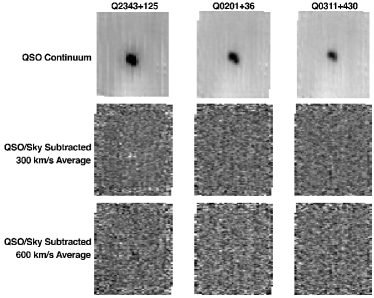
The final reduced images are shown in Figure 2. Each panel is in size, corresponding to approximately kpc kpc at . The top row shows the stacked QSO continuum images from an intermediate stage before processing (see 2). Here, the sky subtraction is very simple and residual sky structures are apparent. In the case of QSO0201+365 and QSO0311+430, the tip-tilt guide stars are quite far away from the QSO and we only obtained partially corrected PSFs from ALTAIR. The measured PSF FWHMs are for QSO2343+125, for QSO0201+365, and for QSO0311+430. These are all much better than the natural seeing but worse than what ALTAIR can achieve in the best cases (). The asymmetric PSFs are likely to arise from the laser-guided AO performance, as the self-guided observations of the A0V stars do not show such asymmetry.
The middle row of the figure shows stacked images spanning 10 spectral pixels (corresponding to km s-1) centered at the expected redshifted H wavelength for each DLA, after further subtraction of the QSO and sky background (see 2). Both the QSO and the sky were cleanly subtracted across the images, enabling the search for faint H emission even along the sightline to each QSO. There is no evidence of significant H emission in any of the three DLAs. We also carefully searched the 3-D image cubes over a broader wavelength range, in images before and after cosmic ray removal, and in individual unstacked exposures. We found no evidence for emission in any of these cases. To search for very broad emission, we also created images averaged over 22 spectral pixels (corresponding to km s-1, bottom row of Figure 2); no emission was detected at this coarser resolution. For the discussion below, we will assume a line width of km s-1, i.e. we will use the images of the middle row in Fig. 2.
During the data reduction process, we median-combined the dithered exposures to form residual images for better sky subtraction, using dither offsets between exposures of . This means that the DLA H emission might be partially subtracted if it is smooth and extended over angular scales of . We did not see any hint of such extended emission in the images before the median sky subtraction, nor in the median-combined sky image. Furthermore, such spatially-extended, but spectrally-narrow, emission (extended over kpc at ) appears unlikely (e.g. Fynbo et al., 2011). We conclude that the three DLAs of our sample do not produce strong H emission within kpc of the QSO sightline.
We used the non-detections of H emission to estimate upper limits to the H flux from each DLA. We measured the background flux fluctuations in the 300 km s-1 images shown in the middle row of Figure 2 in square apertures across each image. The size is larger than the PSF FWHM in all three images, and corresponds to 3.3 kpc at . Figure 3 shows a histogram of these fluxes, as well as results for other aperture sizes. The measured root-mean-square (RMS) noise fluctuations in apertures are erg s-1 cm-2, erg s-1 cm-2, and erg s-1 cm-2, in the images for QSO2343+125, QSO0201+365, and QSO0311+430, respectively (see Figure 3). The above values can be converted to limits on the SFR via the expression M⊙ yr-1 (erg s-1)-1 (Kennicutt, 1998), where a Salpeter initial mass function is assumed. The results are SFR limits of M⊙ yr-1, M⊙ yr-1, and M⊙ yr-1, for QSO2343+125, QSO0201+365, and QSO0311+430, respectively. For a line width of 600 km s-1, the RMS noise and the SFR limits increase approximately by a factor of .
Our relatively small dither offsets () and the non-ideal PSFs lead to 20%–30% (depending on the source size and PSF) flux losses in the median sky subtraction. As a result, the sensitivity to H line emission is somewhat worse than the typically quoted upper limits based on the above error estimates. In order to better understand the systematics arising from our observing and data analysis procedure, and to obtain reliable constraints on the SFRs, we created artificial line emitting sources in each of the raw images of our target sources and processed these images identically to the actual images. We assumed intrinsically extended emitters with various sizes of Gaussians of up to FWHM. We then convolved the source images with the PSF derived from the QSO images. The sources were conservatively assumed to have flat velocity profiles over Å. ( km sec-1) and were randomly placed in the raw images with a range of fluxes. We consider a simulated source as recovered if it passes our inspection and its flux is detected at significance. We found that we confidently recover the simulated sources in our reduction when the input flux is times larger than the formal RMS noise. This is consistent with the above-mentioned 20%–30% flux loss caused by the broad PSF. We thus regard this as a confidence detection limit. Note that this is true even when the simulated sources have very small impact parameters to the QSO sightline, except for the case of QSO2343+125. QSO2343+125 has broad emission lines in our observed spectral cube, making our quasar subtraction slightly poorer. In this case, we can only detect the simulated line source along the QSO sightline when it has significance. We therefore conclude that our observations constrain the star formation rates to SFR M⊙ yr-1 at all impact parameters for the DLAs toward QSO0201+365 and QSO0311+430, and SFR M⊙ yr-1 at separations for the DLA towards QSO2343+125, with a poorer limit of SFR M⊙ yr-1 close to the QSO for the last system. We note that all of these limits ignore dust obscuration beyond the modest correction associated with the empirical relation of Kennicutt (1998). Our observations would thus underestimate the SFR limits in the case of modest amount of extinction, and would be insensitive to dusty star-forming regions, for which the H line emission might be highly obscured.
4 Discussion
The primary aim of searches for line emission from high- DLAs is the direct identification of their galaxy counterparts, so as to estimate the typical size, mass and SFR of absorption-selected galaxies. Non-detections of H emission only allow us to place limits on the SFR, assuming that the emission region of the DLA host lies within the search area. In addition, however, there has been much recent interest in whether high- absorption-selected galaxies also have a mass-metallicity relation similar to that seen in high- emission-selected galaxies (e.g. Tremonti et al., 2004; Erb et al., 2006). The existence of such a relation in DLAs is suggested by the correlations found between DLA metallicity and both the velocity width of low-ionization metal lines (Wolfe & Prochaska, 1998; Ledoux et al., 2006; Neeleman et al., 2013) and the rest equivalent width of the Si II1526 line (Prochaska et al., 2008). Similarly, the anti-correlation detected between DLA metallicity and gas spin temperature (Kanekar et al., 2009; Ellison et al., 2012; Kanekar et al., 2014) also supports such a mass-metallicity relation, as higher mass DLAs are expected to have larger fractions of cold gas and hence, lower spin temperatures (Kanekar & Chengalur, 2001). To this end, even non-detections of H emission in high-metallicity DLAs are of much interest, as these may argue against the existence of a mass-metallicity relation in DLAs given the star-forming main sequence of galaxies (e.g. Daddi et al., 2007).
Before we consider the repercussions of our results, we briefly discuss other recent searches for line emission from high- DLAs. There have been two broad strategies that have been successful in either detecting, or placing strong constraints on, Ly, H, O II or O III line emission. (1) Fynbo et al. (2010) pioneered an approach based on using VLT X-shooter slit spectroscopy, covering a large wavelength range ( Å m) to simultaneously search for a number of lines, and using 3 slit position angles centred on the QSO location (see also Fynbo et al., 2011; Krogager et al., 2012; Fynbo et al., 2013). (2) Conversely, Péroux et al. (2011) used IFU spectroscopy with the Spectrograph for Integral Field Observations in the Near-Infrared (SINFONI) onboard the VLT to search for redshifted H emission, similar to our approach (see also Bouché et al., 2012; Péroux et al., 2012). Fynbo et al. also targeted high-metallicity DLAs at , while Peroux et al. and Bouche et al. targeted DLAs, sub-DLAs and strong Mg II absorbers of all metallicities, centred at two redshifts, and .
There are pros and cons to the two literature approaches, as well as to our own approach. The X-shooter-based strategy of Fynbo et al. (2010) has the advantage that a number of lines are simultaneously targeted, implying fewer problems due to night sky lines and sky subtraction. Also, the use of 3 slit angles reduces the likelihood that the DLA might be missed by the slit. However, the likelihood of missing the DLA increases with distance from the QSO location (as the slits are centred on the QSO), implying a bias towards absorbers at low impact parameter, .
The VLT-SINFONI IFU searches for H emission by Péroux et al. (2012) and Bouché et al. (2012) have the advantage of being sensitive to H emission from a relatively large area (field of view arcsec2) around the QSO sightline. However, AO was used (with nearby guide stars) for only a few DLAs and even these only yielded a seeing . The relatively poor seeing and the degradation in the signal-to-noise ratio at the QSO location (due to the higher background) implies that the sensitivity of such searches is lower close to the QSO. Non-detections of H emission might hence arise at low impact parameters, (although see Bouché et al., 2012).
In the case of our own search, the use of AO implies excellent seeing and high sensitivity to H emission even at the QSO location for two of the targets, and reasonable sensitivity for the third target. However, the relatively small NIFS field of view implies that we are only sensitive to emission for impact parameters kpc. Thus, H emission from large disks (of radius kpc), where the Ly absorption occurs in the outskirts of the galaxy while the H emission is dominated by the central region might be missed in our search. Note that all three DLAs of our sample have relatively low Hi column densities, , as might be expected in the outer regions of a galaxy.
Moving to detections, and focusing on DLAs at (i.e. excluding low- DLAs and Mg II absorbers without estimates), the X-shooter method has led to the detection of line emission from five high-metallicity DLAs at (Fynbo et al., 2010; Krogager et al., 2012; Fynbo et al., 2013). Non-detections from this approach have so far not been reported. Perhaps unsurprisingly, four of the five detections (see Krogager et al., 2012) have been at relatively low impact parameters, .
In the case of VLT-SINFONI IFU spectroscopy, Péroux et al. (2012) report only a single detection of H emission in 10 DLAs and 2 sub-DLAs at . Further, even the sole DLA of their sample with a detection of H emission (at towards J22220946) had earlier been detected in H, Ly O II and O III lines in X-shooter spectroscopy (Fynbo et al., 2010). This system also has an intermediate impact parameter, , larger than the seeing during the VLT-SINFONI observations (; Péroux et al., 2012). Note that only two DLAs of the Péroux et al. (2012) sample are “high-metallicity” systems, with [Z/H] ; one of these is the absorber towards J22220946, while the other, at towards QSO20590528, yielded an H non-detection, with an upper limit to the SFR, .222Note that different authors have used different spatial and spectral resolutions, as well as significances, when quoting upper limits. Here, we adjusted their values to a fiducial significance and have converted to the same H calibration adopted here. Differences between the adopted cosmologies have negligible impact on the results.
Bouché et al. (2012) also used VLT-SINFONI to search for H emission in a set of absorbers at , selected either due to strong Mg II absorption or due to identification as DLAs or sub-DLAs. We will here only consider the subset of 10 absorbers, 5 DLAs and 5 sub-DLAs, with estimates. These yielded two detections of H emission, one system again being the ubiquitous DLA towards J22220946. The sole other detection was in the DLA towards HE22436031, an intermediate metallicity absorber ([Zn/H] ; Lopez et al., 2002), detected at a large impact parameter, kpc, with an SFR of (see also Bouché et al., 2013). The seven non-detections yielded typical SFR limits of .
Finally, our own search in three DLAs yielded no H detections, with strong SFR constraints of within a distance of 12.5 kpc to the QSO sightline (excepting the QSO location in one field). All three DLAs have high metallicities, [Z/H] , within the top 10% of DLAs at all redshifts (e.g. Rafelski et al., 2012).
It thus appears that, despite a number of studies with 8m-class telescopes, there have been very few IFU detections of H emission in DLAs at . Specifically, combining our results with those of Péroux et al. (2012) and Bouché et al. (2012), there has been only a single “new” detection of H emission, and a corresponding identification of a galaxy counterpart, and 21 non-detections from IFU searches. Conversely, there have been five identifications of galaxy counterparts via the X-shooter slit spectroscopy approach (Fynbo et al., 2010; Fynbo et al., 2011; Krogager et al., 2012). The target DLA samples of the two types of searches have been very different, with the IFU searches mostly targeting low-metallicity DLAs (18/22) and the X-shooter spectroscopy focusing on high-metallicity DLAs. This suggests that high-metallicity DLAs have higher SFRs, as would be expected from a mass-metallicity relation in DLAs (e.g. Møller et al., 2004; Ledoux et al., 2006; Møller et al., 2013), together with the observed SFR- main sequence.
On the other hand, the three high-metallicity DLAs of our sample were not detected in a sensitive IFU search. These have metallicities similar to those of three of the X-shooter targets in Krogager et al. (2012), and would have been detected in our search for similar SFRs () and impact parameters ( kpc). Adopting the SFR- relation of Daddi et al. (2007) and extrapolating it to lower SFRs, our limits imply . Is such a low mass inconsistent with the DLA metallicities? Evaluating the FMR of Mannucci et al. (2010), which is based on emission lines, with and SFR , we recover 12+log(O/H) dex. This value is roughly consistent with the DLA absorption metallicity, especially given the systematic uncertainty of nebular-line metallicity measurements inherent to the FMR and the possibility of abundance gradients.
Of course, the number of high-metallicity DLAs that have been searched for H or nebular emission is still quite small and it is possible that observational biases might have caused some of the non-detections. For example, in the model of Fynbo et al. (2008), high-metallicity DLAs are expected to arise in large, luminous galaxies, with statistically larger impact parameters. The H non-detections in our searches might then have been due to the limited NIFS field of view. We conclude that, although the paucity of detections in IFU searches is certainly curious, all three approaches (VLT-X-shooter, Gemini-NIFS and VLT-SINFONI) have biases (see above) that would affect the fraction of detections of H or nebular emission, and hence the inferred SFR limits. We suggest that the present approaches should be augmented by (1) combining wide-field IFU searches with the use of AO with laser guide stars, so that H emission cannot be hidden under the QSO emission or missed by being outside the field of view, and (2) following up X-shooter non-detections with more slit angles, to rule out the possibility that non-detections arise because the nebular emission is not covered by the slit. Finally, given the biases in the current searches, we also feel that it is premature to interpret the present SFR data to either support or rule out a mass-metallicity relation in damped Ly systems.
Acknowledgements
This work is based on observations obtained at the Gemini Observatory, which is operated by the Association of Universities for Research in Astronomy, Inc., under a cooperative agreement with the NSF on behalf of the Gemini partnership: the National Science Foundation (United States), the Science and Technology Facilities Council (United Kingdom), the National Research Council (Canada), CONICYT (Chile), the Australian Research Council (Australia), Ministério da Ciência, Tecnologia e Inovação (Brazil) and Ministerio de Ciencia, Tecnología e Innovación Productiva (Argentina). WHW is partially supported by the Ministry of Science and Technology of Taiwan grant 102-2119-M-001-007-MY3. NK acknowledges support from the Department of Science and Technology through a Ramanujan Fellowship. JXP is partly supported by NSF grant AST-1109447. The authors would like to dedicate this paper to the memory of Arthur M. Wolfe, who pioneered studies of damped Ly systems for more than three decades.
References
- Bechtold et al. (1998) Bechtold J., Elston R., Yee H. K. C., Ellingson E., Cutri R. M., 1998, in D’Odorico S., Fontana A., Giallongo E., eds, The Young Universe: Galaxy Formation and Evolution at Intermediate and High Redshift Vol. 146 of Astronomical Society of the Pacific Conference Series, Star Formation in High Redshift Galaxies. p. 241
- Bird et al. (2014) Bird S., Vogelsberger M., Haehnelt M., Sijacki D., Genel S., Torrey P., Springel V., Hernquist L., 2014, MNRAS, 445, 2313
- Bothwell et al. (2013) Bothwell M. S., Maiolino R., Kennicutt R., Cresci G., Mannucci F., Marconi A., Cicone C., 2013, MNRAS, 433, 1425
- Bouché et al. (2013) Bouché N., Murphy M. T., Kacprzak G. G., Péroux C., Contini T., Martin C. L., Dessauges-Zavadsky M., 2013, Science, 341, 50
- Bouché et al. (2012) Bouché N. et al., 2012, MNRAS, 419, 2
- Bunker et al. (1999) Bunker A. J., Warren S. J., Clements D. L., Williger G. M., Hewett P. C., 1999, MNRAS, 309, 875
- Chen et al. (2005) Chen H.-W., Kennicutt Jr. R. C., Rauch M., 2005, ApJ, 620, 703
- Christensen et al. (2007) Christensen L., Wisotzki L., Roth M. M., Sánchez S. F., Kelz A., Jahnke K., 2007, A&A, 468, 587
- Daddi et al. (2004) Daddi E., Cimatti A., Renzini A., Fontana A., Mignoli M., Pozzetti L., Tozzi P., Zamorani G., 2004, ApJ, 617, 746
- Daddi et al. (2007) Daddi E. et al., 2007, ApJ, 670, 156
- Dekel et al. (2009) Dekel A. et al., 2009, Nature, 457, 451
- Dessauges-Zavadsky et al. (2004) Dessauges-Zavadsky M., Calura F., Prochaska J. X., D’Odorico S., Matteucci F., 2004, A&A, 416, 79
- Dessauges-Zavadsky et al. (2006) Dessauges-Zavadsky M., Prochaska J. X., D’Odorico S., Calura F., Matteucci F., 2006, A&A, 445, 93
- Djorgovski et al. (1996) Djorgovski S. G., Pahre M. A., Bechtold J., Elston R., 1996, Nature, 382, 234
- Ellison et al. (2012) Ellison S. L., Kanekar N., Prochaska J. X., Momjian E., Worseck G., 2012, MNRAS, 424, 293
- Ellison et al. (2008) Ellison S. L., York B. A., Pettini M., Kanekar N., 2008, MNRAS, 388, 1349
- Erb et al. (2006) Erb D. K., Shapley A. E., Pettini M., Steidel C. C., Reddy N. A., Adelberger K. L., 2006, ApJ, 644, 813
- Forbes et al. (2014) Forbes J. C., Krumholz M. R., Burkert A., Dekel A., 2014, MNRAS, 438, 1552
- Förster Schreiber et al. (2009) Förster Schreiber N. M. et al., 2009, ApJ, 706, 1364
- Fumagalli et al. (2014a) Fumagalli M., Hennawi J. F., Prochaska J. X., Kasen D., Dekel A., Ceverino D., Primack J., 2014a, ApJ, 780, 74
- Fumagalli et al. (2014b) Fumagalli M., O’Meara J. M., Prochaska J. X., Kanekar N., Wolfe A. M., 2014b, MNRAS, 444, 1282
- Fumagalli et al. (2015) Fumagalli M., O’Meara J. M., Prochaska J. X., Rafelski M., Kanekar N., 2015, 446, 3178
- Fumagalli et al. (2010) Fumagalli M., O’Meara J. M., Prochaska J. X., Kanekar N., 2010, MNRAS, 408, 362
- Fynbo et al. (1999) Fynbo J. P., Møller P., Warren S. J., 1999, MNRAS, 305, 849
- Fynbo et al. (2013) Fynbo J. P. U. et al., 2013, MNRAS, 436, 361
- Fynbo et al. (2010) Fynbo J. P. U. et al., 2010, MNRAS, 408, 2128
- Fynbo et al. (2011) Fynbo J. P. U. et al., 2011, MNRAS, 413, 2481
- Fynbo et al. (2008) Fynbo J. P. U., Prochaska J. X., Sommer-Larsen J., Dessauges-Zavadsky M., Møller P., 2008, ApJ, 683, 321
- Haehnelt et al. (1998) Haehnelt M. G., Steinmetz M., Rauch M., 1998, ApJ, 495, 64
- Hennawi et al. (2009) Hennawi J. F., Prochaska J. X., Kollmeier J., Zheng Z., 2009, ApJL, 693, L49
- Hunstead et al. (1990) Hunstead R. W., Pettini M., Fletcher A. B., 1990, ApJ, 356, 23
- Jorgenson & Wolfe (2014) Jorgenson R. A., Wolfe A. M., 2014, ApJ, 785, 16
- Kanekar & Chengalur (2001) Kanekar N., Chengalur J. N., 2001, A&A, 369, 42
- Kanekar & Chengalur (2003) Kanekar N., Chengalur J. N., 2003, A&A, 399, 857
- Kanekar et al. (2014) Kanekar N. et al., 2014, MNRAS, 438, 2131
- Kanekar et al. (2009) Kanekar N., Smette A., Briggs F. H., Chengalur J. N., 2009, ApJ, 705, L40
- Kennicutt (1998) Kennicutt Jr. R. C., 1998, ApJ, 498, 541
- Krogager et al. (2012) Krogager J.-K., Fynbo J. P. U., Møller P., Ledoux C., Noterdaeme P., Christensen L., Milvang-Jensen B., Sparre M., 2012, MNRAS, 424, L1
- Kulkarni et al. (2000) Kulkarni V. P., Hill J. M., Schneider G., Weymann R. J., Storrie-Lombardi L. J., Rieke M. J., Thompson R. I., Jannuzi B. T., 2000, ApJ, 536, 36
- Kulkarni et al. (2012) Kulkarni V. P., Meiring J., Som D., Péroux C., York D. G., Khare P., Lauroesch J. T., 2012, ApJ, 749, 176
- Kulkarni et al. (2006) Kulkarni V. P., Woodgate B. E., York D. G., Thatte D. G., Meiring J., Palunas P., Wassell E., 2006, ApJ, 636, 30
- Kurucz (1979) Kurucz R. L., 1979, ApJS, 40, 1
- le Brun et al. (1997) le Brun V., Bergeron J., Boissé P., Deharveng J.-M., 1997, A&A, 321, 733
- Ledoux et al. (2006) Ledoux C., Petitjean P., Fynbo J. P. U., Møller P., Srianand R., 2006, A&A, 457, 71
- Ledoux et al. (2003) Ledoux C., Petitjean P., Srianand R., 2003, MNRAS, 346, 209
- Lilly et al. (2013) Lilly S. J., Carollo C. M., Pipino A., Renzini A., Peng Y., 2013, ApJ, 772, 119
- Lopez et al. (2002) Lopez S., Reimers D., D’Odorico S., Prochaska J. X., 2002, A&A, 385, 778
- Lu et al. (1998) Lu L., Sargent W. L. W., Barlow T. A., 1998, AJ, 115, 55
- Maller et al. (2001) Maller A. H., Prochaska J. X., Somerville R. S., Primack J. R., 2001, MNRAS, 326, 1475
- Mannucci et al. (2010) Mannucci F., Cresci G., Maiolino R., Marconi A., Gnerucci A., 2010, MNRAS, 408, 2115
- Mannucci et al. (1998) Mannucci F., Thompson D., Beckwith S. V. W., Williger G. M., 1998, ApJL, 501, L11
- McGregor et al. (2003) McGregor P. J. et al., 2003, in Iye M., Moorwood A. F. M., eds, Instrument Design and Performance for Optical/Infrared Ground-based Telescopes Vol. 4841 of Society of Photo-Optical Instrumentation Engineers (SPIE) Conference Series, Gemini near-infrared integral field spectrograph (NIFS). p. 1581
- Møller et al. (2004) Møller P., Fynbo J. P. U., Fall S. M., 2004, A&A, 422, L33
- Møller et al. (2013) Møller P., Fynbo J. P. U., Ledoux C., Nilsson K. K., 2013, MNRAS, 430, 2680
- Møller & Warren (1993) Møller P., Warren S. J., 1993, A&A, 270, 43
- Neeleman et al. (2013) Neeleman M., Wolfe A. M., Prochaska J. X., Rafelski M., 2013, ApJ, 769, 54
- Noeske et al. (2007) Noeske K. G. et al., 2007, ApJ, 660, L43
- Noterdaeme et al. (2012) Noterdaeme P. et al., 2012, A&A, 540, 63
- Noterdaeme et al. (2008) Noterdaeme P., Ledoux C., Petitjean P., Srianand R., 2008, A&A, 481, 327
- Noterdaeme et al. (2014) Noterdaeme P., Petitjean P., Pâris I., Cai Z., Finley H., Ge J., Pieri M. M., York D. G., 2014, A&A, 566, A24
- Penprase et al. (2010) Penprase B. E., Prochaska J. X., Sargent W. L. W., Toro-Martinez I., Beeler D. J., 2010, ApJ, 721, 1
- Péroux et al. (2011) Péroux C., Bouché N., Kulkarni V. P., York D. G., Vladilo G., 2011, MNRAS, 410, 2237
- Péroux et al. (2012) Péroux C., Bouché N., Kulkarni V. P., York D. G., Vladilo G., 2012, MNRAS, 419, 3060
- Pettini et al. (1994) Pettini M., Smith L. J., Hunstead R. W., King D. L., 1994, ApJ, 426, 79
- Pettini et al. (1997) Pettini M., Smith L. J., King D. L., Hunstead R. W., 1997, ApJ, 486, 665
- Planck Collaboration (2013) Planck Collaboration 2013, arxiv:1303.5076
- Pontzen et al. (2008) Pontzen A. et al., 2008, MNRAS, 390, 1349
- Prochaska et al. (2008) Prochaska J. X., Chen H.-W., Wolfe A. M., Dessauges-Zavadsky M., Bloom J. S., 2008, ApJ, 672, 59
- Prochaska et al. (2003) Prochaska J. X., Gawiser E., Wolfe A. M., Castro S., Djorgovski S. G., 2003, ApJ, 595, L9
- Prochaska et al. (2002) Prochaska J. X., Gawiser E., Wolfe A. M., Quirrenbach A., Lanzetta K. M., Chen H.-W., Cooke J., Yahata N., 2002, AJ, 123, 2206
- Prochaska & Wolfe (1996) Prochaska J. X., Wolfe A. M., 1996, ApJ, 470, 403
- Prochaska & Wolfe (1997) Prochaska J. X., Wolfe A. M., 1997, ApJ, 487, 73
- Prochaska et al. (2007) Prochaska J. X., Wolfe A. M., Howk J. C., Gawiser E., Burles S. M., Cooke J., 2007, ApJS, 171, 29
- Prochaska et al. (2001) Prochaska J. X. et al., 2001, ApJS, 137, 21
- Rafelski et al. (2012) Rafelski M., Wolfe A. M., Prochaska J. X., Neeleman M., Mendez A. J., 2012, ApJ, 755, 89
- Rahmati et al. (2013) Rahmati A., Pawlik A. H., Raičevic M., Schaye J., 2013, MNRAS, 430, 2427
- Rao et al. (2003) Rao S. M., Nestor D. B., Turnshek D. A., Lane W. M., Monier E. M., Bergeron J., 2003, ApJ, 595, 94
- Rodighiero et al. (2011) Rodighiero G. et al., 2011, ApJ, 739, L40
- Smith et al. (1989) Smith H. E., Cohen R. D., Burns J. E., Moore D. J., Uchida B. A., 1989, ApJ, 347, 87
- Stott et al. (2013) Stott J. P., Sobral D., Bower R., Smail I., Best P. N., Matsuda Y., Hayashi M., Geach J. E., Kodama T., 2013, MNRAS, 436, 1130
- Tremonti et al. (2004) Tremonti C. A. et al., 2004, ApJ, 613, 898
- Walter et al. (2008) Walter F., Brinks E., de Blok W. J. G., Bigiel F., Kennicutt R. C., Jr. Thornley M. D., Leroy A. K., 2008, AJ, 136, 2563
- Warren et al. (2001) Warren S. J., Møller P., Fall S. M., Jakobsen P., 2001, MNRAS, 326, 759
- Wolfe et al. (2005) Wolfe A. M., Gawiser E., Prochaska J. X., 2005, ARA&A, 43, 861
- Wolfe et al. (1992) Wolfe A. M., Lanzetta K. M., Turnshek D. A., Oke J. B., 1992, ApJ, 385, 151
- Wolfe & Prochaska (1998) Wolfe A. M., Prochaska J. X., 1998, ApJ, 494, L15
- Wolfe et al. (1986) Wolfe A. M., Turnshek D. A., Smith H. E., Cohen R. D., 1986, ApJS, 61, 249
- York et al. (2007) York B. A., Kanekar N., Ellison S. L., Pettini M., 2007, MNRAS, 382, L53