Stacking of SKA data: comparing uv-plane and and image-plane stacking
Abstract:
Stacking as a tool for studying objects that are not individually detected is becoming popular even for radio interferometric data, and will be widely used in the SKA era. Stacking is typically done using imaged data rather than directly using the visibilities (the uv-data). We have investigated and developed a novel algorithm to do stacking using the uv-data. We have performed extensive simulations comparing to image-stacking, and summarize the results of these simulations. Furthermore, we disuss the implications in light of the vast data volume produced by the SKA. Having access to the uv-stacked data provides a great advantage, as it allows the possibility to properly analyse the result with respect to calibration artifacts as well as source properties such as size. For SKA the main challenge lies in archiving the uv-data. For purposes of robust stacking analysis, it would be strongly desirable to either keep the calibrated uv-data at least in an average form, or implement a stacking queue where stacking positions could be provided prior to the observations and the uv-stacking is done almost in real time.
1 Introduction
Stacking is known as a tool to average together data for a given set of objects. In most cases, this is done for imaging and photometry where the sources in question are not individually detected (though have known positions), In that case, stacking the data yields an average detection or upper limit. This is done for data across the whole electromagnetic spectrum ranging from X-rays to radio (e.g. Nandra et al. 2002; Worsley et al. 2005; Knudsen et al. 2005; Dole et al. 2006; Carilli et al. 2008).
A large part of the imaging produced in radio comes from interferometric observations, with many large surveys available or planned (e.g., VLA-COSMOS, Schinnerer et al. 2007, and the VLA 1.4 GHz Survey of the Extended Chandra Deep Field South, Miller et al. 2013). The success of stacking using the interferometric images depends on how well the image reconstruction and deconvolution process has been. For example, as interferometric observations act as a spatial filter, flux could be missing or very bright sources can have caused increased noise and/or artifacts in the imaging.
The SKA will offer access to so much data and large surveys, that stacking will become a frequently used tool to study the fainter sources. This naturally gives rise to the question, what are efficient stacking tools? We have investigated stacking directly in the uv-plane on the visibilities rather than in the image-plane. We have developed a novel algorithm and compared this to image-stacking. In this chapter we discuss some of the implications of the results for stacking of SKA data.
While the scientific motivation for our work is studying faint, high-redshift galaxies with star formation rates below a few M⊙/yr, galaxies, the algorithm analysed here would also find application in other fields of astronomy, and both for spectral line and continuum studies.
2 A novel uv-stacking algorithm
We have developed a new stacking algorithm for radio inteferometric data. The algorithm works directly on the uv-data and is applicable to any radio interferometric data. The algorithm has been tested on simulated data mimicking JVLA and ALMA observations and compared to image-stacking, i.e. stacking on the reconstructed and deconvolved images. This is presented in the paper Lindroos et al. (2015).
In summary, the algorithm works as follows: For sources (i.e. given positions) within a single pointing the visibilities are recalculated using
| (1) |
where is the unit vector pointing to the phase centre, is the unit vector pointing to the stacking positions, describes the primary beam attenuation in the direction , is the baseline of the visibility, is the wavelength, and is the weight of the stacking position. This means, that the visibilities are not duplicated, yielding the important advantage that the size of the data set is not increased and kept managable. Furthermore, as the computation for each visilibity is done independently, the code can be parallellized and thus run quickly for large sets.
The whole algorithm is designed to be able to handle the effects from e.g. mosaics and wide-field observations. For mosaics, the algorithm is run for each pointing individually, and subsequently concatenated into one data set. Weights are recalculated to include the relative weights between pointings.
In the design of the algorithm, wide-field effects (for example, stretching of the uv-coordinates local to the stacked position) do not pose any restrictions on point-sources. In the case of extended sources, we estimate that the baseline re-projection effects should not be larger than at most a few per cent in the recovered size when using the JVLA, though larger for the longer SKA-mid baselines.
In order to test the algorithm, we have carried out extensive simulations of JVLA and ALMA type of data. These data represent both the GHz and 100’s GHz regime. The JVLA like simulations provide the closest representation to the SKA data, in particular SKA-MID. The simulations have systematically covered different aspects. The sources input to the simulations were defined as ’bright foreground sources’ and ’target sources’. The former represent the bright sources across the sky and typically contribute to the noise. The latter are the sources of interest to be stacked. We have investigated several effects, in particular: sub-pixel sampling, wide-field effects, bright foreground sources, extended sources, and mosaiced fields. Below we focus on the extended foreground and target sources.
2.1 Extended bright foreground sources
The presence of bright sources in the data impacts on the dynamic range. While this is already a challenge for present-day interferometric arrays such as the JVLA, this will be even more pronounced for the SKA.
Bright source present in data need to be removed, and this is generally the case both for image- and uv-stacking. Typically, bright sources are removed using the best available model, however, there will always be residuals left depending on the depth of the deconvolution, the quality of the data, and how well the sources can be modeled. In the GHz range, many radio sources have complex morphology, e.g. jets and lopes of radio galaxies, and this makes it difficult to completely model the flux distribution.
We have run extensive simulations, where bright, extended foreground sources were introduced. The size of the sources varied between a FWHM of 0.5” to 5” and the flux varied following a log-polynomial distribution derived from the COSMOS field (Bondi et al. 2008). After imaging (using Multi-Frequency Synthesis, Conway et al. 1990, combined with w-projection, Cornwell et al. 2008) and deconvolution (using CLEAN, Högbom 1974), a residual measurement set is produced and the noise in the centre of the deconvolved image is twice that of the thermal noise limit. Simulations were run in a Monte Carlo setup with typically 100 realisations to reduce statistical variations. Here we focus on the setup of a JVLA A-array configuration with a central frequency of 1.4 GHz and a bandwidth of 250 MHz (for further details, see Lindroos et al. 2015).
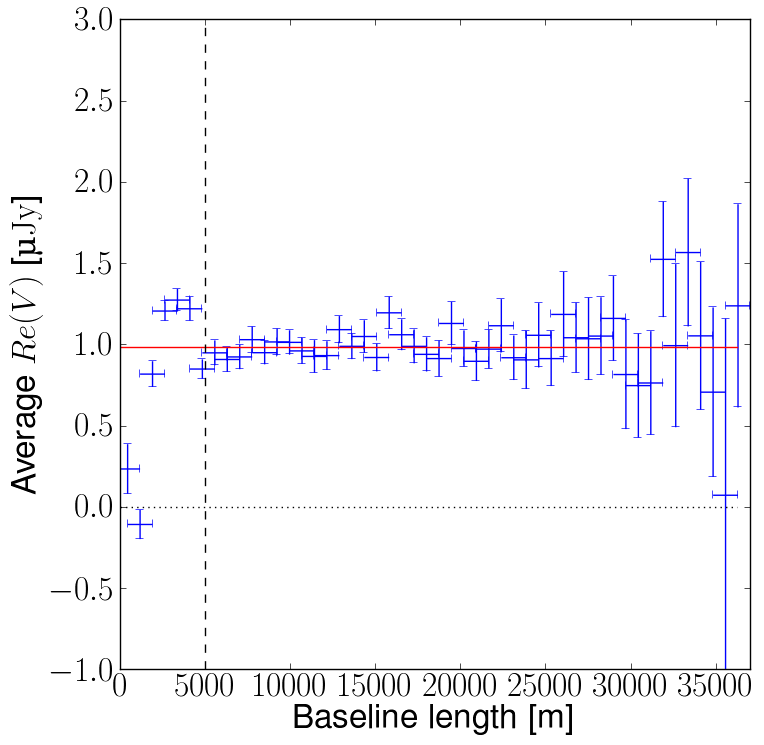
As an example, in Fig. 1, we show the amplitude as function of uv-distance for a uv-stacked source from a simulation with extended bright foreground sources; the bright foreground sources were removed from the simulated data using the Clean algorithm. We find that the short baselines of the stacked source suffer from imperfect bright source removal. Because the stacking was performed in the uv-plane we were able to measure the stacked flux reliably when selecting the baselines not or less affected by the bright source residuals, and thus determine the stacked flux to the level of the input model. For comparison, the fluxes measured in with image-stacking were about 10 per cent lower than the input model. As a check, we have carried out a similar simulation but without the bright foreground sources, and the resulting stacked source has no visible problems at the short baselines.


2.2 Extended target sources
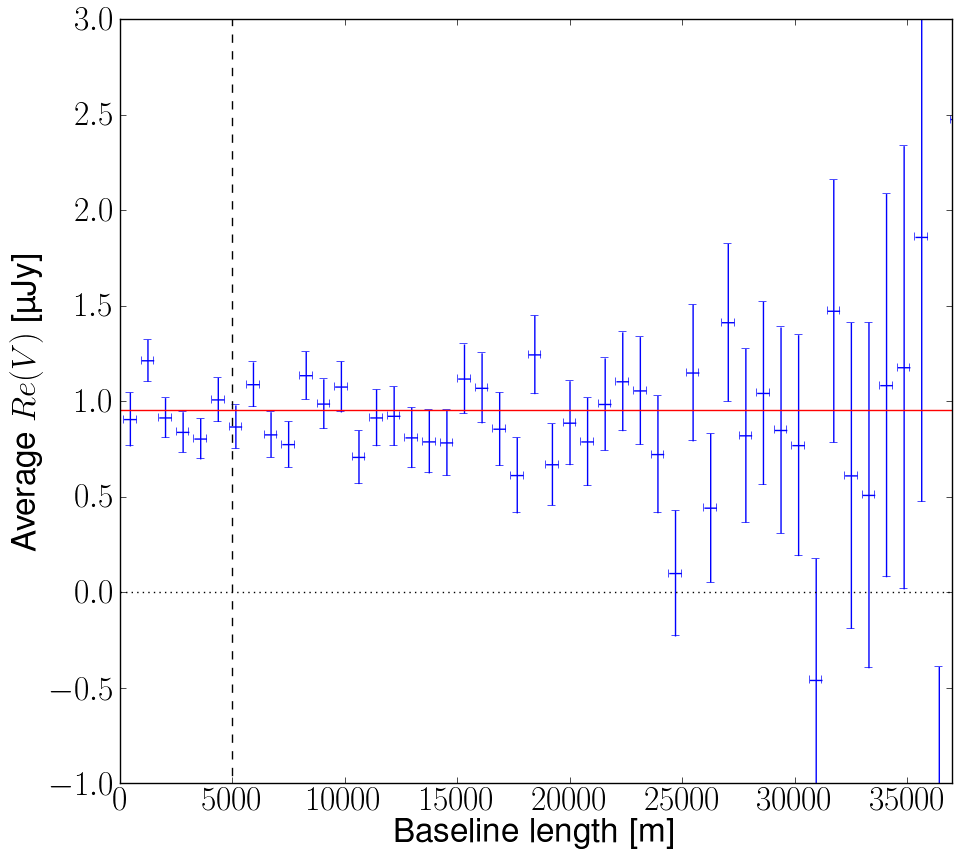
Expanding the simulations, we have simulated target sources that are slightly extended with a size of 1.5” for the JVLA A-array configuration. The aim of this was to determine the performance of uv-stacking vs image-stacking in terms of estimating an average size. In Fig. 2, we show the amplitude as function of uv-distance for the stacked source. Again, as discussed above, the shortest baselines suffer from imperfect removal of the bright sources in the field. The uncertainty of size-estimate done using the uv-stacked data is half that of the same estimate done with image-stacked data.
The uv-stacking has the advantage of allowing for the possibility to ignore the shortest baselines. In comparison the image-stacked source could be subject to the high dynamic range issues, e.g. this could result in the presence of an extended component. It is possible to deal with this to some extent by using a low-spatial-frequency filter, however, a more direct way would be to do this directly on the uv-data.
Additionally, in comparison with the uv-stacked source, the image-stacked source is convolved with the beam, therefore it is best fitted with a model of the convolved dirty beam. Many large surveys currently are done as mosaics with several pointings. This means that the beam will not be the same for each pointing, and this is a complication for image-stacking and e.g. modelling a dirty beam.

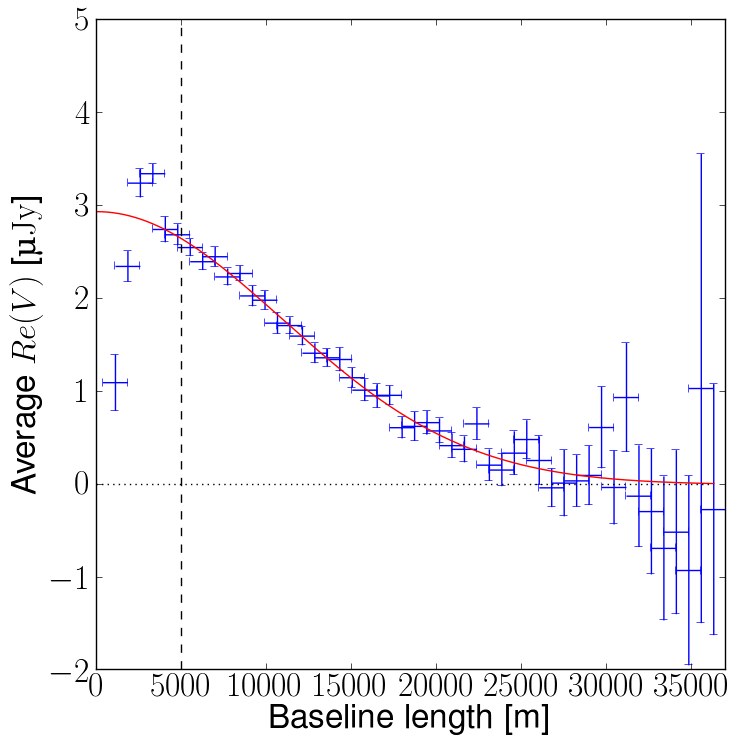
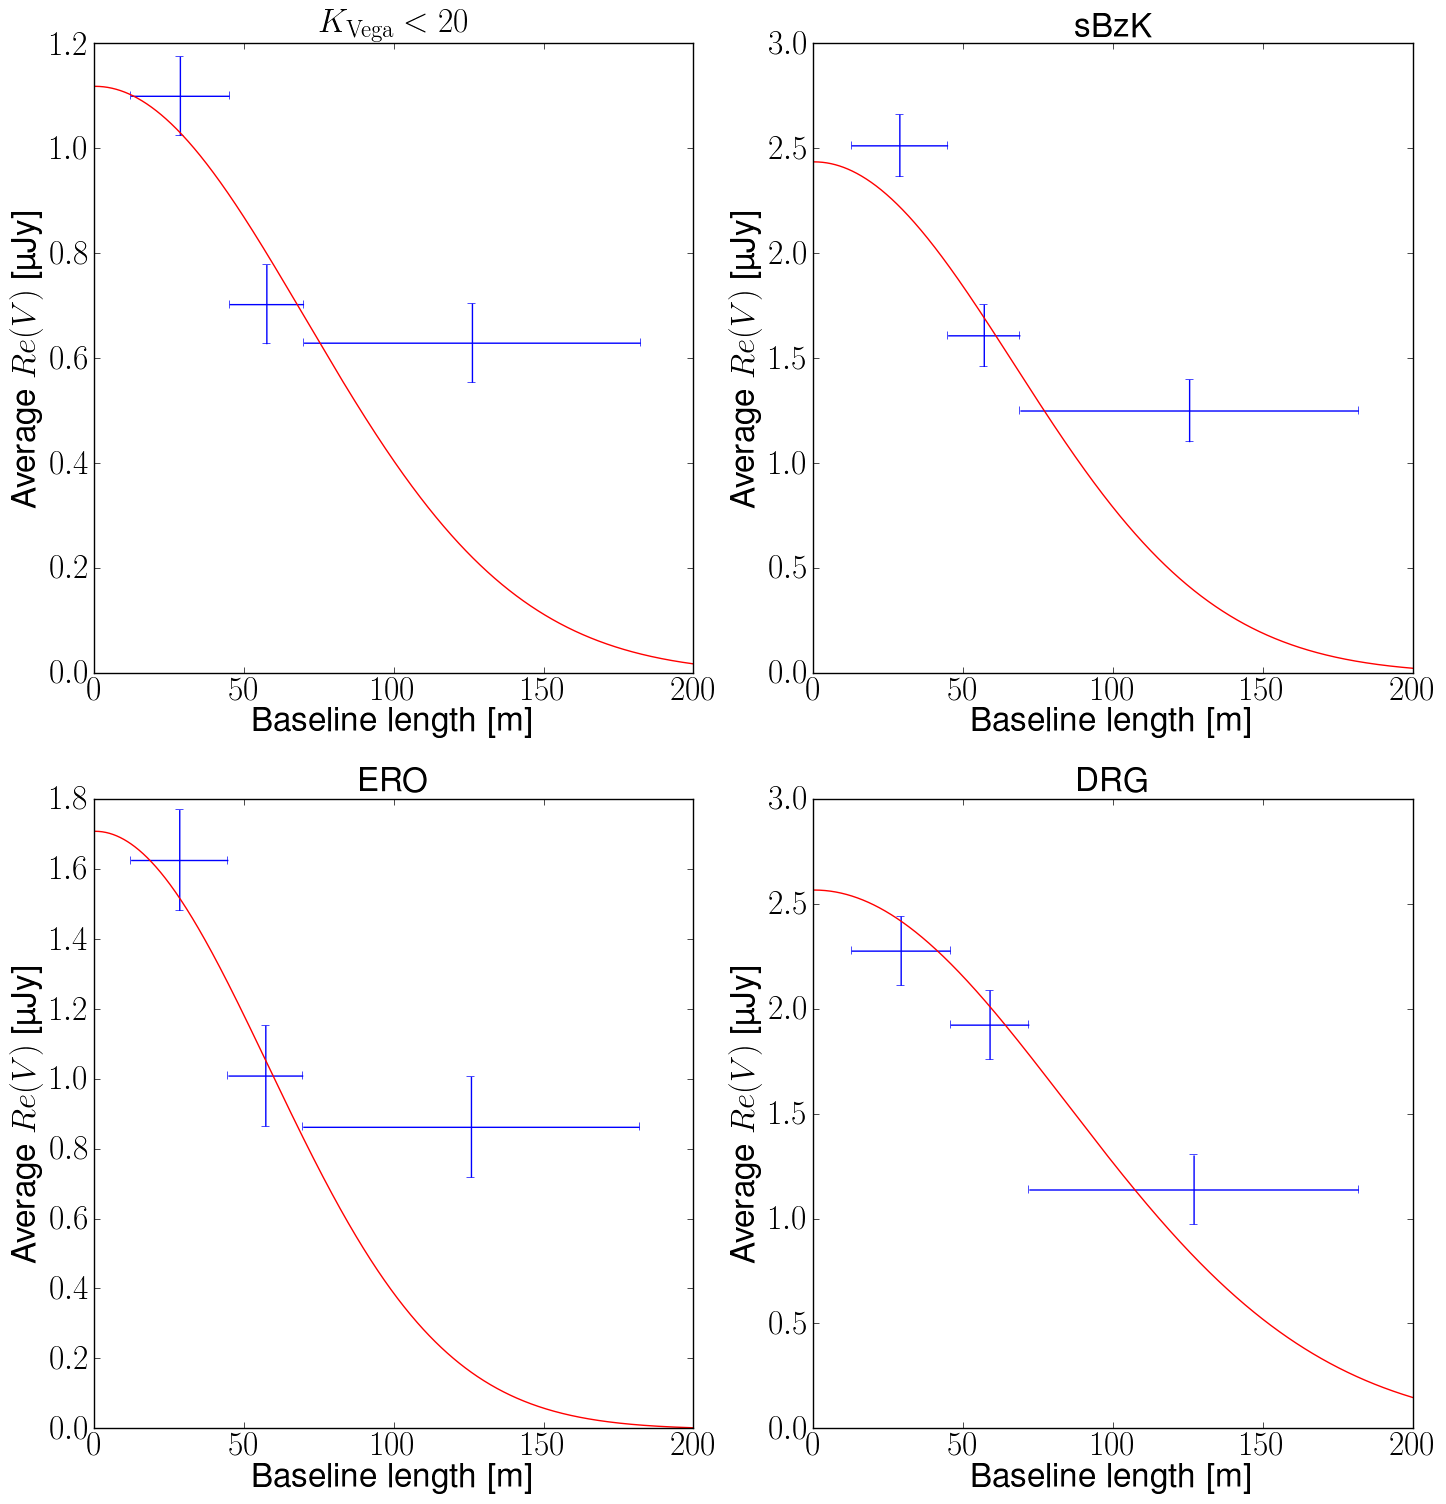
We have applied the stacking algorithm to real data. As presented in Lindroos (2014), using both VLA and ALMA data from the Extended Chandra-Deep-Field South (VLA data: Miller et al. 2013, ALMA data: Hodge et al. 2013), initial results yield source sizes of about for optically/near-infrared selected high- galaxies. More importantly is, however, the fact that we can use the stacked uv-data for further interpretation. In Fig. 3, we show the averaged amplitude vs baseline length, and find that there is a rise towards the shortest baselines possibly caused by an extended component, and a plateau towards the longer baselines possibly indicating a point-like component. Among the possible interpretations of this, is that the stacked sources represent a mixture of extended and compact galaxies, or that the star-forming regions are compact but distributed over an extended region. We show this here, not to draw immediate conclusions about the distribution of the radio or mm emission from high-, star-forming galaxies, but to illustrate the vast potential for further analysis of for example structural parameters when having the stacked uv-data available.

3 Discussion: Consequences for stacking of SKA data
The tests of our new stacking algorithm, shows that the uv-stacking provides a more robust result relative to the image-stacking. The algorithm is tested both in the GHz range, where currently the JVLA is the most sensitive array, and in the 100’s GHz range, where ALMA is the most sensitive array. This means that our findings are applicable to the SKA-MID design and frequency range. The algorithm is designed to be applicable to radio interferometry in general, so also for lower frequencies such as SKA-LOW. The access to the stacked uv-data provides possibilities for a more robust analysis, in particular it enables reliable filtering at different spatial frequencies as well as means for detailed analysis of the stacked sizes.
Stacking is mentioned by many different future projects for the SKA, and therefore it is important to make available the tools that provide the most optimized stacking tools. We argue that uv-stacking is such a powerful tool, that it should be standard for future facilities. However, for future facilities such as the SKA, this also means facing a significant challenge, as it is expected that most raw and even calibrated SKA uv-data will not be archived, at least not for long-term storage. Consequently, one could argue that uv-data should also be stored long-term, unless the stacking is restricted to the image plane. In that case one needs to be aware that the results are less robust and more prone to additional uncertainties.
We consider three different options:
-
1.
Design a stacking queue, which will be executed in almost real-time with the observations. The uv-stacking would be carried out after calibration, during a ’buffering’ time before the uv-data is removed. In the case where the processed and calibrated uv-data will not be stored for long term archive access, but only kept for a short period needed for processing of (large) surveys, one could imaging that the SKA should offer an ’observing mode’ where stacking lists are submitted, and then processed in parallel with the rest of the survey. This compromise would enable the stacked uv-data to be available for readily defined positions, as such a data set will be significantly reduced in size. The Lindroos et al (2015) algorithm is designed so that it could easily be tailored to such a purpose.
-
2.
Ensure that calibrated uv-data is archived, if not all, then at least in some averaged format and at least for large surveys. This would enable the most flexible processing of the data in terms of stacking, also for astronomers not directly involved in the surveys.
-
3.
Only stacking in the image-plane: Accepting potentially less realible and less robust results in favour of not have to archive uv-data. However, this also means limitation for a number of different aspects, e.g. measuring sizes of stacked sources. Probably most importantly, it would mean no access to baseline info and thus limited possibility to filter out short baselines as illustrated in Figs. 1 and 2.
4 Summary
In this chapter we have discussed stacking of uv-data vs image-data from the perspective of the SKA. We describe our novel algorithm for stacking of visibilities, which we have compared to image-stacking. The uv-stacking algorithm has been developed for application to any type of radio interferometric data. The comparison was done primarily using simulated data based on JVLA and ALMA.
We have found in a detailed comparison that uv-stacking is a more robust method than image-stacking. The results produced from uv-stacking are either similar or more reliable than the image-stacked results. Having access to the stacked uv-data provides means it will be possible to remove or at least treat artefacts such as imperfect removal of bright sources, which can signficantly affect the stack results. Furthermore, having the stacked uv-data in hand enables a more detailed analysis of the properties of the stacked source, in particular size measurements.
It is therefore our conclusion that in the design of the SKA it should be carefully considered to allow for uv-stacking, either through the means of making (averaged) calibrated uv-data available in archives (at least for selected surveys), or as an alternative provide a specially designed stacking queue for large/deep surveys. Having access to the uv-data after stacking will be invaluable in ensuring that the desired signal can be optimally extracted from the data.
References
- Bondi et al. (2008) Bondi, M., Ciliegi, P., Schinnerer, E., et al., 2008, ApJ, 2681, 1129
- Carilli et al. (2008) Carilli, C.L., Lee, N., Capak, P., et al., 2008, ApJ, 689, 883
- Conway et al. (1990) Conway, J.E., Cornwell, T.J., Wilkinson, P.N., 1990, MNRAS, 246, 490
- Cornwell et al. (2008) Cornwell, T.J., Golap, K., Bhatnagar, S., 2008, IEEE Journal of Selected Topics in Signal Processing, 2, 647
- Decarli et al. (2014) Decarli, R., Smail, I., Walter, F., et al., 2014, ApJ, 780, 115
- Dole et al. (2006) Dole, H., Lagache, G., Puget, J.-L., et al., 2006, A&A, 451, 417
- Hodge et al. (2013) Hodge, J.A., Karim, A., Smail, I., et al., 2013, ApJ, 768, 91
- Högbom (1974) Högbom, J.A., 1974, A&AS, 15, 417
- Knudsen et al. (2005) Knudsen, K.K., van der Werf, P.P., Franx, M., et al., 2005, ApJ, 632, L9
- Lindroos et al. (2015) Lindroos, L., Knudsen, K.K., Vlemmings, W., Conway, J., Martí-Vidal, I., 2015, MNRAS, 446, 3502 (arXiv:1411.1410)
- Lindroos (2014) Lindroos, L., 2014, Licentiate thesis, Chalmers University of Technology, link: http://publications.lib.chalmers.se/publication/194419-stacking-of-interferometric-data-at-sub-millimeter-and-radio-wavelengths
- Miller et al. (2013) Miller, N.A., Bonzini, M., Fomalont, E.B., et al., 2013, ApJS, 205, 13
- Nandra et al. (2002) Nandra, K., Mushotzky, R.F., Arnaud, K., et al., 2002, ApJ, 576, 625
- Schinnerer et al. (2007) Schinnerer, E., et al., 2007, ApJS, 172, 46
- Worsley et al. (2005) Worsley, M.A., Fabian, A.C., Bauer, F.E., et al., 2005, MNRAS, 357, 1281