Extended Report: Fine-grained Recognition of Abnormal Behaviors for Early Detection of Mild Cognitive Impairment
Abstract
According to the World Health Organization, the rate of people aged 60 or more is growing faster than any other age group in almost every country, and this trend is not going to change in a near future. Since senior citizens are at high risk of non communicable diseases requiring long-term care, this trend will challenge the sustainability of the entire health system. Pervasive computing can provide innovative methods and tools for early detecting the onset of health issues. In this paper we propose a novel method to detect abnormal behaviors of elderly people living at home. The method relies on medical models, provided by cognitive neuroscience researchers, describing abnormal activity routines that may indicate the onset of early symptoms of mild cognitive impairment. A non-intrusive sensor-based infrastructure acquires low-level data about the interaction of the individual with home appliances and furniture, as well as data from environmental sensors. Based on those data, a novel hybrid statistical-symbolical technique is used to detect the abnormal behaviors of the patient, which are communicated to the medical center. Differently from related works, our method can detect abnormal behaviors at a fine-grained level, thus providing an important tool to support the medical diagnosis. In order to evaluate our method we have developed a prototype of the system and acquired a large dataset of abnormal behaviors carried out in an instrumented smart home. Experimental results show that our technique is able to detect most anomalies while generating a small number of false positives.
I Introduction
Several recent studies show that the proportion of elderly people over the whole population is rapidly growing in most countries. For instance, the European old-age dependency ratio (i.e., the ratio of people aged 65 years or older to people aged 15-64 years) is projected to double in the next decades [1]. As a consequence, a growing portion of people is at high risk of experiencing non communicable diseases, frailty and social exclusion, and may need long-term care, including nursing at home or frequent hospitalization. Of course, the inability of living independently may not only spoil the quality of life of elderly people and of those caring for them, but will also challenge the sustainability of the entire health system. Hence, there is a growing interest in exploiting pervasive computing technologies to support independent living and healthcare, especially for the senior population.
In this paper we propose a novel method to support early detection of mild cognitive impairment (MCI) for elderly people living independently at home. In the medical literature, MCI is used as a clinical diagnosis to describe a transitional state between healthy cognitive ageing and dementia, characterized by preserved functional abilities [2]. According to the criteria proposed by the International Working Group on MCI, there are evidences of subtle differences in performing instrumental activities of daily living (IADLs) among MCI patients compared to both healthy older adults and individuals with dementia [3]. Hence, long-term monitoring of daily living activities and recognition of abnormal behaviors may help practitioners to early detect the onset of cognitive impairment.
Different scales have been proposed to assess the cognitive health of people based on questionnaires and interviews about the ability of performing various kinds of IADLs [4]. However, that approach is prone to reporting bias; moreover, it cannot be applied to continuously monitor the cognitive health of a large number of people, since it incurs evident overheads in terms of time, resources and monetary costs. A few previous works, reviewed in Section II, have tried to detect behavioral markers of MCI onset through pervasive computing technologies, obtaining significant correlation between the predicted and actual cognitive status of the patient. However, those works have different limitations. Some of them require the execution of ability tests about the performance of IADLs in an instrumented smart home of a hospital; hence, they incur high costs and cannot be applied on a continuous basis. Other works rely on continuous monitoring of low-level behavioral markers (steps taken, walking speed…). While potentially useful to trigger alarms about possible MCI onset, those markers do not provide specific support to the diagnosis, since they do not report fine-grained descriptions of the anomalies occurred during the execution of IADLs.
In order to overcome the limitations of existing techniques we propose FABER, a novel technique for Fine-grained Abnormal BEhavior Recognition. Our method relies on medical models describing abnormal activity routines that may indicate the onset of early symptoms of MCI. These models have been acquired through the collaboration with cognitive neuroscience experts of a leading center for care and research on neurodegenerative disorders. A non-intrusive sensor-based infrastructure is deployed at the patient’s home, which acquires low-level information about the interaction with home appliances and furniture, as well as environmental parameters. Based on sensor data, we first detect the general activity being performed by the subject and then recognize anomalies in performing that activity or a group of activities. They include inappropriate timing and unnecessary repetitions of subactions, but also high level observations like “irregularly assuming meals” or “often consuming cold meals”. We use a hybrid statistical-symbolical technique including supervised learning, rule-based reasoning and probabilistic reasoning. Abnormal behaviors are communicated to the medical center for further analysis and interpretation. Differently from previous works, our method can be applied continuously at the patient’s home and, thanks to symbolic reasoning postprocessing over recognized activities, abnormal behaviors can be detected at a fine-grained level. In order to evaluate our approach, we have developed a prototype of our system, and collected a large dataset from an instrumented smart home. Experimental results show that our technique is able to detect most of the abnormal behaviors that we have targeted while producing a small number of false positives.
II Related work
Several studies in the neuropsychology research field show that it is possible to distinguish between cognitively healthy adults and cognitively impaired individuals based on subtle differences in their behavioral patterns [3]. There is a growing interest in exploiting pervasive computing technologies to automatically capture and measure those differences [6]. For instance, a sensor-based infrastructure has been used to unobtrusively monitor the execution of IADLs by older adults in a smart-home [7]; the results have shown a significant correlation between the cognitive health status of the subject and the level of assistance that he needed in order to complete the activities. More recently, motion sensors and contact sensors have been used in [8] to measure low-level activity patterns, such as walking speed and activity level in the home; results have shown that the coefficient of variation in the median walking speed is a statistically significant measure to distinguish MCI subjects from healthy seniors.
Based on this line of research, a few works have proposed to apply artificial intelligence methods on data acquired in sensor-rich environments, for assessing the cognitive health status of an individual performing a fixed set of predefined activities. In the work of Dawadi et al. [9], patients were invited to execute a list of routines (e.g., write a letter, prepare lunch) inside a hospital smart-home. Different kinds of sensors were used to detect movements inside the home and to track the use of furniture and appliances. Based on data coming from the home sensors, machine learning methods were used to assign a score to each performed activity; the score measures the ability of the subject to perform the activity correctly. The achieved scores were then used to predict the cognitive status of the patient (cognitive health or dementia). However, experimental results showed a not completely satisfactory degree of correlation among the predicted scores and the ones assigned by a human observer. In general, the low correlation may be due to the intrinsic difficulty of capturing the variability of human behaviors from a corpus of training data. In this work, we take a different approach: we use supervised learning only to detect the start- and end-times of activities, while we rely on domain knowledge provided by neuroscience experts to recognize the actual anomalies. To the best of our knowledge, our work is the first one that tries to apply this approach to cognitive health assessment.
The supervised learning approach has been applied in other works, including [10, 11, 12], using several other learning methods. A further difference with those works is that they assume that the patient executes a predefined set of IADLs following the instructions of practitioners in a medical center, while our method is intended to run continuously at the patient’s home, and does not interfere with the normal behavior of the patient.
Finally, we mention that several research efforts have been made to automatically detect abnormal behaviors for surveillance applications. Typically, in that field, abnormal actions are recognized based on the analysis of audio and video and on the application of machine learning techniques [13]. However, audio- and video-based systems are not suitable to our problem due to obvious privacy issues. Moreover, surveillance systems are mainly targeted to low-level physical actions, such as assaults, fights, stealing of objects, while our goal is to monitor high-level daily living behaviors, which are subject to high variability of execution based on the characteristics of the specific individual, on the environment and on many other contextual conditions.
III The FABER hybrid technique
In this section we illustrate the Fine-grained Abnormal BEhavior Recognition (FABER) hybrid technique to support early detection of MCI.
III-A Recognition framework
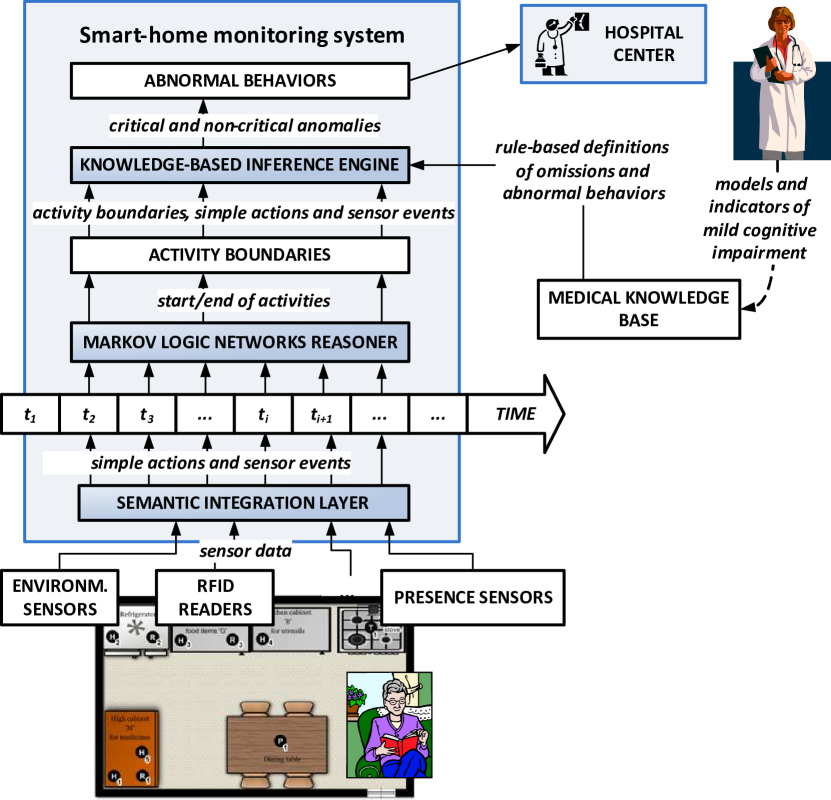
In Figure 1 we show the recognition framework. The system is implemented at the elderly’s home. A smart-home monitoring system running on a mobile device (e.g., a tablet) is in charge of executing the FABER algorithms. Different sensors, including environmental sensors, presence sensors, and RFID readers, are attached to furniture and instruments, and communicate raw data to the semantic integration layer. That layer is in charge of using raw sensor data to detect simple actions (e.g., “the fridge door has been opened”) and other events (e.g., “the temperature in the kitchen is more than 30 degrees Celsius”). Actions and events, together with their timestamps, are communicated to the markov logic network (mln) reasoner using a shared vocabulary. The reasoner periodically (e.g., daily) analyzes the event logs and infers the start/end time of activities based on the received data. The inferred activity boundaries are communicated –together with actions and events– to the knowledge-based inference engine. The inference engine evaluates the rules modeling abnormal behaviors, which are extracted from a medical knowledge base of MCI models and indicators. Finally, detected abnormal behaviors are communicated to the hospital center for further analysis by the doctors.
III-B Semantic integration of sensor data
The semantic integration layer is in charge of acquiring raw sensor data and to use them for inferring semantic descriptions of the current context, which are exploited by the MLN reasoner to detect the activity boundaries. Depending on the kind of available sensors, that module applies simple inference methods to derive basic actions and events. For instance, a rule states that “if the presence sensor detects a presence near the kitchen table, and the sensor on the kitchen’s chair detects a weight higher than Kg, then the current action is sitting at the kitchen chair”. Timestamped actions and events are represented using a shared vocabulary and communicated to the MLN reasoner.
III-C Detection of activity boundaries
After presenting our temporal model, we illustrate Markov Logic Networks (MLN) and we explain how we use this probabilistic logic to detect activity boundaries.
III-C1 Temporal model
Suppose that, in our system, the following temporal sequence of sensor events occurs:
where indicates that the sensor event occurred at time instant . For the sake of this work, we assume that sensor nodes communicate their sensed events in real-time to a gateway. The gateway is in charge of assigning a unique timestamp to each event, based on the time at which it is received. Hence, we impose a total order on event timestamps .
III-C2 MLN
Thanks to its rich expressiveness, first-order logic (FOL) and some of its fragments have been used in different works to model and reason with human activities [14]. However, it has been recognized that FOL knowledge bases are too inflexible to model many real-world scenarios. This limitation is even more accentuated in applications involving the temporal context. In particular, in the domain of activity recognition, temporal sequences of sensor events can be ambiguous to interpret. Indeed, the same sensor event sequence can result from the execution of different and possibly conflicting activities.
Example 1
Consider the following first-order logic (FOL) knowledge base:
| (1) | |||
| (2) | |||
Formula (1) states that the temporal sequence of two sensor events and occurring at and , respectively, indicates the execution of an activity at . Formula (2) states that the current activity of an individual cannot be “set the table” and “wash dishes” at the same time instant. Suppose to instantiate event to ClosingSilverwareDrawer and to OpeningGlasswareCabinet. The rules below, obtained by grounding formula (1), encode the fact that the occurrence of the temporal sequence event(ClosingSilverwareDrawer, ), event(OpeningGlasswareCabinet, ) can indicate both activities “set the table” and “wash dishes” at :
| (3) | |||
| (4) | |||
However, the derivation of both activities as instances of currentActivity at the same time instant would violate formula (2), making the model inconsistent.
The statistical-relational approach [15] has recently offered significant advances towards integrating rich expressiveness and uncertainty in one unified framework. MLN is an especially appealing example of this approach. The main idea of Markov logic [16] is to allow FOL formulae to be “softened”. The validity of a soft formula is evaluated according to the probability of being true with respect to a set of axioms describing reality. Each soft formula is associated to a weight that represents the confidence on the validity of the formula. Weights are generally learned from a training set of observations.
Formally, a MLN is a pair of two sets . Given the signature with a finite set of typed observable predicate symbols, a finite set of typed hidden predicate symbols, and a finite set of typed constants, the set of soft formulae is a set of pairs with each being a function-free FOL formula built using predicates from and each a real-valued weight associated with formula . The set of hard formulae is a set of function-free FOL formulae . The main inference task of MLN reasoning is to determine the most probable set of axioms representing reality that can be inferred based on the defined formulae and a set of observations (facts). Intuitively, formulae with higher weight will have higher influence in deriving these axioms.
Example 2
Referring to Example 1, MLN can solve the described problem by assigning formula (1) to the set of soft formulae and formula (2) to the set of hard formulae. The actual weights for the instantiations of formula (1) are estimated through supervised learning on a training set. Suppose that the estimated weight of formula (3) is higher than the one of formula (4) since, in the training set, the sensor event sequence is more frequently observed during “set the table” than during “wash dishes”. In that case, if is observed, the MLN reasoner would infer that the most probable currentActivity at is “set the table”. The MLN reasoner cannot derive both activities, since this would violate the hard formula (2). Of course, in order to effectively recognize the current activity, we need to use multiple formulae involving complex sequences of sensor events.
III-C3 Detecting activity boundaries through MLN
In our model, the observable predicates correspond to the sensor events. Predicate indicates that the sensor event occurred at and the one occurred at are consecutive; i.e., the former occurred before the latter, and no other sensor event occurred between them. As explained in Section III-C2, in our architecture we ensure that no more than one sensor event can occur at a given time instant. The hidden predicates correspond to the activity boundaries: indicates that activity begins at time and indicates that activity ends at time . The approach used for boundary recognition, initially proposed in [17], is to write appropriate soft formulae to create a correlation between windows of consecutive sensor events and start/end of activities. For example, in the case of the following soft formulae can be used:
-
•
++
-
•
++
Note that + symbol before a variable means that a weight is learned for each grounding of that variable. If we choose the following soft formulae can be used:
-
•
+++
-
•
+++
For each couple of consecutive sensor events, the first one of the above formulae correlates the first event with the start of an activity; the second formula correlates the second event with an activity end. In general, the most effective value of depends on the characteristics of the pervasive system and on the considered activities. In this work, we experimentally choose the optimal value of (see Section IV-E).
In addition to the soft formulae, we use hard formulae to express common sense knowledge about activity boundaries. In particular, in order to specify that it is impossible that an activity starts and ends at the same time, the following hard formulae are declared:
-
•
-
•
Based on the defined soft formulae, it is possible that the MLN reasoner detects multiple starts for the same activity instance. In order to avoid this issue, we declare the following hard formulae to state that each activity instance cannot start more than once:
-
•
,
where states that the instance of activity that started at time is still being performed at time . For the sake of this work we do not consider interleaved activities; hence, the hard formulae below express that a started activity is carried out until its end:
-
•
-
•
Note that in some cases the MLN reasoner may not detect the end of a started activity. This may happen when the patient does not complete that activity at all due to some abnormal behavior; for instance, if the patient sets up the table but forgets to have meal, we consider the activity having dinner incomplete. In that case, we post-process the MLN results and we consider the activity ended after a maximum time threshold has expired since its start.
The weights of the soft formulae are learned using a training set of sensor events acquired during the execution of the considered activities. Soft formulae with learned weights and hard formulae are then used to compute MAP inference on new data coming from the semantic integration layer.
III-D Modeling abnormal behaviors
As anticipated, our method relies on medical models of abnormal behaviors that may indicate the onset of MCI. In order to acquire those models, we collaborated with cognitive neuroscience experts from the Institute Fatebenefratelli111IRCCS (Research and Care Institute) St John of God Clinical Research Centre, Brescia – http://www.irccs-fatebenefratelli.it, Lombardy –a leading center in the field of mental health research and research on neurodegenerative disorders– within the SECURE222SECURE: Intelligent System for Early Diagnosis and Follow-up at Home, http://secure.ewlab.di.unimi.it/ research project funded by Lombardy region and MIUR Italian ministry. Those anomalies have been selected during different project meetings among the technical and medical partners of the SECURE project, based on the medical practice and relevant literature [4]. For the sake of this work, we have considered anomalies related to food preparation, food consumption, and compliance to medical prescriptions. The anomalies are defined in natural language by the clinicians; e.g., “an anomaly occurs when the patient prepares a meal but forgets to consume it”.
| No. | Rule | Anomaly type |
|---|---|---|
| 1 | Critical replacement: the patient has placed a food item that needs refrigeration inside a non-refrigerated cabinet. | |
| 2 | minutes | Non-critical anomaly: the patient spent too much time to prepare breakfast. |
| 3 | Critical omission: the patient has not retrieved a prescribed medicine in due time. | |
| 4 | Wrong activity: the patient has taken a medicine that was not prescribed. |
In our model, each IADL performed by a patient consists of a sequence of simple actions, which we call “steps”. For instance, a patient could perform the IADL “taking medicines” by executing this sequence of steps: open the medicine repository, retrieve the medicine box, return the medicine box, close the medicine repository. In order to facilitate their analysis, we classified anomalies in the following categories:
-
•
Non-critical anomaly. An anomaly is considered as non-critical when the patient skips a relevant step while performing a IADL, or spends too much time to perform the activity, but still he is able to complete the activity correctly. For instance, we consider a non-critical anomaly to occur when the patient forgets to close a repository after taking something from it. Non-critical anomalies can be considered as minor indicators of possible cognitive disorders, only if they occur more frequently than expected, or if their temporal trend significantly increases with time.
-
•
Critical anomaly. A critical anomaly occurs when the patient skips some necessary step while performing an activity, forgets to execute a required activity, or performs the activity more times than expected. Critical anomalies are stronger indicators of possible MCI onset. These anomalies are further divided into four categories:
-
–
Omission: there are some steps in each IADL which are necessary and it is mandatory for the patient to perform them in order to complete the activity correctly: a critical omission occurs when the patient skips any of such steps. For instance, a critical omission related to the activity “taking medicines” is: “the patient forgets to retrieve the prescribed medicine during the prescribed time’.
-
–
Replacement: this anomaly occurs when, during a IADL, a patient replaces a correct step with a wrong one; for instance, “the patient has placed the butter inside a non-refrigerated cabinet”.
-
–
Wrong activity: it occurs when the patient performs an activity that should not be done. For instance, this anomaly occurs when the patient takes a medicine that was not prescribed.
-
–
Repetition: this anomaly occurs when the patient repeats the same activity more times than expected; for instance, when the patient consumes the morning breakfast twice in a day.
-
–
However, human behaviors are characterized by wide variability; factors such as contextual conditions, individual habits and personality traits may determine the execution of various anomalies that are not necessarily due to cognitive impairment. This is especially true for non-critical anomalies, as leaving repositories open, which may be normally done by cognitively healthy people for negligence or hastiness.
Hence, while the considered anomalies are indicators of possible abnormal behaviors, they are not intended to provide an automatic diagnosis of the patient’s cognitive status. For instance, consider the example of wrong activity given above: the fact that the patient takes a medicine that was not prescribed is critical if he does it unintentionally (e.g., for a memory disorder). In other cases it may be a normal behavior; e.g., if the patient intentionally takes an over-the-counter drug that does not interfere with his medical prescriptions. Therefore, the frequency of detected anomalies and their temporal trend are used as a mean to trigger alarms to the practitioners for further inspecting the history of detected anomalies and their fine-grained descriptions.
In order to automatically reason with anomalies, we represent them as rules in propositional logic. The anomalies are represented by the predicate anomaly(Categ, Obj, Time). Categ defines the category of the anomaly. Obj defines the objects or activities involved in the anomaly; for example, in case of a critical omission, the missed medicine may be the object related to that anomaly. Time defines the time (e.g., day, or exact instant) at which the anomaly has happened. Table I shows the representation of a few anomalies. The semantics of not is the one of negation as failure [18]. Predicate prescribed(,,) states that the patient must take medicine from time to time of the current day. Medicine(o) (resp. Food(o)) states that object is a medicine box (resp. food item). Action() states that the patient executed action on objects and at time . Holds(,,,) states that the status of object has been “” from to (for instance, “the microwave oven has been on from 11:30 to 11:55”). The Holds predicate allows us to express temporal conditions that are useful in the definition of different anomalies. Temporal expressions that we use in our rule-based definitions include the interval of time during which an action is performed, the temporal distance between two actions, the temporal duration of an activity, the temporal order among activities.
III-E Recognizing abnormal behaviors
Abnormal behaviors are recognized by a knowledge-based inference engine, which periodically (e.g., at the end of each day) evaluates the rule-based anomaly definitions considering the data acquired and inferred during the considered time period: activity boundaries, actions and sensor events, as well as external knowledge including the medical prescriptions of the patient and the classification of objects in categories. Those data are represented by the predicates introduced in Section III-D, and added to the propositional logic knowledge base.
Example 3
Consider an elderly person living independently at home. Suppose that furniture and devices, including food cabinets and the fridge, are equipped with a magnetic sensor to detect the open and close actions. An RFID tag is attached to some food boxes to identify their content (e.g., rice, milk, coffee, sugar). RFID readers in the proximity of the cabinets and fridge are in charge of detecting which item has been retrieved or returned. Suppose that at 08:05 AM the patient opens the fridge and retrieves the milk box to prepare breakfast. Then after a few minutes he mistakenly puts the milk box in the non-refrigerated food cabinet and closes its door. Hence, based on the sensed events, the following axioms are automatically added to the knowledge base:
| action(open, door, , :: AM). | ||
| action(retrieve, , , :: AM). | ||
| action(return, , , :: AM). | ||
| action(close, door, , :: AM). |
Since the knowledge base contains the axioms RefFood(m) (stating that the milk box contains a food item that must be kept refrigerated) and NonRefStorage(c) (stating that is a non-refrigerated storage), rule in Table I fires, recognizing an abnormal behavior.
IV Experimental evaluation
In order to evaluate the FABER technique we developed a prototype of the system in a smart home lab, we acquired a large dataset of both normal and abnormal behaviors, and we executed experiments to evaluate the effectiveness of the system.
IV-A Software implementation

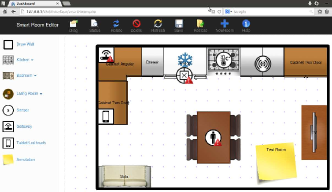
A prototype implementation of the whole system has been developed within the activities of the SECURE project. Since the FABER system is intended to run on a mobile device at the patient’s home, the core software modules have been implemented in Java for the Android platform. Figure 2(a) shows the application running the FABER software. In particular, in order to implement the technique for activity boundary detection we have used the Java libraries of Markov TheBeast [19], which allow to solve MAP integer linear programming problems through a cutting plane inference meta algorithm. In order to evaluate the rule-based definitions of anomalies we used the APIs of TuProlog [20], a lightweight Java implementation of an inference engine for the well-known Prolog logic programming language.
Currently, most sensor motes available on the market communicate using the ZigBee protocol, and there is no standard interface for that protocol on most Android devices. Hence, we use a gateway installed in the smart home to receive ZigBee messages from sensors and forward them via Bluetooth to the Android device. Sensor motes have been programmed in the C++ language to communicate new data to the gateway at the occurrence of each event of interest. For instance, the pressure sensor attached to the kitchen chair seat communicates the measured pressure when it exceeds or falls behind some given thresholds, to detect when the patient stands up or sits down on the chair. Such thresholds have been determined empirically. The sensor event message includes the timestamp of the sensor reading, the sensor ID and the detected value. In the current implementation, we use the Libelium Meshlium gateway, which runs a Linux OS. A C++ application running on the gateway is in charge of: receiving data from sensors, assigning the unique timestamps, locally storing the data in a PostgreSQL database, and periodically communicating the data to the Android application. At the end of each day, the Android app runs the FABER algorithms for activity boundary detection and anomaly recognition, and communicates the results through the Internet to the backend of the hospital center, where data are stored.
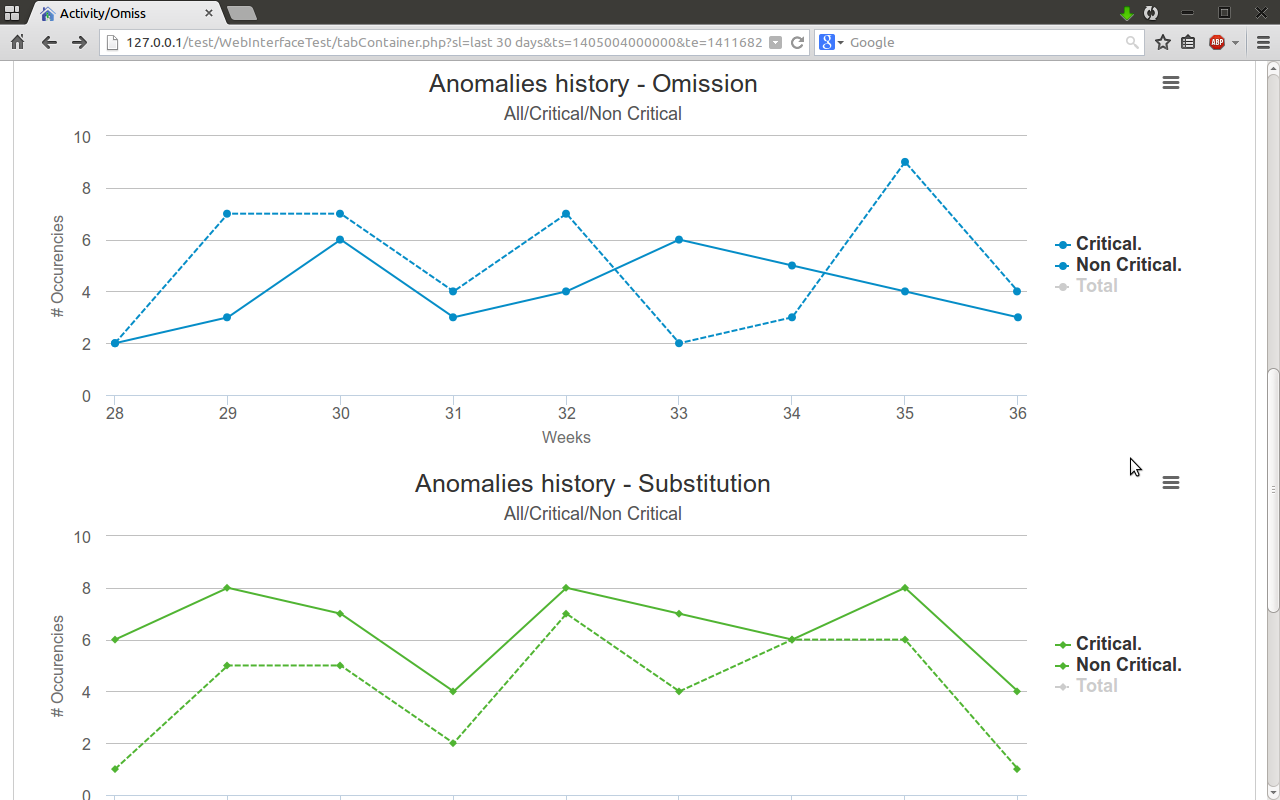
We have also developed a Web-based dashboard, shown in Figures 2(b) and 2(c), to allow technicians to inspect the status of the smart home infrastructure in order to identify possible issues (sensor failures, sensor battery exhaustion…), and to allow practitioners to analyze the history and trends of IADLs and abnormal behaviors.
IV-B Smart room environment
We have instrumented a room in a smart home lab with different kinds of sensors to detect low-level actions and events.
| Monitored items | Related sensors |
|---|---|
| Medicines boxes, Food items containers | RFID readers |
| Medicines cabinet, Fridge, Non-refrigerated food cabinet, Cooking pan cabinet, Silverware drawer | Magnetic sensors |
| Stove | Temperature sensor |
| Kitchen table | Presence sensor |
| Kitchen chair | Pressure sensor |

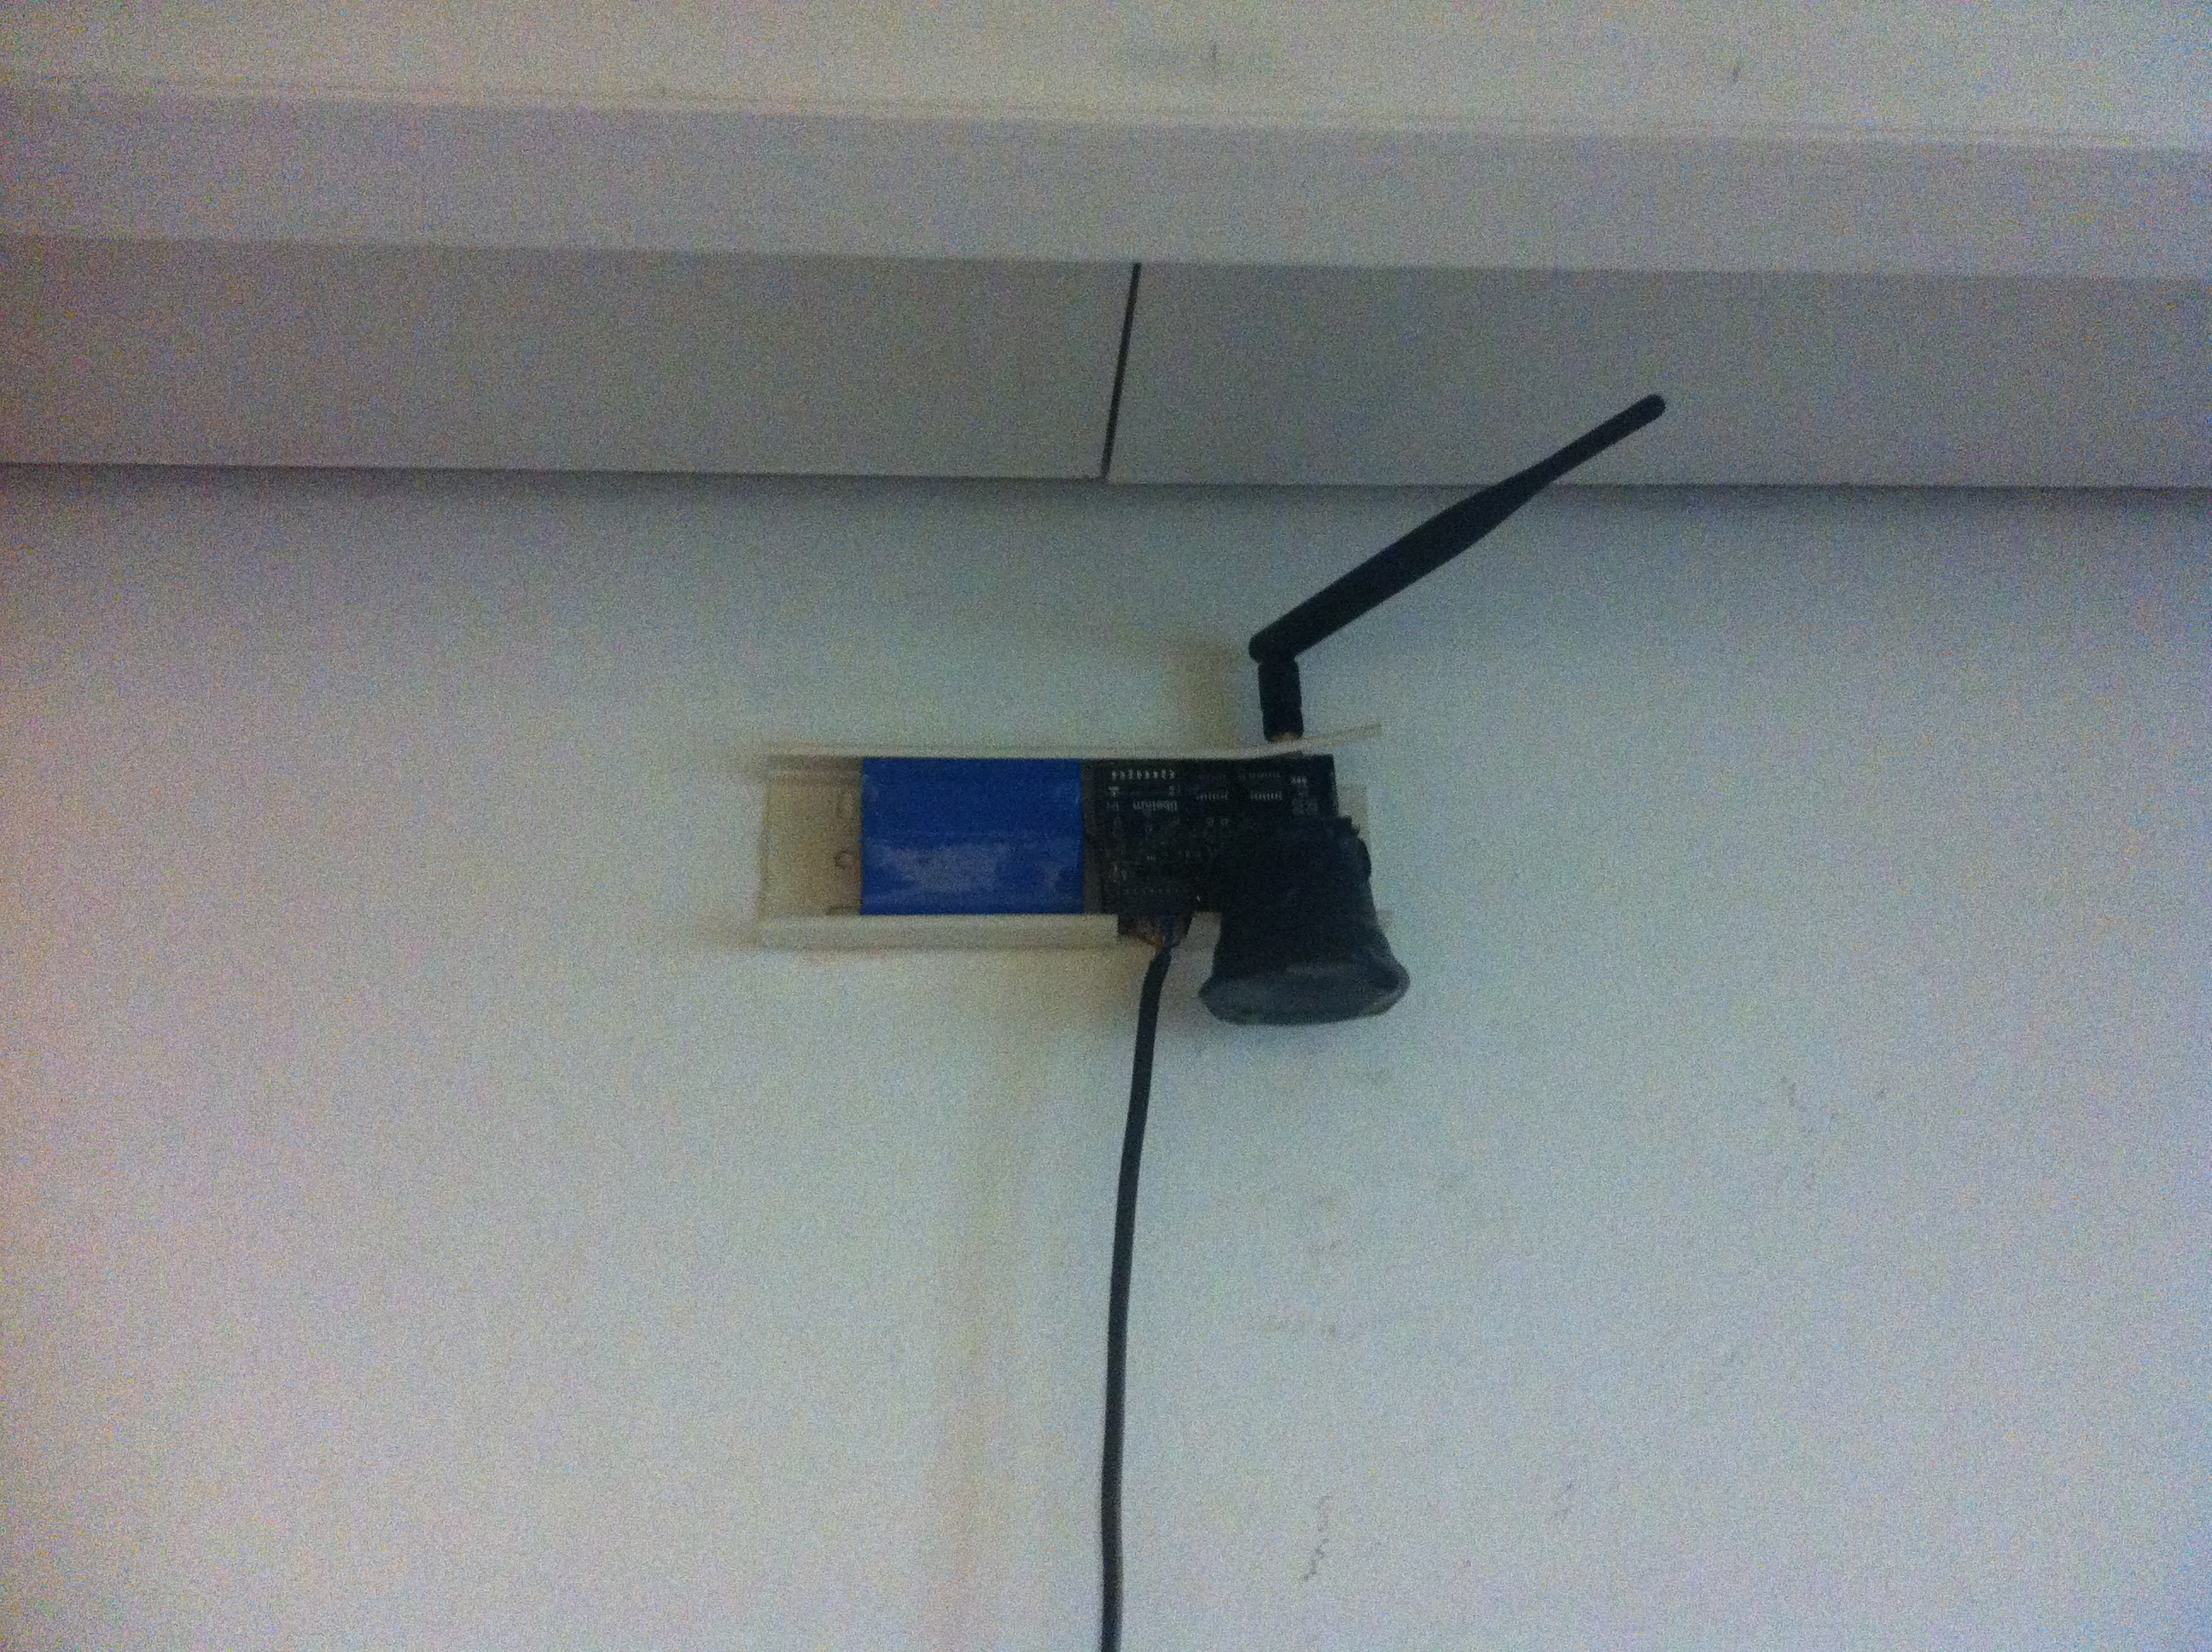
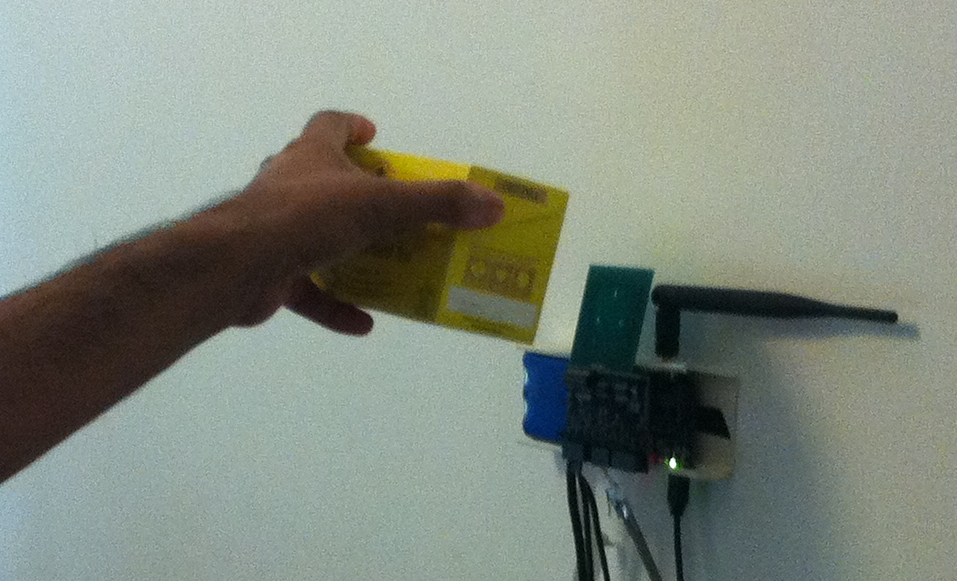
Table II shows the different kinds of sensors that have been deployed on various household items. Some of the used sensors are illustrated in Figure 3. RFID tags are attached to medicines and food packages. In the current prototype we assume that whenever a patient retrieves or returns an item with an attached tag, he passes the item’s tag near the RFID reader, in order to let the system identify the object. Of course, this method is inconvenient, especially for elderly people; in the future this method will be replaced exploiting more convenient tracking technologies. Magnetic sensors are used to monitor opening and closing of various repositories (e.g.; fridge, medicine cabinet…). A temperature sensor is used to detect if the patient is using the stove. A presence sensor is used to monitor the presence of the patient in the proximity of the dining table. A pressure sensor on the seat is used to understand if the patient is sitting at the kitchen chair.
IV-C Dataset acquisition
We have acquired a dataset of IADLs and anomalies, asking to voluntary actors to reproduce the daily routine of patients in our smart home lab. Executed IADLs and anomalies have been carefully designed in collaboration with neuroscience experts to realistically reproduce the behavior of two groups of elderly persons: healthy seniors (group 1), and elderly people with early symptoms of MCI (group 2). We assume that individuals of both groups live alone in their respective homes. During his one-day routine, each individual in group 1 does not execute any critical anomaly, but may execute a few non-critical ones. Individuals in group 1 are mainly used to evaluate the number of false positives produced by our anomaly recognition method. Group 2 individuals may perform several non-critical and critical anomalies during the day.
During the execution of the activities and anomalies, we have acquired the timestamped data coming from the sensors deployed in the smart home and manually annotated the dataset with the start- and end-time of activities and anomalies. The following IADLs have been selected to validate our method:
-
•
Preparing food: the patient has to prepare the daily meals (breakfast, lunch, dinner) at appropriate times.
-
•
Consuming meal: when the patient prepares a meal, he has to consume it within a reasonabile time period.
-
•
Taking medicines: the patient has to take the prescribed medicines in the due time. We assume that no smart dispenser is used; instead, we assume that the patient keeps all the medicines in a dedicated cabinet.
We have considered the following anomalies:
-
•
Non-critical anomalies. They happen when the individual: (NC1) forgot a repository open; (NC2) did not return a medicine to its cabinet; (NC3) retrieved a food item which must be cooked, but did not use the stove burner; (NC4) does not prepare a meal.
-
•
Critical anomalies. They happen when the individual: (C1) did not retrieve a prescribed medicine in the due time; (C2) took a medicine that was not prescribed; (C3) took a prescribed medicine in the due time but multiple times, resulting in inappropriate dosage; (C4) did not turn off the stove burner after finishing to prepare a hot meal; (C5) did not take the silverware before consuming meal; (C6) did not consume the meal after having prepared it; (C7) turned the stove burner on but did not take any cooking pan.
Totally, our dataset contains days of IADLs and anomalies. Group 1 individuals did 7 non-critical and 0 critical anomalies; group 2 individuals did 29 non-critical and 28 critical anomalies.
IV-D Experimental setup
We experimentally evaluated the FABER method using a -fold cross-validation process. The dataset was partitioned into portions, each corresponding to the data acquired during the one-day activities of a different individual. For each experiment we used portions as training set and the remaining one as test set. This process was iterated times, using each partition exactly once as test set. The prediction’s quality was evaluated in terms of the standard measures of precision, recall and score (the latter is the harmonic mean of precision and recall).
Since the anomaly recognition technique relies on detected activity boundaries, we first needed to experimentally choose the value of parameter , corresponding to the length of the temporal sequence of sensor events to be used by our MLN-based method. Then, we applied both the activity boundary detection method using the chosen value, and the anomaly recognition technique to evaluate the effectiveness of the whole technique.
IV-E Results
IV-E1 Choice of the MLN model
As explained in Section III-C3, activity boundary detection relies on a trained MLN that analyzes temporal sequences of consecutive sensor events. The optimal choice of depends on many factors, including the monitored activities, the characteristic of the environment and the available sensors. Hence, we performed a -fold cross-validation process to experimentally choose the value.

Results are shown in Figure 4. With , the recognition performance was quite low; this indicates that it is impossible to accurately detect the start/end times of activities based on one-sensor data only. The reason is that the same sensor event may be fired by the execution of different IADLs, or by the execution of both the start and the end of a given activity. We can observe that the value of recall was lower than the one of precision. This means that the MLN-based method, which tries to maximize the probability of the predicted boundaries, failed to recognize several boundaries due to the lack of sufficient information to support their prediction. Hence, it obtained a large number of false negatives but a lower number of false positives.
The overall accuracy improved using . This result indicates that longer temporal sequences of sensor events are stronger indicators of IADLs start- and end-times. Indeed, with the system achieved good levels of detection, with precision, recall and score larger than . Using values of larger than did not provide advantages in terms of accuracy, while complicating the MLN model. Hence, in the following experiments we set the value of to and we used the following soft formulae:
-
•
+++
-
•
+++
-
•
+++
-
•
+++
-
•
++++
-
•
++++
IV-E2 Anomaly recognition
| ANOMALY | GROUP 1 | GROUP 2 | ||||
| TP | FP | FN | TP | FP | FN | |
| NC1: Repository left open | 5 | 0 | 2 | 14 | 0 | 0 |
| NC2: Medicine not returned | 0 | 0 | 0 | 4 | 0 | 0 |
| NC3: Food item not cooked | 0 | 0 | 0 | 2 | 0 | 0 |
| NC4: Meal not prepared | 0 | 2 | 0 | 0 | 1 | 0 |
| C1: Missed a prescr. medicine | 0 | 2 | 0 | 10 | 0 | 0 |
| C2: Took a wrong medicine | 0 | 0 | 0 | 7 | 0 | 0 |
| C3: Repeated medicine intake | 0 | 0 | 0 | 3 | 0 | 0 |
| C4: Stove burner left on | 0 | 0 | 0 | 0 | 0 | 0 |
| C5: Had meal with no silverware | 0 | 0 | 0 | 7 | 0 | 0 |
| C6: Prepared meal not consumed | 0 | 0 | 0 | 1 | 1 | 0 |
| C7: Burner turned on by mistake | 0 | 0 | 0 | 8 | 0 | 0 |
| TOTAL | 5 | 4 | 2 | 48 | 2 | 0 |
| ANOMALY TYPE | PRECISION | RECALL | F1 SCORE |
|---|---|---|---|
| Non-critical | |||
| Critical | |||
| TOTAL |
Results of anomaly recognition are reported in Table III. Each row of the table corresponds to a specific anomaly considered in our experiments. The TP column reports the number of true positives for that anomaly; i.e., the number of actual occurrences of that anomaly that were recognized by FABER. FP reports the number of false positives; i.e., the number of anomalies reported by FABER that did not actually occur. FN reports the number of actual occurrences of that anomaly that were not recognized by FABER.
As anticipated, group 1 individuals performed a few non-critical anomalies (NC) and no critical anomaly (C). The system correctly recognized NCs out of . Looking closely at the data, we discovered that in two cases the system did not detect NC1 (repository left open) due to a failure of the magnetic sensor, which did not communicate the opening of the medicine drawer. This kind of issue can be addressed by introducing redundancy in the sensing infrastructure. During the 7 days activities of group 1 individuals, the system did false positives. Two of them regarded NC4 (meal not prepared), while the other two regarded C1 (missed a prescribed medicine). These errors were due to mispredictions of the activity boundary detection technique, which in two cases did not recognize the occurrence of activity “preparing meal” and in two cases did not recognize the occurrence of “taking medicine”. Hence, the FP rate could be reduced by using more and/or better sensors, as well as more effective activity recognition methods, to improve the performance of the activity boundary detection technique.
Group 2 individuals performed a larger number of NCs and several Cs. For this group, FABER correctly recognized all the occurrence of both critical and non-critical anomalies; i.e., no false negatives happened. During the 14-days activities of that group, the system reported only 2 false positives: one was related to NC4 (meal not prepared) and the other one to C6 (prepared meal not consumed). Even in these cases, false positives were due to mispredictions of the activity boundary detection technique.
Overall, the system produced 6 false positives during the 21-days activities of the two groups. We claim that the number of false positives is compliant with the requirements of clinicians, especially considering that the individuals totally performed more than instances of activities during the experimentation. Table IV reports the results in terms of precision, recall and F1 score. The achieved precision was close to . This relatively low value was mainly due to missed activity boundary detection by the MLN-based technique. However, the precision of critical anomaly recognition is significantly higher than the one of non-critical anomaly recognition. When activity boundaries were correctly recognized, in most cases FABER recognized the occurred anomalies, achieving an overall recall larger than . A preliminary clinicians’ assessment of the FABER system can be found in [21].
V Conclusions and future work
In this paper we addressed the challenging issue of unobtrusively recognizing abnormal behaviors exhibited by elderly persons at home. We have proposed the FABER hybrid technique to recognize anomalies at a fine-grained level, based on the integration of supervised learning and symbolical reasoning, and on sensor data acquired from the smart-home infrastructure. Differently from existing approaches, our method provides detailed information about the detected anomalies, which can be exploited by practitioners for early detection of MCI. We designed the models of anomalies collaborating with cognitive neuroscience experts, and we implemented a prototype of FABER in a smart home lab. Experiments with a dataset of activities and anomalies show that FABER achieves high recall while generating a small number of false positives.
The achieved results are promising, but we plan to improve this work in several directions. Since both activity recognition and sensor data acquisition are prone to inaccuracy, a first improvement may be extending our technique to more extensively support reasoning with uncertainty. Currently we use MAP inference to compute the most probable activity boundaries; hence, the predicted boundaries are not associated to a confidence level. We will investigate different MLN inference methods (e.g., marginal inferencing) to compute probabilistic activity boundaries. More importantly, our current anomaly recognition method is based on non-probabilistic rules that strictly determine the detection of an abnormal behavior based on a user-defined set of observations. We consider extending this rigid system with probabilistic reasoning, possibly by means of a probabilistic logic. Other future work includes addressing the case of multi-inhabitants, concurrent and interleaved activities. Finally, we are working closely with clinicians to extend the set of significant anomalies to be monitored and we are already conducting experiments in the patients’ homes.
Acknowledgments
This work has been partially supported by the project “SECURE: Intelligent System for Early Diagnosis and Follow-up at Home”, funded by a grant of Lombardy Region and Italian Ministry of Education, University and Research.
References
- [1] B. Rechel, E. Grundy, J.-M. Robine, J. Cylus, J. P. Mackenbach, C. Knai, and M. McKee, “Ageing in the European Union,” The Lancet, vol. 381, no. 9874, pp. 1312–1322, 2013.
- [2] R. C. Petersen, G. E. Smith, S. C. Waring, R. J. Ivnik, E. G. Tangalos, and E. Kokmen, “Mild Cognitive Impairment: Clinical Characterization and Outcome,” Arch Neurol, vol. 56, no. 3, pp. 303–308, 1999.
- [3] B. Winblad et Al., “Mild cognitive impairment - beyond controversies, towards a consensus,” J Intern Med, vol. 256, no. 3, pp. 240–246, 2004.
- [4] A. Burns, B. Lawlor, and S. Craig, “Rating scales in old age psychiatry,” Br J Psychiatry, vol. 180, pp. 161–7, 2002.
- [5] D. Riboni, C. Bettini, G. Civitarese, Z. H. Janjua, and R. Helaoui, “Fine-grained recognition of abnormal behaviors for early detection of mild cognitive impairment,” in Proc. of PerCom’15, to appear. IEEE Comp. Soc., 2015.
- [6] C. Parsey and M. Schmitter-Edgecombe, “Applications of technology in neuropsychological assessment,” Clin Neuropsychol, vol. 27, no. 8, pp. 1328–1361, 2013.
- [7] A. Seelye, M. Schmitter-Edgecombe, D. Cook, and A. Crandall, “Naturalistic assessment of everyday activities and prompting technologies in mild cognitive impairment,” J Int Neuropsychol Soc, vol. 19, no. 4, pp. 442–452, 2013.
- [8] T. Hayes, F. Abendroth, A. Adami, M. Pavel, T. Zitzelberger, and J. Kaye, “Unobtrusive assessment of activity patterns associated with mild cognitive impairment,” Alzheimers Dement., vol. 4, no. 6, pp. 395–405, 2008.
- [9] P. Dawadi, D. Cook, M. Schmitter-Edgecombe, and C. Parsey, “Automated assessment of cognitive health using smart home technologies,” Technol Health Care, vol. 21, no. 4, pp. 323–343, 2013.
- [10] P. Dawadi, D. J. Cook, and M. Schmitter-Edgecombe, “Automated cognitive health assessment using smart home monitoring of complex tasks,” IEEE Trans Syst Man Cybern, vol. 43, no. 6, pp. 1302–1313, 2013.
- [11] P. Dawadi, D. Cook, C. Parsey, M. Schmitter-Edgecombe, and M. Schneider, “An approach to cognitive assessment in smart home,” in Proc. of the 2011 DMMH Workshop. ACM, 2011.
- [12] D. J. Cook and M. Schmitter-Edgecombe, “Assessing the quality of activities in a smart environment,” Methods Inf Med, vol. 48, no. 5, pp. 480–485, 2009.
- [13] P. P. Oluwatoyin and K. Wang, “Video-based abnormal human behavior recognition - A review,” IEEE Trans Syst Man Cybern, vol. 42, no. 6, pp. 865–878, 2012.
- [14] D. Riboni and C. Bettini, “Owl 2 modeling and reasoning with complex human activities,” Pervasive and Mobile Computing, vol. 7, no. 3, pp. 379–395, 2011.
- [15] L. Getoor and B. Taskar, Introduction to Statistical Relational Learning. MIT Press, 2007.
- [16] P. Domingos and M. Richardson, “Markov logic: A unifying framework for statistical relational learning,” in Proc. of ICML’04, 2004, pp. 49–54.
- [17] R. Helaoui, M. Niepert, and H. Stuckenschmidt, “Recognizing interleaved and concurrent activities using qualitative and quantitative temporal relationships,” Pervasive Mob Comput, vol. 7, no. 6, pp. 660 – 670, 2011.
- [18] P. Norvig and S. Russell, Artificial Intelligence. A Modern Approach. Prentice Hall Series in Artificial Intelligence, 2003.
- [19] S. Riedel, “Improving the accuracy and efficiency of map inference for markov logic,” in Proc. of UAI’08. AUAI Press, 2008, pp. 468–475.
- [20] E. Denti, A. Omicini, and A. Ricci, “Multi-paradigm java-prolog integration in tuprolog,” Sci. Comput. Program., vol. 57, no. 2, pp. 217–250, 2005.
- [21] D. Riboni, C. Bettini, G. Civitarese, Z. H. Janjua, and V. Bulgari, “From lab to life: Fine-grained behavior monitoring in the elderly’s home,” in Proc. of PerCom Workshops. IEEE Comp. Soc., 2015.