The VMC Survey – XIV. First results on the look-back time star-formation rate tomography of the Small Magellanic Cloud††thanks: Based on observations made with VISTA at ESO under programme ID 179.B-2003
Abstract
We analyse deep images from the VISTA survey of the Magellanic Clouds in the filters, covering 14 deg2 (10 tiles), split into 120 subregions, and comprising the main body and Wing of the Small Magellanic Cloud (SMC). We apply a colour–magnitude diagram reconstruction method that returns their best-fitting star formation rate SFR, age–metallicity relation (AMR), distance and mean reddening, together with 68% confidence intervals. The distance data can be approximated by a plane tilted in the East–West direction with a mean inclination of , although deviations of up to kpc suggest a distorted and warped disk. After assigning to every observed star a probability of belonging to a given age–metallicity interval, we build high-resolution population maps. These dramatically reveal the flocculent nature of the young star-forming regions and the nearly smooth features traced by older stellar generations. They document the formation of the SMC Wing at ages Gyr and the peak of star formation in the SMC Bar at Myr. We clearly detect periods of enhanced star formation at 1.5 Gyr and 5 Gyr. The former is possibly related to a new feature found in the AMR, which suggests ingestion of metal-poor gas at ages slightly larger than 1 Gyr. The latter constitutes a major period of stellar mass formation. We confirm that the SFR was moderately low at even older ages.
keywords:
Hertzsprung-Russell (HR) and C-M diagrams – Magellanic Clouds1 Introduction
Owing to its proximity, significant mass, and ongoing star formation, the Small Magellanic Cloud (SMC) represents a fundamental laboratory for studies of stellar and interstellar medium (ISM) processes. It contains a rich population of star clusters, associations, stellar pulsators, primary distance indicators, and stars in short-lived evolutionary stages (Westerlund, 1990; Bica & Schmitt, 1995; Bolatto et al., 2007; Soszyński et al., 2010a, b, 2011), with metallicities systematically lower than those observed in the Large Magellanic Cloud (LMC) and Milky Way (MW) galaxies.
The SMC is probably the largest among the Local Group galaxies in which a disk cannot be identified at first sight. Its optical appearance on the sky is dominated by an elongated bar-like structure in the direction NE–SW, from which a prominent Wing departs to the east, in a direction that joins the Magellanic Bridge and the LMC (Nidever et al., 2011). In addition, there have been consistent claims of depth structures being detected along different lines-of-sight (Gardiner & Hawkins, 1991; Nidever et al., 2013), and the growing awareness that the Bridge is, at least partially, a tidally-stripped component extending towards the LMC (Harris, 2007; Nidever et al., 2013). Needless to say, any work on stellar or ISM physics can only be complicated by this particular morphology.
The star formation history (SFH) of the SMC also carries along the signs of a disturbed past, probably marked by the interactions with the LMC111Although possible past interactions with the Milky Way are presently disfavoured (Besla et al., 2007), they might have occurred at ages larger than 4 Gyr, depending on the precise mass of the galaxies involved (Kallivayalil et al., 2013; Gómez et al., 2014).. The presence of periods of enhanced star and cluster formation has for long been recognized, as well as a relative paucity of very old populations (e.g. Harris & Zaritsky, 2004; de Grijs & Goodwin, 2008; Noël et al., 2009; Piatti, 2011c; Cignoni et al., 2012, 2013a; Weisz et al., 2013)222The presence of a very old population is demonstrated by the presence of 2475 RR Lyrae (Soszyński et al., 2010b) detected by the OGLE III survey.. This disturbed past became even more evident with the discovery that a fraction of SMC stars has been captured by the LMC (Olsen et al., 2011).
The VISTA Survey of the Magellanic Clouds (VMC; Cioni et al., 2011) was designed to greatly enhance our knowledge of the Magellanic system, via near-infrared photometry of the bulk of their stars, down to depths reaching the oldest turn-offs in both the LMC and SMC (Kerber et al., 2009). The advantage over previous deep-and-wide surveys resides mainly in the use of near-infrared wavelengths, that provide a view of the stellar populations almost unaffected by dust. The near-infrared light is also dominated by cool giants and subgiants, hence better sampling the intermediate-age populations over the young ones. In addition to depth, VMC provides twelve-epochs photometry in the -band, allowing us to derive tighter period–luminosity relations for variables and more stringent constraints on the distances (e.g. Ripepi et al., 2012) and possible structures along the line of sight (Moretti et al., 2014).
In this paper, we analyse the VMC photometry of the SMC in terms of SFH and geometry. It constitutes the natural follow-up of the papers by Kerber et al. (2009) and Rubele et al. (2012), in which the method for SFH-recovery from VMC data was first planned and tested, and the first analysis of the LMC data was performed, respectively. Since then, an impressive amount of data has been collected for the SMC galaxy, allowing us to perform a similar analysis. Present data for the SMC comprise most of its stellar mass, all of its bar, and a significant fraction of its Wing, as well as a few outer regions.
The structure of this paper is as follows. Sect. 2 presents the new VMC data and the PSF photometry. Sect. 3 details the method adopted for the derivation of the SFH and AMR, and their errors, as well as the best-fitting mean distances and reddenings for every subregion of a tile. Sect. 4 discusses all the derived trends, also in comparison with previous results in the literature. Finally Sect. 5 summarizes the main results and draws a few concluding comments.
| Tile | (deg, J2000) | (deg, J2000) | Completion in -band1 | Comments |
|---|---|---|---|---|
| SMC 3_3 | 11.1995 | 74.2005 | 92% | S extreme of bar |
| SMC 3_5 | 21.9762 | 74.0018 | 100% | S part of Wing |
| SMC 4_3 | 11.2810 | 73.1094 | 88% | SW part of densest bar |
| SMC 4_4 | 16.3303 | 73.0876 | 92% | central bar, slightly towards Wing |
| SMC 4_5 | 21.2959 | 72.9339 | 92% | central part of Wing |
| SMC 5_3 | 11.2043 | 72.0267 | 92% | NW of densest bar |
| SMC 5_4 | 16.1918 | 71.9850 | 100% | NE part of densest bar |
| SMC 5_6 | 25.4401 | 71.5879 | 88% | deg E of main body |
| SMC 6_3 | 11.4311 | 70.9266 | 78% | deg NW of main body |
| SMC 6_5 | 20.4138 | 70.7601 | 78% | deg NE of main body |
1 Here % completion corresponds to epochs in the -band or at least sec of integration time.
2 Data and photometry
2.1 Selected VMC data
All data used in this work come from the VMC survey, which is extensively described in Cioni et al. (2011). We use the v1.1 and v1.2 VMC data retrieved from the VISTA Science Archive (VSA; Hambly et al., 2004)333http://horus.roe.ac.uk/vsa/. More specifically, we start from the pawprints already processed by the VISTA Data Flow System (VDFS; Emerson et al., 2004) in its pipeline (Irwin et al., 2004). Individual pawprints are combined into deep tiles as described in Appendix A. The photometric zeropoints are discussed in Appendix B.
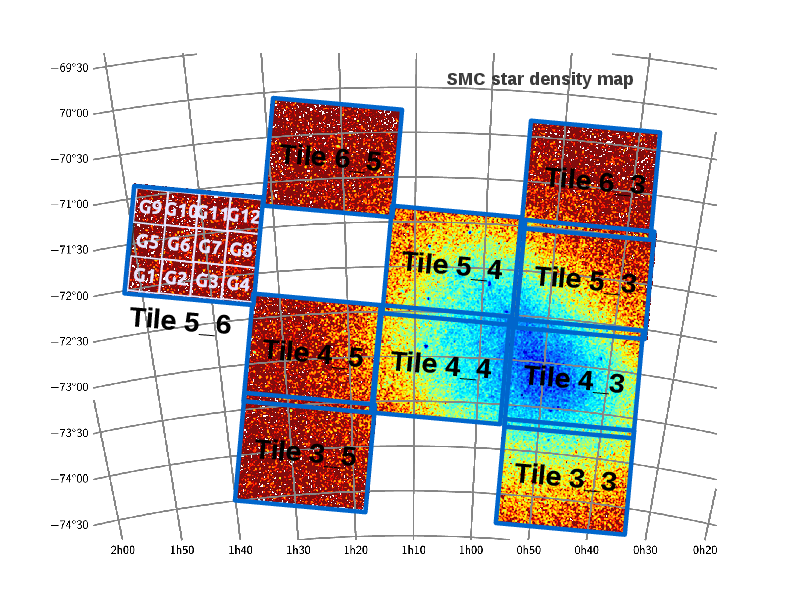
In this work we deal with the the ten SMC tiles for which we already have collected a large fraction/the whole set of multi-epoch photometry. They are illustrated in Fig. 1 and listed in Table 1. The background image in Fig. 1 is a density map of all VMC sources with mag and errors smaller than mag. Since this magnitude cut includes the red clump (RC) and the upper part of the red giant branch (RGB), the map is dominated by the intermediate-age and old stellar populations. It is immediately evident that our ten tiles cover most of the SMC main body, including all of its dense bar, which appears in Fig. 1 as a bean-like blue region across the tiles SMC 3_3, 4_3, 4_4, 5_3 and 5_4. In addition, the region analysed includes a large fraction of the so-called Wing (tiles SMC 3_5, 4_5 and 5_6), and more external regions towards the N and NE of the SMC (tiles SMC 6_3 and 6_5). We can confidently state that we have observed the majority of the SMC stellar mass, and the bulk of the young star formation. As we will see later, these observations also span a wide variety of SMC environments and distances.
2.2 PSF photometry and artificial star tests
We have produced homogenised deep tile images and performed PSF photometry on them, as described in Appendix A. Afterwards we correlated the three bands () photometry using a matching radius generating a multi-band catalog. Finally, we corrected our photometry for the aperture using as reference the VSA data release v1.2 (see Cross et al. 2012 and Irwin et al. 2004 for details).
Figure 2 shows the CMDs in vs. for the ten SMC tiles investigated to date. The different colours map the density of stars in the CMD. These CMDs will be further discussed in the next sections, together with the derived SFHs.
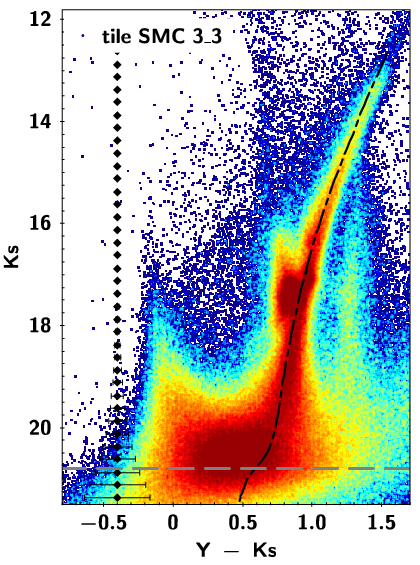
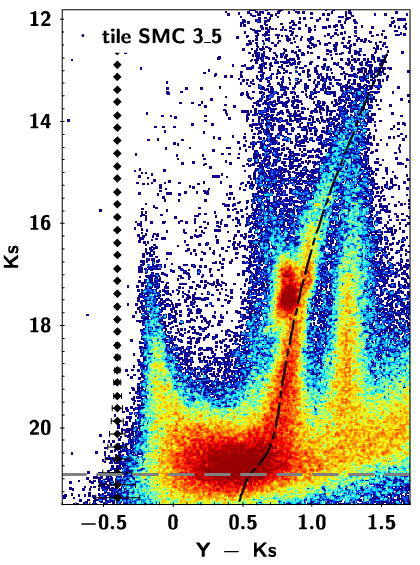
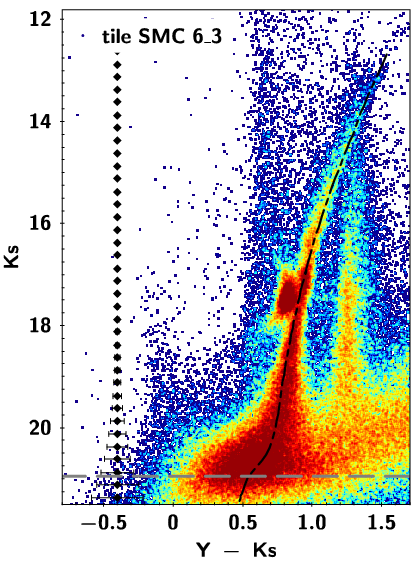
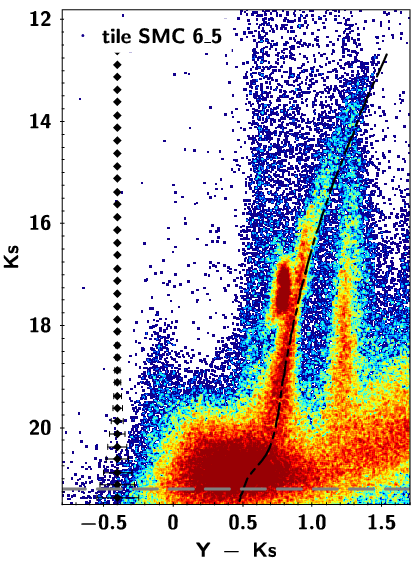
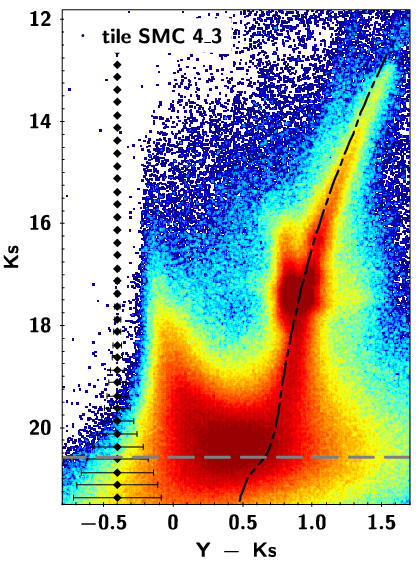
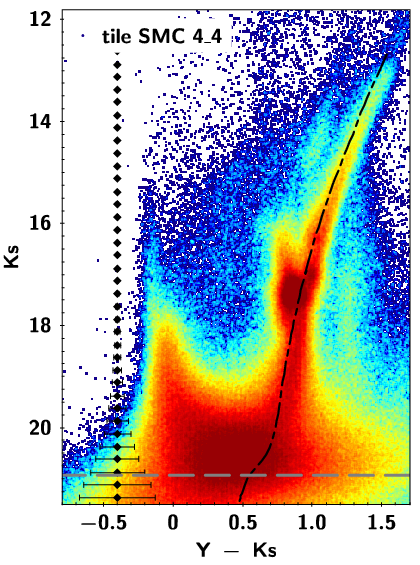
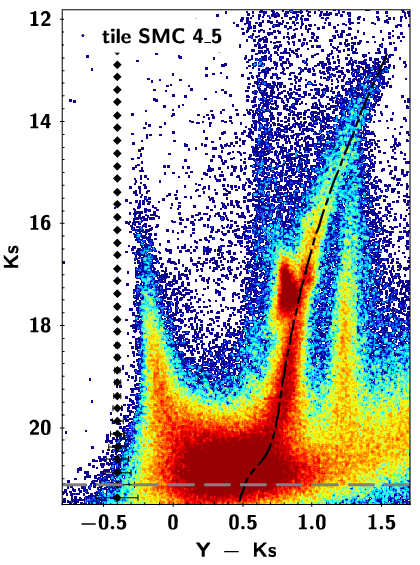
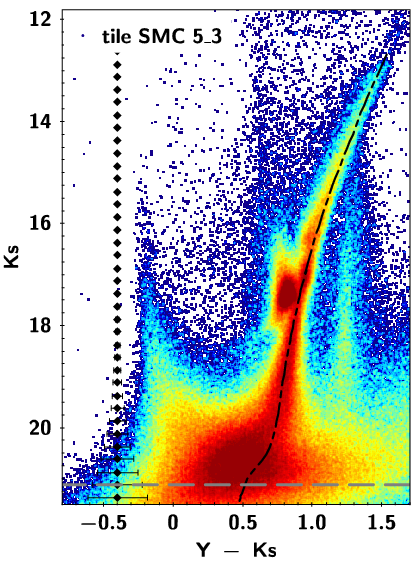
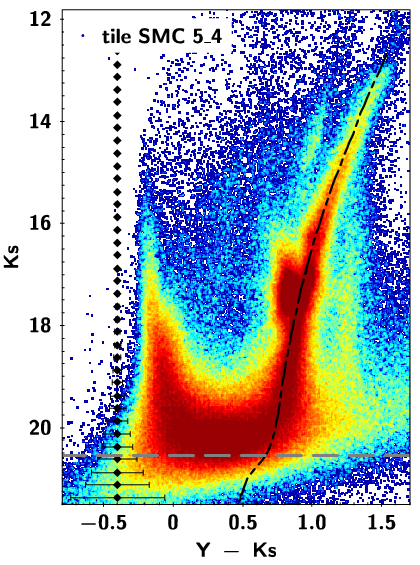
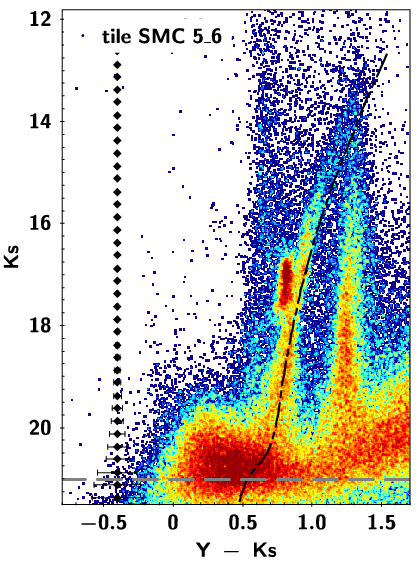
Very extensive artificial star tests (ASTs) were performed on the homogenized images, so as to completely map the distributions of photometric errors and completeness, as a function of colour, magnitude, and position. The process is the same as extensively described and illustrated in Rubele et al. (2012), with the only difference being that the photometry was made on the entire tile (see Appendix A). Suffice it to mention here that our typical 50% completeness limit in the outermost tiles turns out to be at about 22.3, 22.1 and 20.8 mag in the , and filters, respectively. In the more central tile SMC 4_3, the same limits are found at about 21.3, 21.1 and 20.6 mag, respectively.
In the following, we will only use VMC data and CMDs at magnitudes brighter than mag, hence ensuring that completeness never falls below the 50% level.
2.3 Defining subregions
All tiles, covering total areas of deg2 each, were subdivided into twelve subregions of ( deg2) for the SFH analysis. They are numbered from G1 to G12 as already illustrated in Fig. 1. Central coordinates are listed in Table 3.3 below. G1 is located at the SE extreme of each tile, G4 at the SW, G9 at the NE, and G12 at the NW.
The pawprints contributing to the corner subregion G1 (see Fig. 1) include a contribution from the “top” half of the VIRCAM detector number 16, which is known to show a significantly worse signal-to-noise ratio than the other detectors (see Rubele et al., 2012, for details). The effect is negligible in , small in and becomes more noticeable in the bluest VISTA passbands, i.e. in , and . Therefore part of subregions G1 of all tiles were excluded from our analysis.
3 Deriving the SFH
3.1 Overview of the method
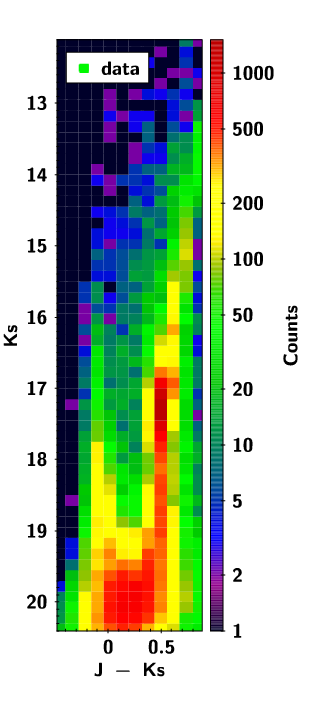
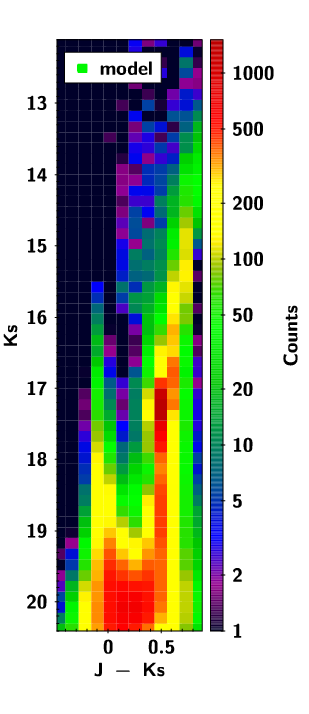
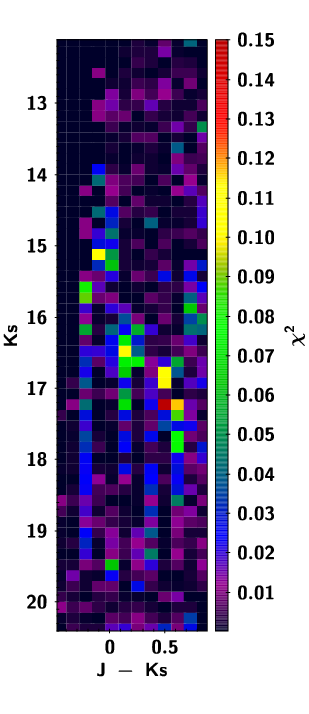
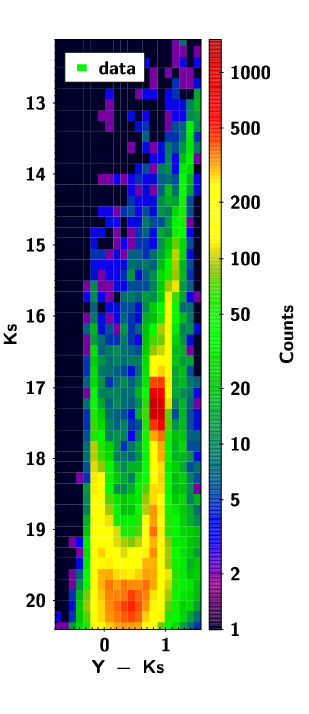
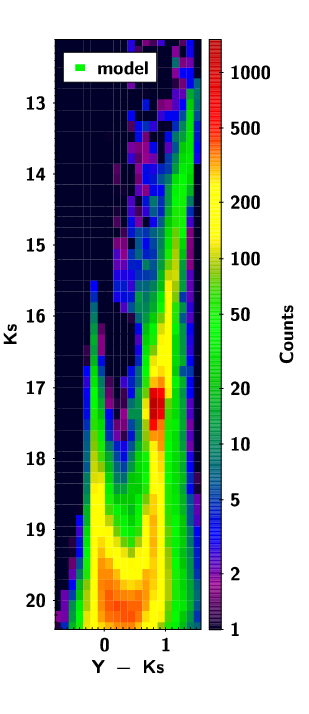
The method for deriving the SFH from VMC data has been already described extensively in Rubele et al. (2012). As a short summary, we recall that, for every subregion of a tile:
-
1.
We start assuming an absolute distance modulus, and -band extinction, .
-
2.
“Partial models” are derived for the entire range of metallicities and ages of relevance (see next section). Partial models are simply synthetic stellar populations each covering a small bin of age and metallicity, shifted to the desired distance and extinction, and representing a given total mass of formed stars. The extinction in each VISTA passband is derived from the assumed using the extinction coefficients computed from the Cardelli, Clayton & Mathis (1989) extinction curve with (see Girardi et al., 2008, for details), namely , and 444We choose to express the extinction in the band just for convenience in the subsequent comparisons with other authors (Sect. 4.3), although we will be actually dealing with the extinction in near-infrared pass-bands. Notice that the average LMC and SMC extinction curves are essentially indistinguishable from the MW one for all wavelengths redward of Å (see e.g. Gordon et al., 2003, figure 10), so that the choice of a near-infrared reference wavelength for the extinction, instead of , would lead essentially to the same results. .
-
3.
Finally, partial models are “degraded” to the conditions of the actual observations by applying the distributions of photometric errors and completeness implied by the ASTs, and translated into Hess diagrams, i.e. maps of the stellar density across the versus and versus CMDs. This involves a few steps: First, high-resolution Hess diagrams, with a resolution of 0.05 mag in magnitude and 0.04 mag in colour, are built from the synthetic stellar populations. For each one of these small boxes, all artificial stars of similar colour and magnitude are looked for in the AST database, in order to build two-dimensional histograms of the differences between the input and output magnitudes and colours, and compute the completeness fraction per box. The high-resolution Hess diagram is then degraded by applying these error distributions and completeness on a box-by-box basis, which has the effect of both spreading stars into the neigbouring boxes in the CMD, and reducing their numbers. Finally, the high-resolution degraded partial models are converted into Hess diagrams of normal resolution (namely 0.15 mag per 0.12 mag), which are used in the subsequent steps of the analysis.
-
4.
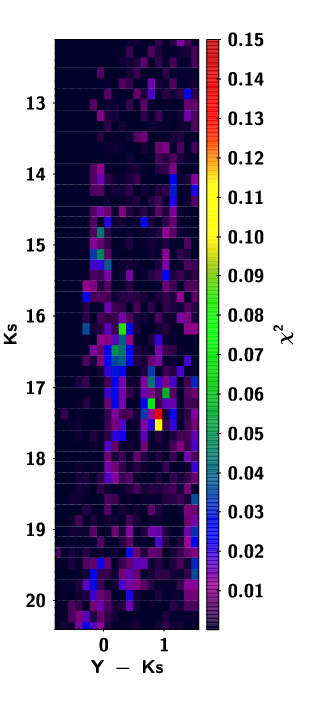
The linear combination of partial models that best-fit the observed Hess diagrams is found by the StarFISH optimization code by Harris & Zaritsky (2001), suitably adapted to our case. An example of a best-fit model is presented in Fig. 3. The coefficients of this linear combination of partial models are straightforwardly converted into the SFH. The best-fit solution is also characterized by the , that mesures the residuals between the best-fit model and the data.
-
5.
The same process is repeated over a range of different and values. This allows us to pin down the best-fit SFH, distance and extinction for each subregion, by simply looking for the minimum .
-
6.
One hundred synthetic realizations of the best-fit model are generated and are analysed via the same method. The dispersion in the resulting coefficients provides us the confidence levels of our best-fit SFH, and .
Several aspects of this process will be either better detailed or simply illustrated in the following, whenever relevant to understand the particular results we find for the SMC.
3.2 Partial models
| 6.9 | 0.10 | 0.25 | 0.40 | 0.55 | 0.70 |
|---|---|---|---|---|---|
| 7.4 | 0.10 | 0.25 | 0.40 | 0.55 | 0.70 |
| 7.8 | 0.10 | 0.25 | 0.40 | 0.55 | 0.70 |
| 8.1 | 0.10 | 0.25 | 0.40 | 0.55 | 0.70 |
| 8.3 | 0.20 | 0.35 | 0.50 | 0.65 | 0.80 |
| 8.5 | 0.20 | 0.35 | 0.50 | 0.65 | 0.80 |
| 8.7 | 0.20 | 0.35 | 0.50 | 0.65 | 0.80 |
| 8.9 | 0.40 | 0.55 | 0.70 | 0.85 | 1.00 |
| 9.1 | 0.55 | 0.70 | 0.85 | 1.00 | 1.15 |
| 9.3 | 0.55 | 0.70 | 0.85 | 1.00 | 1.15 |
| 9.5 | 0.70 | 0.85 | 1.00 | 1.15 | 1.30 |
| 9.7 | 0.85 | 1.00 | 1.15 | 1.30 | 1.45 |
| 9.9 | 1.15 | 1.30 | 1.45 | 1.60 | 1.75 |
| 10.075 | 1.45 | 1.60 | 1.75 | 1.90 | 2.05 |
Partial models for this work have been derived from PARSEC v1.0 evolutionary tracks (Bressan et al., 2012), which represent a major revision and update of the previous sets of Padova evolutionary tracks (namely Marigo et al., 2008; Girardi et al., 2010) used in Rubele et al. (2012). The most relevant changes, in the context of this work, are
-
•
the adoption of Caffau et al. (2011, and references therein) solar composition, with a present-day solar metal content of ;
-
•
the recalibration of the Solar Model so as to meet the stringent constraints imposed by helioseismology and by the radiometric age of the Solar System; this implies allowing microscopic diffusion to operate in low mass stars;
-
•
revised limits for the mass interval for which overshooting increases its efficiency, in low-mass stars.
The main consequence of these novelties are modest (though systematic) changes in the age and metallicity scale of stellar populations, at ages exceeding a few Gyr. The age scale is presently being tested on LMC/SMC intermediate-age star clusters for which we have HST data of excellent quality (e.g. Girardi et al., 2013; Correnti et al., 2014; Goudfrooij et al., 2014), so that we postpone further comments on this topic to future papers. Also, we recall that the present release of PARSEC tracks (v1.1 as of this writing) already includes modifications in the prescriptions for microscopic diffusion in low-mass stars, with respect to v1.0. We have checked that these changes are simply negligible in the range of magnitudes and colours sampled by the VMC data for the SMC.
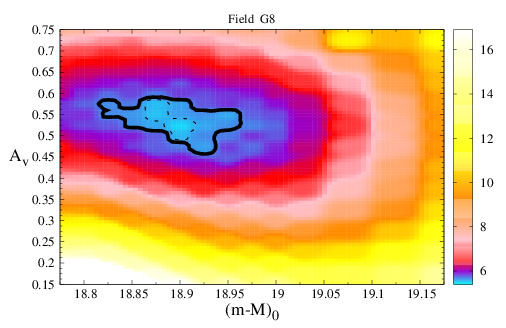
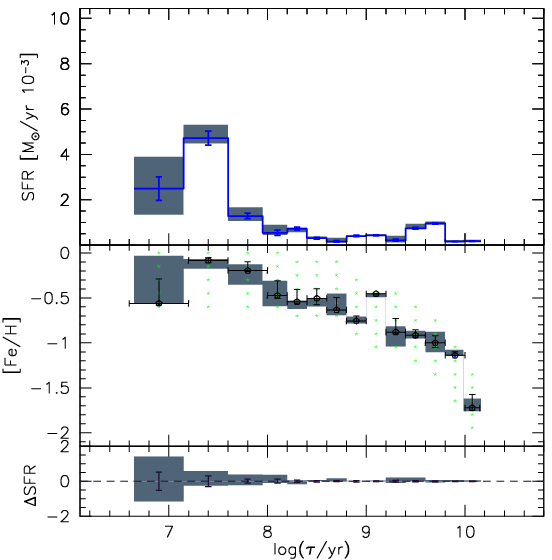
Table 2 displays the location of our partial models on the [Fe/H] vs. plane. Age bins are defined as in Rubele et al. (2012); they are, in general, at equally spaced intervals of dex, so as to reflect the fact that our age resolution is better at young ages. For the very youngest age bins, however, wider age intervals are used, so as to increase the statistics in places where the star counts are naturally very small.
A total of 5 partial models are created for every age bin. They have metallicities covering an interval of dex with respect to the reference metallicity. The latter is derived from the Piatti (2011c) AMR, which results from observations of SMC star clusters. Metallicity bins are separated by 0.15 dex from each other. It is important to remark that the Piatti (2011c) AMR is used just to define the location of partial models, but it has virtually no effect in determining the final AMR which will be derived from our data (see Sect. 4.6 later).
To this set, we add one partial model representing the Milky Way foreground. This is generated by running the TRILEGAL Milky Way model (Girardi et al., 2005)555http://stev.oapd.inaf.it/trilegal for the central coordinates of each subregion, and for the total area it represents.
We also note that partial models are computed for the entire range of distance moduli and extinctions explored in this work, namely and . At the high end of this distance/extinction ranges, the 10-Gyr main sequence turn-off might be located about 0.5 mag fainter than the mag limit being adopted in the derivation of the SFH. Anyway, this magnitude interval includes a good fraction of the subgiant branch for all ages, hence ensuring a good sensitivity to the old SFH. Moreover, we recall that the constraints on the oldest SMC populations do not depend on the main sequence and subgiant branches only, but also on their contribution to the RGB, RC, and horizontal branch, as demonstrated by Dolphin (2002), and tested in the preparatory work for VMC by Kerber et al. (2009).
Finally, it is worth mentioning that all models used in this work were produced using the Vegamag definition of photometric zeropoints, according to the procedure detailed in Girardi et al. (2002). We seek for a good consistency between this definition and the zeropoints derived during the calibration of VMC data, as discussed in Appendix B. For the moment, we just warn the reader that there might exist residual offsets between these two realisations of VISTA zeropoints, that might primarily appear as small offsets in the values of distances and extinctions derived in this work.
3.3 Overview of the results for the SFR and
| Tile | subre- | |||||||||||
|---|---|---|---|---|---|---|---|---|---|---|---|---|
| SMC | gion G | (deg) | (deg) | (mag) | (mag) | (mag) | (kpc) | (kpc) | (kpc) | (mag) | (mag) | (mag) |
| 3_3 | 1 | 13.18529695 | 74.59449494 | 18.92 | 0.10 | 0.08 | 60.81 | 2.68 | 2.81 | 0.426 | 0.051 | 0.099 |
| 3_3 | 2 | 11.94330634 | 74.61137246 | 18.90 | 0.07 | 0.08 | 60.26 | 2.01 | 2.08 | 0.454 | 0.079 | 0.046 |
| 3_3 | 3 | 10.59062191 | 74.60080543 | 18.97 | 0.10 | 0.08 | 62.23 | 2.78 | 2.91 | 0.382 | 0.057 | 0.043 |
| 3_3 | 4 | 9.23135534 | 74.58694737 | 19.02 | 0.07 | 0.08 | 63.68 | 2.09 | 2.16 | 0.369 | 0.044 | 0.031 |
| 3_3 | 5 | 13.27320506 | 74.20450581 | 18.93 | 0.08 | 0.07 | 61.09 | 2.11 | 2.18 | 0.409 | 0.035 | 0.040 |
| 3_3 | 6 | 11.95494707 | 74.20545383 | 18.98 | 0.05 | 0.07 | 62.52 | 1.54 | 1.58 | 0.416 | 0.041 | 0.084 |
The next steps leading to the final best-fitting SFHs are illustrated in Fig. 4, which refers to the analysis of subregion G8 of tile SMC 5_4. Essentially, we run the StarFISH SFH-recovery software over a wide-enough grid of distance modulus and extinction values, and , as illustrated in the left panel. For each point in this grid, the code returns not only the best-fitting coefficients for the SFH, but also the . Its minimum value allows us to identify the best-fitting pair, which in this case falls at mag and mag. The coefficients of this best-fitting solution contain all the information necessary to express the SFH in the age–metallicity plane. For a more convenient representation of the results, for each age bin we derive the summed coefficients, producing the star formation rate function SFR in units of , and the average metallicity, hence deriving the age–metallicity relation, . They are illustrated in the right panel of Fig. 4.
We also evaluate the random and systematic errors in the SFR and functions. One hundred simulations are produced using the TRILEGAL tool and the best-fitting solution, and then degraded using the ASTs and re-analysed by the SFH-recovery software. The scatter among these 100 solutions gives the SFH random errors. The distribution of the among these simulations allows us to identify the values that correspond to the and (68 and 99.7 %, respectively) confidence levels. Systematic errors instead are evaluated by simply examining the total range of all the SFH solutions inside the area of the plane. The detailed procedure has been more extensively described in Kerber et al. (2009) and Rubele et al. (2012).
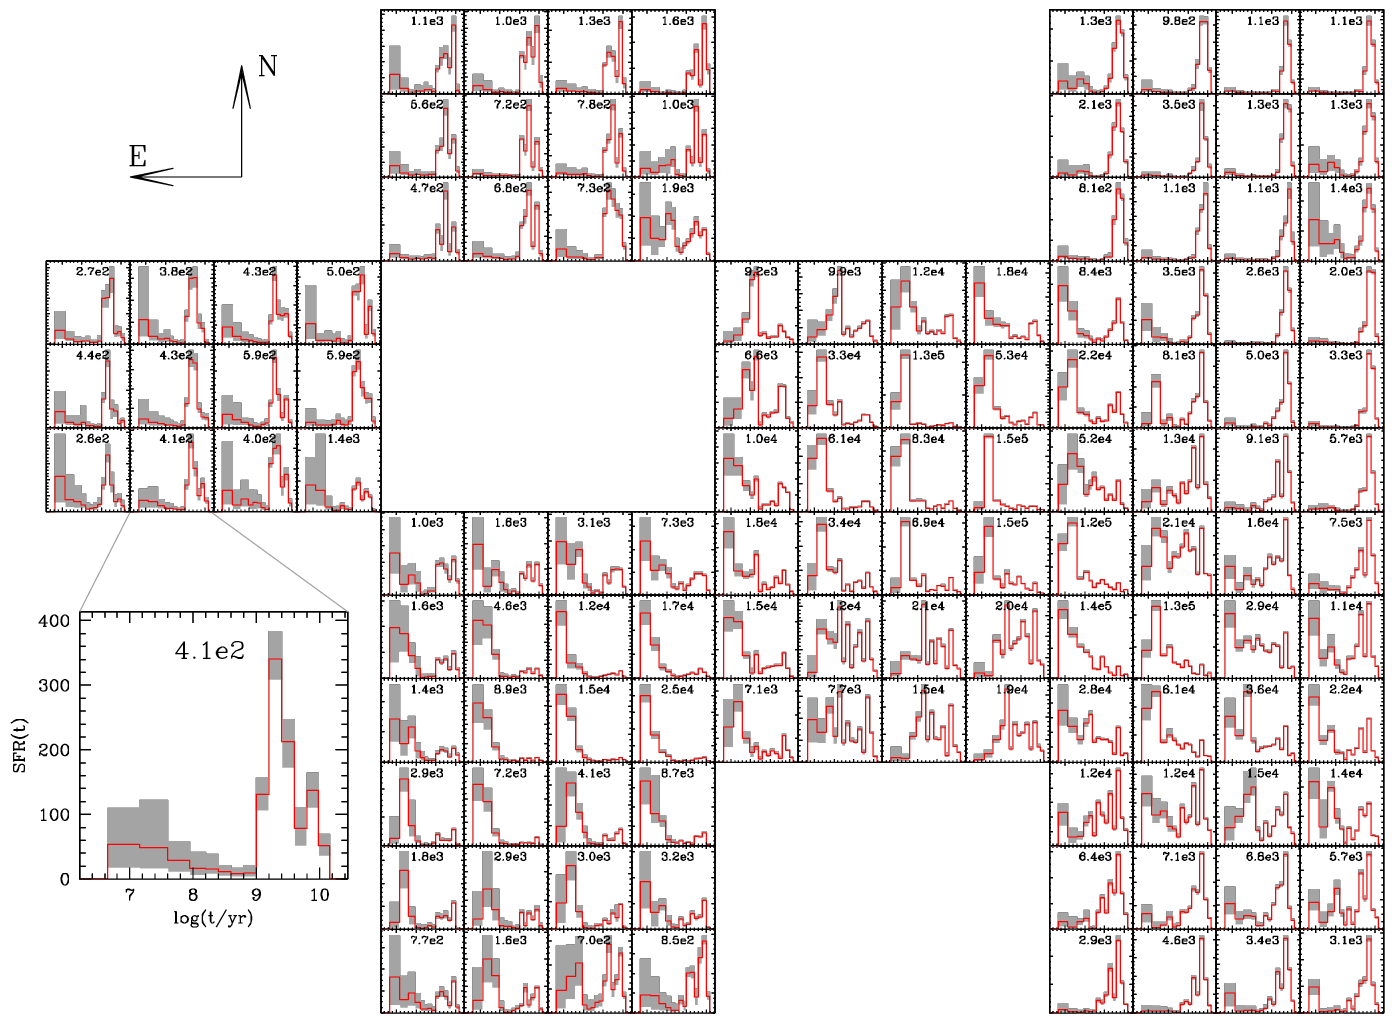
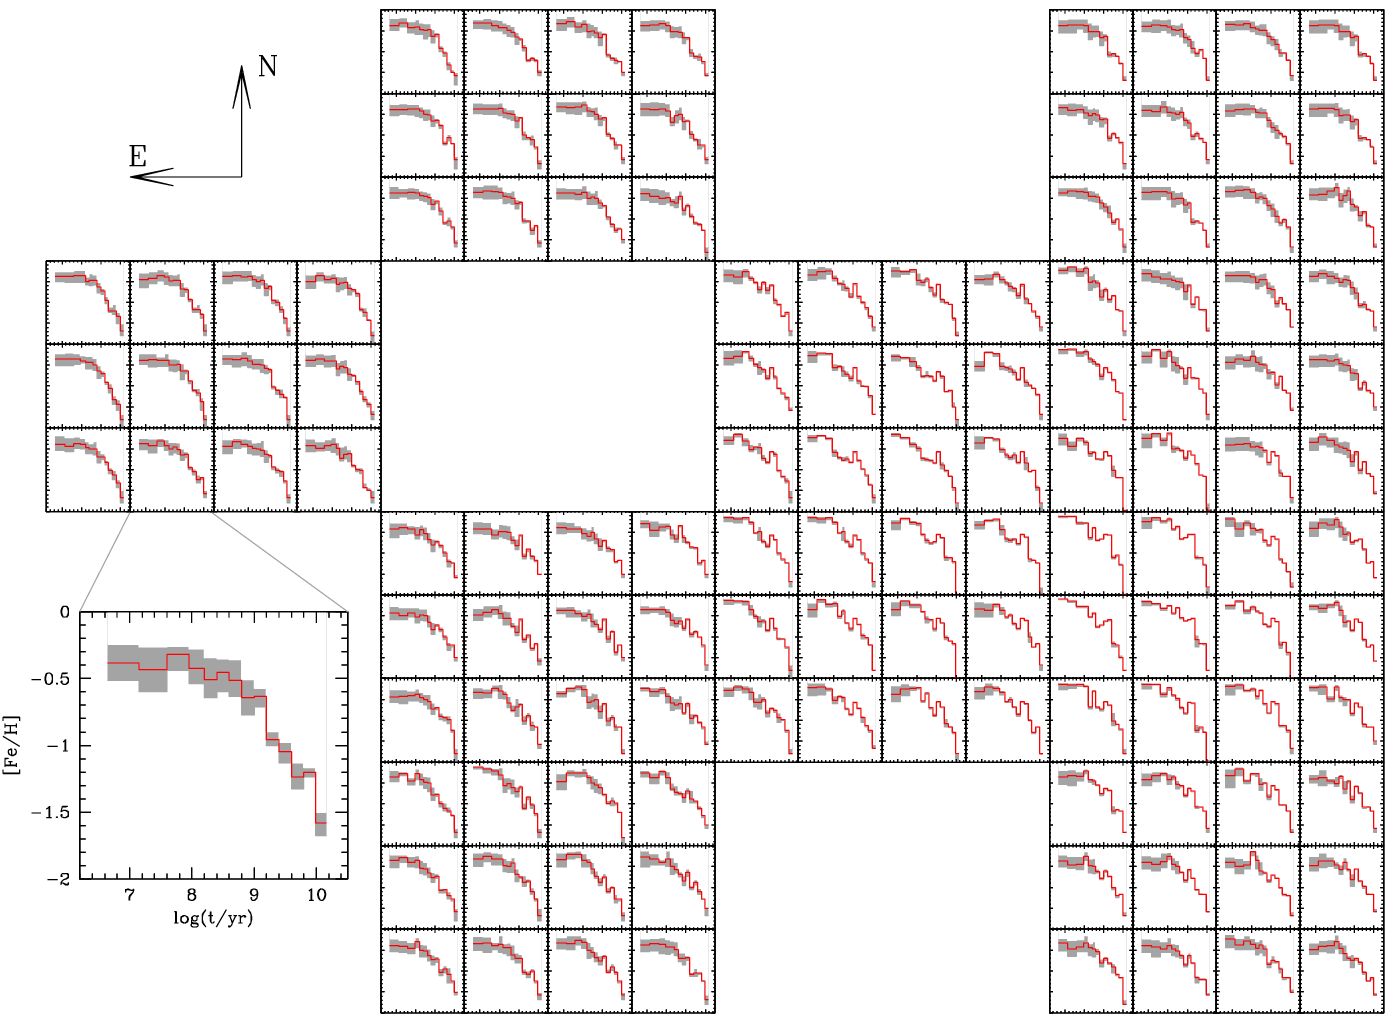
Results for the 120 subregions analyzed in this paper are presented in Figs. 5 and 6. In these figures, we present the SFR and resulting for all tiles and subregions, displaying them in tabular form, in the same way as they appear in the sky. The figures illustrate clearly the strong correlation between the SFH results for nearby subregions and tiles, especially for ages larger than . The continuity in the SFH between neighbouring tiles is particularly encouraging, since – contrary to subregions of the same tile – they do not necessarily share the same photometric quality and completion in the -band (see Table 1).
Another feature evident from Fig. 5 is that the SFR for the outermost SMC regions is overall quite similar, as can be appreciated comparing panels in the extreme corners of the surveyed area. This “external” SFR is composed of a main period of star formation between and , plus a trace of star formation at young ages. In most of the external subregions, however, the young SFR is not significant compared to the error bars, so that we have only upper limits to it. Fields across the main SMC bar and on the Wing, instead, have a much more complex SFR, with seemingly different bursts of star formation appearing along their histories, including very significant events of young star formation. Moreover, we can see that what appears as a single period of steady SFR for all ages in the extreme NW and SW of the survey area, in the Eastern most remote areas appears more like a double-peaked SFR, with maxima at and 9.9. These two peaks are more evident in the NE tile SMC 6_5. These features will be discussed further in Sect. 4.5 below.
4 Discussion
Although we obtain best-fit solutions and confidence intervals simultaneously for all parameters – SFR, , and – it is convenient to discuss them separately in the following, postponing the general discussion of all trends to the final subsection.
4.1 The SMC geometry
As already anticipated in the introduction (see also Sect. 4.2 below), several authours have derived significant depths along the SMC lines-of-sight. We, instead, have used the standard approach of assuming a null depth in the SFH analysis. This approximation might have two different implications. First, one may wonder whether the best-fitting distance and SFH we derive for each subregion are representative of the mean distance and SFH that would have been derived if a significant depth was adopted. This has been already verified by Harris & Zaritsky (2004), who simulated populations with depths up to 12 kpc (0.2 mag) and then analysed them with StarFISH without accounting for the spread in distance. They conclude that the SFH solutions were the same within the errors, and moreover that there were no indications of a significant depth in their results for the SMC. Since we are using the same software and method, we essentially endorse their conclusions and start assuming no depth a priori. The second implication of our null-depth approximation is that we will be constrained to analyse the SMC geometry more in terms of a “thin surface projected on the sky” rather than in terms of a complex 3D distribution. Changing this approach requires a dramatic change in the methods used in the SFH analysis, which will be pursued in subsequent works.
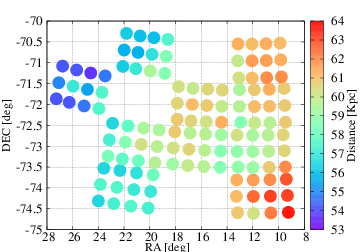
That said, the best-fitting and 68% confidence intervals of the distances and extinctions are presented in Table 3.3 (a complete table is provided in electronic format on the journal website).
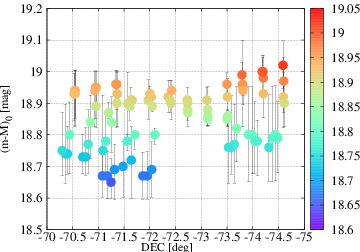
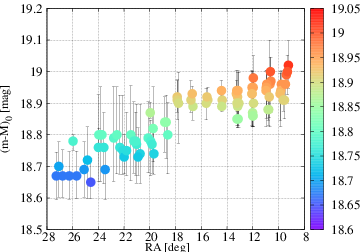
All distances are plotted as a function of equatorial coordinates in Figs. 7 (left panel) and 8, which indicate significant variations in its mean distance across the SMC and especially along the E–W direction. While central parts of the galaxy are found at distances between 58 and 60 kpc, the tiles SMC 3_3 and 6_3 are clearly farther out at kpc, while the easternmost tile SMC 5_6 – the one closest in the sky to the LMC, and possibly associated with the Bridge – is found at a distance of kpc, which is more comparable to that of the LMC rather than the SMC. As can be appreciated in Fig. 8, there is a clear trend of increasing distances in the E–W direction.
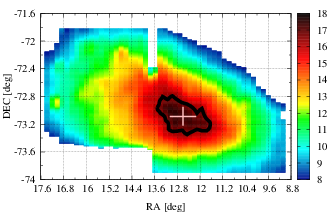
We translate this E–W trend of the distances into a simple disk model as in the case of the LMC (see Rubele et al., 2012). This was performed for two different choices of the SMC centre: the apparent kinematic centre from Stanimirović, Staveley-Smith & Jones (2004, S04), with , and the stellar density centre indicated by the VMC data. The latter corresponds to , and was determined as illustrated in Fig. 9. We remark that it almost coincides with the centre of the K and M giants determined by Gonidakis et al. (2009), with . A weighted least-squares fit of a plane to the distance data then provides a position angle of the line of nodes of and an inclination angle of in the case of the S04 centre666 and are defined as in van der Marel (2001), i.e. is measured starting from the north in counter-clockwise direction, and the near side of the SMC is at ., and and in the case of our centre. The distances to the kinematic and stellar-density centres’ intersection with the best-fit plane are mag ( kpc) and mag ( kpc), respectively. These two cases are illustrated in Fig. 10. Residual distances from these best-fit planes are reasonably high, amounting to up to kpc in both directions. However, it is only in the easternmost regions that the approximation of a disk clearly fails, with residuals approaching kpc. Moreover, it can be noticed that at about 1.5 kpc to the east of the SMC stellar centre (which coincides with the kinematic centre) the best-fit plane is located systematically in front of the data points by about kpc. These deviations are generally larger than the errors in the distance determinations, as can be appreciated in the bottom panels of Fig. 10. The general picture we get is that the SMC is very distorted, and if its structure is to be approximated by a disk, it is a significantly warped one. Another interesting aspect is that the position angle of the line of nodes of the best-fit plane appears not to be related with the major axis along which most of the SMC young stars and gas are distributed (i.e. the so-called SMC bar), which has a position angle of , and which also coincides with the kinematic position angle (cf. Stanimirović, Staveley-Smith & Jones, 2004). Similar results have been obtained recently by Tatton (2014), from the analysis of the RC magnitude in VMC data.
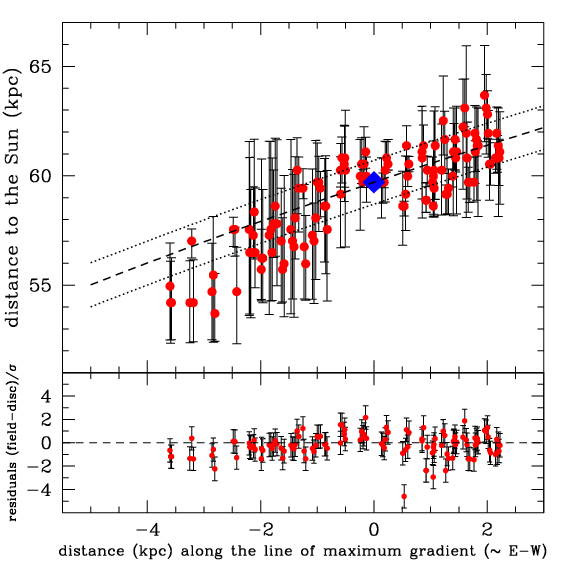
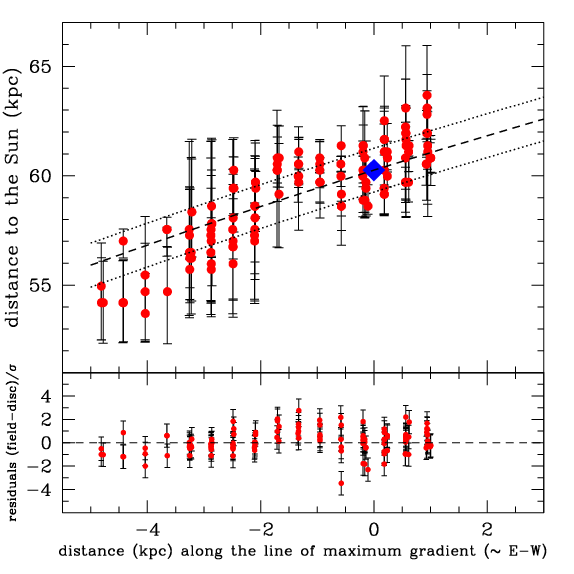
It should be stressed that the choice of fitting a disk is not determined by a belief that the SMC has (or is) a disk; it is mainly driven by two facts: (1) it is the simplest surface that can be fit to a table of distances as a function of coordinates, as the one which we have derived; and (2) because finding the mean disk parameters allows us to easily compare our distance results with a series of other similar derivations of the SMC “best-fit plane” available in the literature. The two main parameters we find, namely the inclination and position angle, could also be interpreted in terms of other simple 3D configurations like, for instance, oblate or prolate spheroids.
Regarding the comparison with other results in the literature, it is generally found that both the old and intermediate age populations (ages Gyr) are distributed in a pressure supported, spheroidal/ellipsoidal distribution (Subramanian & Subramaniam, 2012, and references therein). The young stars, like classical Cepheids, are found to be in a disk. In the present work we do not use any specific distance tracer, but the use of near-infrared data implies that our distances are generally more weighted by the intermediate-age populations than by young stars. So, it is initially a surprise that we find indications of a distorted disk, rather than the more smooth features that would be expected from a spheroidal/ellipsoidal distribution. Moreover, it also surprising that the structure we (and also Tatton, 2014) obtain is very different from the one derived from the classical Cepheids, which indicate a much more inclined disk with (Caldwell & Coulson, 1986). Cepheids also possess a very different position angle of line of nodes, (see also Laney & Stobie, 1986; Haschke, Grebel & Duffau, 2012).
4.2 Possible depth structures
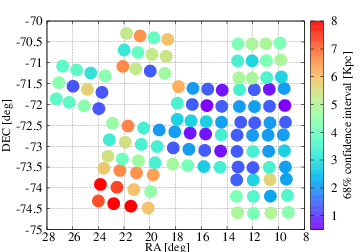
The total distance intervals corresponding to the 68% confidence level of the best-fit distances are illustrated in the right panel in Fig. 7. One can see clearly that such widths are larger towards the SE side of the SMC, and especially at the SE border of tile SMC 3_5, which has a distance confidence interval about kpc wide. Most of the other fields have best-fit distances constrained to within kpc – with a few fields having distances constrained to be inside kpc. One can also notice that there is a mild trend of the total distance interval increasing gradually towards the SE of the SMC.
The interpretation of this increased distance confidence level intervals is not straightforward, but two possible causes for them are: (1) indications that these areas present large distance spreads along the line of sight, or (2) that the smaller stellar density towards these outer regions are causing sitematically poorer fits of the SFHs and distances. Indeed, Kerber et al. 2009 have shown that the SFH errors are primarily a function of stellar density and completeness. However, it is striking that the tiles SMC 5_6 and 6_5, towards the NE, present similar stellar densities (see Fig. 1) and smaller completion than tile SMC 3_5 (see Table 1), but no indication of an increased distance confidence level interval. This lead us to suspect that the SE areas of the SMC might indeed present significant depths along the line of sight. This suspicion cannot be confirmed at the moment, since our method does not assume a distance dispersion. A subsequent work will be dedicated to this point.
In this context, however, it is worth recalling that many other authours have found indicated distance variations and/or a sustantial depth across different lines-of-sight of the SMC, starting with the early work by Gardiner & Hawkins (1991). The literature of the topic is highly varied and based on very heterogeneous data. The latest works on the subject, however, tend to use the RC position and widths as provided by major surveys such as the Magellanic Cloud Photometric Survey (MCPS) and the Optical Gravitational Lensing Experiment (OGLE), as the primary probe of the SMC geometry. Depths derived in this way often reach values between 10 and 23 kpc (Gardiner & Hawkins, 1991; Subramanian & Subramaniam, 2009; Nidever et al., 2013; Tatton, 2014).
Interestingly, using the position and width of the RC, Nidever et al. (2013) find that the eastern side of the SMC has a bimodal distribution of distances, with a component located at just 55 kpc, far closer than the main SMC body which they locate at 67 kpc. Our best fit-distances (left panel in Fig. 7) essentially confirm the presence of this close component of the SMC, which is clearly seen in tile SMC 5_6 (Fig. 7, left panel) for typical distances of kpc. However, our distance maps do not produce evidence for the farther component (expected at kpc) at this position. This could simply be caused by the nearby component being denser than the farther one, so being the only one being singled out by our method. Indeed, examination of the CMDs for the SMC tile 5_6 (Fig. 2) reveals the presence of an extended RC, with the faintest half being less populated than the brightest; this latter probably corresponds to Nidever et al. (2013)’s distant component.
Finally, before closing the discussion related to the distances, it is worth recalling that the distances determined with our method are average values obtained assuming that in any subregion stars of all ages are at the same mean distances. The most representative ages sampled by this method vary a lot across the SMC, as we will see in Sect. 4.4, but it is fair to state that they are most sensitive to the intermediate-age populations that (if present) generate prominent RCs and RGBs in our near-infrared CMDs. However, there are clear indications from other authors that populations of different ages have different geometries. For instance, based on the large sample of variables from OGLE III Haschke, Grebel & Duffau (2012) find that the young classical Cepheids are distributed with a position angle of the major axis and inclination , while the very old RR Lyrae variables are better described by a and . Both distributions are clearly different from the mean geometry we find. This is not surprising for the young populations, which are concentrated on the SMC bar. The different results of the very old population, instead, seem to indicate that this old population constitutes an extended halo (see also Nidever et al., 2011) with little resemblance to the warped disk galaxy we derive.
Needless to say, future analysis of the SFH based on VMC data will include a more detailed description of the distance distributions along the different lines-of-sights, and as a function of stellar ages. In this context, the present solutions constitute a valuable first-guess for this more complex analysis. Moreover, we are also studying the structure of the SMC as traced by classical Cepheids and RR Lyrae using the whole sample from OGLE III plus EROS-2 variables which have a counterpart in VMC, and new period–luminosity relations derived from the multi-epoch VMC data (see e.g. Ripepi et al., 2012, 2014; Moretti et al., 2014). This will enable us to make a much more robust comparison between the geometry derived from the variables and from the SFH-recovery work.
4.3 Large-scale extinction maps
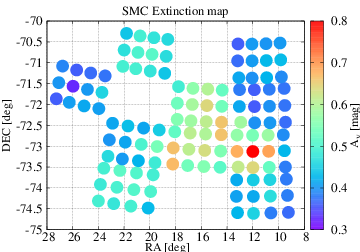
The extinction map derived from our best-fitting values of is presented in Fig. 11. As can be appreciated, most of the external SMC regions are found at extinctions typically smaller than mag, with minimum values being of mag. Only across the main bar, and in parts of the Wing regions in tile SMC 3_5, are the values larger than this, reaching mag for three subregions. The average extinction for the entire analysed area is of mag. We remark that the maximum value of mag corresponds to extinctions of just 0.25, 0.18 and 0.07 mag in the filters , and , respectively, and to colour excesses of 0.18 mag in and 0.11 mag in (cf. item 4 in Sect. 3.1).
The comparison with extinction values from the literature is not easy, given the very different methods and probes applied by different groups. The widely-used extinction maps from Schlegel, Finkbeiner & Davis (1998), based on estimating dust column densities from dust emission, are not reliable for the central parts of the SMC; for its immediate surroundings, however, they indicate mean values close to mag, which probably represent the typical values for the foreground MW extinction across the entire SMC. Similar dust maps were derived for the central SMC regions by Israel et al. (2010), using COBE/DIRBE and WMAP data; they provide a mean extinction of about mag internal to the SMC. That means that their total average extinction values reach mag, which compares very well with our results for the SMC subregions with the highest mean extinctions. Overall, however, Israel et al. (2010) extinctions appear larger than our values. This could be explained by the fact that these extinction maps are derived from emission-based estimates of the total dust column density, hence comprising the entire line-of-sight to the SMC galaxy, while our extinction values are a star-by-star weighted mean that reflect the mean values somewhere in the middle of the SMC stars.
On the other hand, our average values agree quite well with those derived by Zaritsky et al. (2002) from MCPS data, which span the range of mag, when considering both cool and hot stars. In their case, the extinction is probed using similar objects (the stars), but using a different method, namely a star-by-star fitting of the spectral energy distribution.
Haschke, Grebel & Duffau (2011) instead find an average extinction of just mag (or mag) adopting a theoretical mean unreddened colour for the RC stars, and mag (or mag) from RR Lyrae stars from the OGLE III survey. A similar distribution of the extinction in the central part of the SMC was found in Subramanian & Subramaniam (2012), also using the mean colour of the red clump. In both cases, the derived extinction values appear to be significantly smaller than ours. We should however keep in mind that these are mainly measuremements of the internal SMC extinction, that is, the RC method is mostly sensitive to the variations of extinction with respect to a fixed reference value. Moreover, there is a significant difference in assumptions with respect to the present work: in practice, both Haschke, Grebel & Duffau (2011) and Subramanian & Subramaniam (2012) assume that the RC has a constant intrinsic colour across the SMC. We, instead, assume that all CMD features (including the RC) vary as indicated by stellar models and following the age and metallicity distributions of the subregions being sampled. Tracing back the origin of differences in the final values, in these circumstances, is not straightforward.
However, if we consider the two least-extincted northeastern tiles (namely tiles SMC 5_6 and 6_5), there indeed appears to be a modest zero-point offset of mag in our values, compared to the canonical 0.12 mag derived from Schlegel, Finkbeiner & Davis (1998) for the SMC outskirts. We note that such an offset, if real, could be easily explained by offsets of the order of mag in the VMC photometric zeropoints, and/or in the stellar models employed here. Moreover, Peek & Graves (2010) show that differences in dust temperature may lead to variations in the Schlegel, Finkbeiner & Davis (1998) values of a few hundredths of a magnitude (a tenth of a magnitude in ), so that it is not even clear whether the problem is in our results or on the dust emission maps. Although this surely deserves further investigation, we recall that such errors would not affect other aspects of this work, since they would, prevalently, just cause a small systematic offset in our distance moduli (that is, a mag). Indeed, all comparisons in the distances and reddenings we are making here are chiefly meant to explore how these quantities vary across the SMC in a differential way. Future works by the VMC team will better address the problem of determining the absolute values of distances and extinctions from these data.
![[Uncaptioned image]](/html/1501.05347/assets/CCMDSC_10_075_-1_45.png)
![[Uncaptioned image]](/html/1501.05347/assets/CCMDP_10_075_-1_45.png)
![[Uncaptioned image]](/html/1501.05347/assets/CCMDSC_8_7_-0_5.png)
![[Uncaptioned image]](/html/1501.05347/assets/CCMDP_8_7_-0_5.png)
![[Uncaptioned image]](/html/1501.05347/assets/lr_sfr_6_9000.png)
![[Uncaptioned image]](/html/1501.05347/assets/lr_sfr_7_4000.png)
![[Uncaptioned image]](/html/1501.05347/assets/lr_sfr_8_1000.png)
![[Uncaptioned image]](/html/1501.05347/assets/lr_sfr_8_3000.png)
![[Uncaptioned image]](/html/1501.05347/assets/lr_sfr_8_5000.png)
![[Uncaptioned image]](/html/1501.05347/assets/lr_sfr_8_7000.png)
![[Uncaptioned image]](/html/1501.05347/assets/lr_sfr_8_9000.png)
![[Uncaptioned image]](/html/1501.05347/assets/lr_sfr_9_1000.png)
![[Uncaptioned image]](/html/1501.05347/assets/lr_sfr_9_3000.png)
![[Uncaptioned image]](/html/1501.05347/assets/lr_sfr_9_5000.png)
![[Uncaptioned image]](/html/1501.05347/assets/lr_sfr_9_7000.png)
![[Uncaptioned image]](/html/1501.05347/assets/lr_sfr_9_9000.png)
![[Uncaptioned image]](/html/1501.05347/assets/lr_sfr_10_0750.png)
Figure 3.3 continued.
4.4 The look back time star formation rate and mass assembly tomography
Figures 5 and 6 encode a lot of information about the SFH of the SMC, including their spatial distribution and derivations of the uncertainties. However, they do not provide a good visualisation of the relative spatial distribution of the different populations; moreover, those are low-resolution maps whose pixel elements are equal to the subregions. In order to improve upon this point, we have transformed our SFH results, together with the original photometry data, into high-resolution maps of the SFH and history of the SMC stellar mass assembly.
Our stellar population maps are built as follows:
-
1.
For each one of the subregions analysed, we take the coefficients of the best-fitting solution and build the total Hess diagram of each age bin and metallicity .
-
2.
For each star in the photometric catalogue, we identify its cell in the Hess diagram. The total number of stars in that cell is .
-
3.
We assign to the star the relative probabilities of belonging to each one of the age–metallicity bins, by simply computing the ratio
where is the number found in the best-fit model.
-
4.
We sum the of the five metallicity bins holding the same age , hence deriving .
-
5.
We randomly assign the star to an age bin, following the probability set by the distribution of .
-
6.
Finally, we build density maps containing all stars which have been observed. There is a map for each age bin.
An intermediate step of this process is illustrated in Fig. 3.3, which shows how a population of a given age and metallicity (that is, stars belonging to a single partial model) would appear in terms of . The top half of the plot shows how stars belonging to an old age appear, when translated into a probability of being truly old – or, more specifically, of belonging to the partial model with : they appear very prominently () if they are at the faintest part of the red clump and horizontal branch, and moderately prominent () over the RGB and reddest part of the turn-off, while stars at the bluest part of the turn-off turn out to be given a much lower probability of being truly that old. For a young population, instead, largest probabilities of being truly young are in general assigned to the stars at the brightest part of the He-burning sequence, and at the bluest part of the turn-off, as illustrated in the bottom panels of Fig. 3.3, for a population with . In our method, the same probability assignment is made to all stars observed by VMC. It is evident that the resulting population maps will heavily weight the stars whose ages, due to their particular position in the CMDs, have a high probability of not belonging to other age bins.
The resulting spatial maps are presented in Fig. 3.3, for all 14 age bins we have defined. As the previous Fig. 5, they also reflect the intensity of the best-fitting SFR, but with a significant advantage: across each subregion, this SFR is spatially distributed in proportion to the number of stars that likely have that age, and the resolution of the SFR maps is significantly improved. Despite the presence of a few artifacts – caused e.g. by the detector 16 gaps, or by the imperfect superposition between tiles – a few features are remarkable in the maps of Fig. 3.3:
-
•
populations of all ages older than present a nearly-elliptical distribution of their stars;
-
•
the elliptical shapes persist for ages between , although at these ages the distribution seems to have a sharper decline in density at the NE end of the ellipse;
-
•
at younger ages, however, even more significant distortions appear, especially at the SW side of the SMC, which starts to clearly delineate the Wing for all ages ;
-
•
finally, at very young ages (), a very patchy distribution of star formation appears, more concentrated in the SMC bar and Wing. A prominent and wide episode of star formation is evident at the NE extremity of the bar at the age bin. This region is well known from previous optical surveys and contains the prominent young cluster NGC 346.
The presence of young stars in the Wing starting at ( Gyr), is consistent with previous simulations which are based on the LMC-SMC-Galaxy interaction (Yoshizawa & Noguchi, 2003; Yozin & Bekki, 2014). These simulations clearly show that the formation of young stars in the Wing is due to the last LMC-SMC interaction about 0.2 Gyr ago, when the outer gas disk was tidally compressed during the very strong tidal LMC–SMC interaction (with the distance of the two being kpc). Our observations appear to confirm the LMC–SMC-interaction origin of the Wing formation.
Our maps can be compared with the large-scale population maps derived by Harris & Zaritsky (2004) from MCPS data. Such maps were obtained with a very different resolution, and probably reflect many of the differences in the data quality and implementation of the SFH-recovery method. Although the comparison is not easy, some clear similarities are evident at first sight, especially in regard to the distribution of the young star formation.
However, an aspect worth mentioning is that we do not find evidence of the large ring of star formation found by Harris & Zaritsky (2004) at ages of 2.5 Gyr, suggesting that this feature might have been an artifact derived from their significantly shallower photometry than ours, added to the uncertainties intrinsic to the optical work – such as for example the larger sensitivity to differential extinction of MCPS.
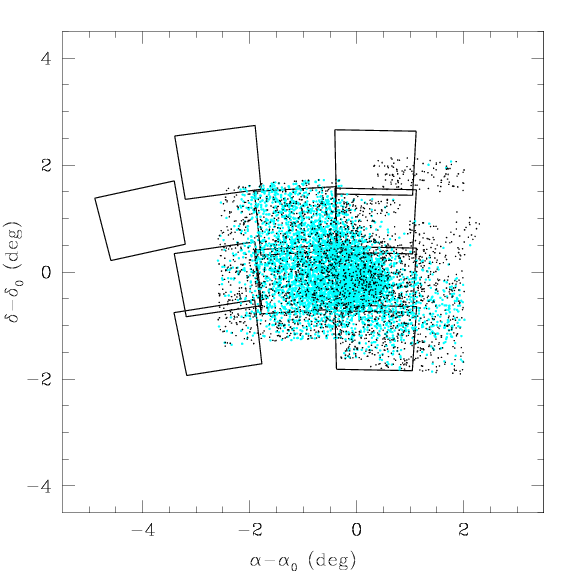
These maps compare well with those inferred from the distribution of classical Cepheids (tracing the young, Myr, population) and RR Lyrae stars (tracing the old, Gyr, population) in the SMC. This is shown in Fig. 14, where cyan points are classical Cepheids and black points are RR Lyrae stars. Although OGLE III and EROS-2 cover only part of the area analyzed in this paper (specifically, entirely tiles: SMC 5_4, 4_4, 5_3, 4_3 and 3_3, half of the tile 4_5, and of tiles 3_5 and 6_3) it is quite clear that the density of classical Cepheids peaks in tiles SMC 5_4, 4_4 and 4_3, which are dominated by the young population, according to our SFR maps. On the other hand, the RR Lyrae stars are distributed rather smoothly all over the SMC area – although in more central SMC tiles many of them probably do not show up because “buried” amid the overwhelming young population.
![[Uncaptioned image]](/html/1501.05347/assets/lr_mass_6_9000.png)
![[Uncaptioned image]](/html/1501.05347/assets/lr_mass_7_4000.png)
![[Uncaptioned image]](/html/1501.05347/assets/lr_mass_8_1000.png)
![[Uncaptioned image]](/html/1501.05347/assets/lr_mass_8_3000.png)
![[Uncaptioned image]](/html/1501.05347/assets/lr_mass_8_5000.png)
![[Uncaptioned image]](/html/1501.05347/assets/lr_mass_8_7000.png)
![[Uncaptioned image]](/html/1501.05347/assets/lr_mass_8_9000.png)
![[Uncaptioned image]](/html/1501.05347/assets/lr_mass_9_1000.png)
![[Uncaptioned image]](/html/1501.05347/assets/lr_mass_9_3000.png)
![[Uncaptioned image]](/html/1501.05347/assets/lr_mass_9_5000.png)
![[Uncaptioned image]](/html/1501.05347/assets/lr_mass_9_7000.png)
![[Uncaptioned image]](/html/1501.05347/assets/lr_mass_9_9000.png)
![[Uncaptioned image]](/html/1501.05347/assets/lr_mass_10_0750.png)
Figure 3.3 continued.
Since the SFR maps are built for bins almost-equally spaced in , they do not reflect the total mass of stars built in each epoch of the SMC history. To derive the latter, we redo the maps re-scaling them to the total stellar mass formed in each age bin. The results are presented in the maps of the stellar mass assembly of Fig. 3.3. As can be seen, these maps reveal that the young star formation constitutes only a minor fraction of the total stellar mass formed in the SMC. It is remarkable however that the age bin ( to Gyr, or Gyr) turns out to contain a significant fraction (34 %) of the total stellar mass formed in the SMC.
This latter result is in agreement with Rezaeikh et al. (2014), who, analysing the -band luminosity function of long period variables found/classified by Soszyński et al. (2011) and Ita et al. (2004), also find the main epoch of stellar mass assembly in the SMC to have occurred at around 6 Gyr ago, at a rate of .
4.5 The global SFR
With the detailed SFR and population maps to hand, we can perform a rough comparison with the SFR derived by other authors. Before that, we build the SMC global SFR as illustrated in Fig. 16. Considering the large coverage of the central parts of the SMC provided by the present VMC data, it is likely that this global SFR describes most of the stellar mass formed by this galaxy.
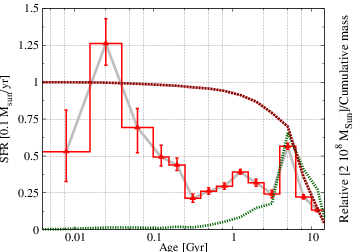
Figure 16 shows a few periods of more intense star formation in the SMC. Essentially, it tells us that the SFR was relatively modest at very old ages, with mean values below . SFR intensified significantly at an age of Gyr, reaching a peak of ; during this period, a large fraction of the stellar mass of the SMC was formed. At intermediate ages, the SFR declined to values as low as , but with another peak of at Gyr. Finally, more age resolution is provided at young ages, for which it is apparent that the very recent star formation has increased by factors between 2 and 5 with respect to the values dominant at intermediate-ages. The young SFR peak is found in the second age bin, spanning from 14 to Myr. Figure 16 also shows the cumulative stellar mass formed since the oldest ages. It turns out that of stars were formed in the area presently sampled by VMC; this estimate obviously depends on the adopted initial mass function, which comes from Chabrier (2003).
Comparing our results with the literature is not easy, considering the significant number of studies in the past, based on very different datasets and methods. The era of quantitative SFH derivation starts in practice with a small region with available HST/WFPC2 data analysed by Dolphin et al. (2001). It was followed by the impressive work by Harris & Zaritsky (2004), based on the MCPS, which marked the field for years. Although the MCPS resolution was not comparable to the HST one, it had the great advantage of completely covering the SMC main body. The main findings from Harris & Zaritsky (2004) were the presence of several periods of enhanced star formation, with one in particular (at Gyr) causing a large-scale annular structure in the SMC. As already mentioned, we do not find evidence of such a structure.
In more recent years, different sets of deep photometric data were used for the same goal of deriving the field SFH (e.g. Chiosi & Vallenari, 2007; Noël et al., 2009; Cignoni et al., 2013b; Weisz et al., 2013); although they have reached a general consensus regarding some basic SFH features of the SMC, they have also been dissimilar to some extent. For ages Gyr, the SFH seems to be consistent with a relatively low star formation, as judged from the CMD analyses of deep HST photometry of seven spatially diverse fields by Weisz et al. (2013), as well as with ground-based photometry of twelve distinct fields spread across the galaxy by Noël et al. (2009). According to Noël et al. (2009), such a low old SFR is similar at all radii and azimuths. No region inside kpc from the SMC centre has been found to be dominated by the old population. These findings by Noël et al. (2009) and Weisz et al. (2013) broadly agree with our conclusions, that the SFR has been modest at all ages larger than Gyr.
Relatively old and intermediate-age peaks have also been found in the SMC SFH at ages of and Gyr, and suggested to be the result of tidal interaction with the LMC (Weisz et al., 2013). In the western fields studied by Noël et al. (2009), the older enhancement splits into two peaks, located at and 12 Gyr. However, HST CMDs of six other fields located at projected distances of to degrees from the SMC centre resulted to exhibit a slow star formation pace since the galaxy formation until Gyr ago, when the star formation activity started to increase sharply (Cignoni et al., 2013b). Such an increase peaks at Gyr. Additionally, the level of the intermediate-age SFR enhancement systematically increases towards the centre. Whether gas from the outer regions has been centrally funneled still remains an issue, due to uncertainties in the geometry of the SMC (Weisz et al., 2013). As far as we are aware, the conundrum about the existence of several peaks at ages older than Gyr depended on the unavailability of datasets for more areas across the SMC. In regard to these issues, our data clearly confirms (1) the peaks of star formation at ages of and Gyr, and (2) that the peak of SFR at Gyr appears, effectively, more concentrated than the Gyr one, as can be appreciated in the population maps of Fig. 3.3. A similar result was obtained by Rezaeikh et al. (2014), who finds that the SMC experienced two main episodes of star formation at Gyr () and Gyr (), being the latter more concentrated in the central parts.
Noteworthily, the -Gyr old peak of star formation finds correspondence in a peak of cluster formation occurring at about the same time in the SMC, LMC, and the MW (Piatti, 2010, 2011b, 2011a). This coincidence might be indicating a close encounter with the Milky Way at these ages, although such an event is strongly disfavoured by the most recent proper motion data for the LMC (Besla et al., 2007; Kallivayalil et al., 2013).
As far as ages younger than Myr are concerned, the SFH is mostly driven to the SMC innermost regions, where the major star formation events took place. This age range is featured by several peaks of star formation which have preferentially occurred towards the eastern side of the galaxy (Noël et al., 2009). Indu & Subramaniam (2011) also found evidence of a shift for the centroid of population younger than Myr and up to Myr in the direction of the LMC using the OGLE-III and the MCPS. Our results broadly confirm these suggestions, but provide substantial improvements in the spatial resolution and area of the derived young SFH.
In summary, some features of our SFH find correspondence with the results in the literature, others do not:
- •
-
•
In the western fields studied by Noël et al. (2009), the older enhancement is found to split into two peaks, located at 8 and Gyr. Although our data does not extend as far to the west as theirs, we do not find indications of a similar split, since our age bins imply a coarser resolution of the oldest SFR with respect to Noël et al. (2009).
- •
-
•
Harris & Zaritsky (2004) find bursts of star formation at Gyr, Myr, and Myr. The first and last of these periods seem to have correspondence in our data, although at slightly different ages.
-
•
Cignoni et al. (2013b) find an increased SFR peaking at Gyr, which is consistent with suggestions of a close encounter with the Milky Way at recent time. We essentially find the same, at Gyr.
-
•
From a different kind of data, Rezaeikh et al. (2014) finds main episodes of star formation at Gyr and Gyr, at rates in reasonably good agreement with our data, and with a concentration of the younger star formation towards the center, similar to the trends we find.
As a final note, we point out that all the previous works on the SMC SFH seem complementary, in the sense that they analyse the SFH at different spatial scales and with very different sensitivities regarding the old SFH. From the point of view of the present work, they all suffer from the same problem: a higher sensitivity to the presence of differential extinction. None of these surveys can rival VMC in terms of spatial coverage, except for the MCPS; and yet, MCPS is the survey that more dramatically illustrated how the SFHs derived from optical data are sensible to differential extinction: Harris & Zaritsky (2004) even had to resort to different amounts of extinction affecting red and blue stars, in order to improve their CMD fits. With its sensitivity to dust reduced by a factor of at least three, as compared with a survey based on data, this is one aspect where VMC has probably made significant progress.
4.6 The metallicity evolution
In the context of the SFH-recovery work, the AMR can be treated either as an integral part of the derivation method, or as a by-product. The difference is in whether the AMR derived from field observations is used to force the SFH solution to occupy a certain line in the age–metallicity space, or whether the best-fit SFH solution is used to indicate which AMR actually holds. We have used the latter approach, allowing the AMR to vary within a wide area in the age–metallicity space, providing enough freedom for slightly different AMRs to be derived between different regions. Needless to say, such an approach would not have been possible were VMC not to cover an extremely large area of the SMC.
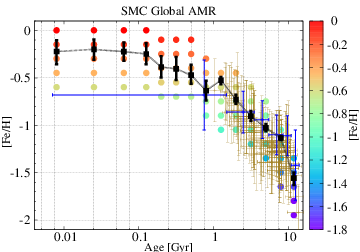
The several space-resolved AMRs have already been introduced in Fig. 6. In addition, we have produced the global AMR illustrated in Fig. 17, which is simply the weighted mean [Fe/H] computed over all of the SMC, for each age bin. The general features are clear: the [Fe/H] has generally increased in time, with the exception of a period of slight decrease in metallicity taking place for ages slightly younger than Gyr.
Several independent determinations of the AMR exist in the literature, most of them derived from the study of ages and metallicities in star clusters. Piatti (2011c) used the largest known SMC cluster sample with ages Gyr and metallicities put onto a homogeneous scale, and found two periods of enhanced cluster formation at and Gyr, taking place throughout the entire body of the galaxy. He also found the absense of a metallicity gradient, and a spread in metallicity for clusters older than Gyr. A compromise between covering a relatively large area and reaching the oldest main sequence turn-offs was accomplished by Piatti (2012). He found that the field stars do not possess gradients in age and metallicity, and that stellar populations formed since Gyr ago are more metal-rich than dex and are confined to the innermost region (semi-major axis 1∘). He also compared the field star AMR to that of the star cluster population with ages and metallicities in the same field scales, and found that clusters and star fields share similar chemical evolution histories. This latter conclusion seems to be fully supported by the comparison with our results for the field, shown in Fig. 17. For comparison, the figure also presents the mean AMR obtained by Carrera et al. (2008) from caltium triplet observations in 13 different SMC fields. Note that there is a good agreement between the different AMRs for all ages larger than 2 Gyr. For the youngest age bin, the comparison is meaningless because the RGB-dominated sample by Carrera et al. (2008) does not provide age information for stars younger than Gyr.
One of the most remarkable points in the global AMR of Fig. 17 is the peak in metallicity at Gyr, followed by a decrease at Gyr, and then finally followed by a steady increase that leads to the present-day metallicities. This indicates an event of dilution in the metallicity having occurred Gyr ago.
In order to better understand this feature, in Fig. 18 we plot the spatial distribution of the metallicity in each sub region analysed, in the relevant age interval. It is remarkable that the peak in metallicity manifests itself first in the age bin ( Gyr), in the form of a higher metallicity in the inner SMC regions. For the age bin ( Gyr), the entire SMC is observed to present a higher metallicity. Finally, for the age bin ( Gyr), the metallicity has already decreased again, but for the Northern outskirts of the SMC – which, coincidentally, are the only regions to not have formed stars recently. Although the dynamics of the SMC stellar populations is quite uncertain over such timescales, the effect appears as if a major phase of accretion of metal poor gas has taken place in the SMC history, interrupting the normal increase in the system’s metallicity, at an age of 1 Gyr, so that the new star formation took place starting with a metal-poorer gas. Interestingly, the period of global decrease in the SMC metallicity follows the -Gyr peak in the global SFR. This concomitance might be indicating a major event in the SMC history, like for instance the merging with a gas-rich companion galaxy, or simply a closer passage to the LMC or the Milky Way.
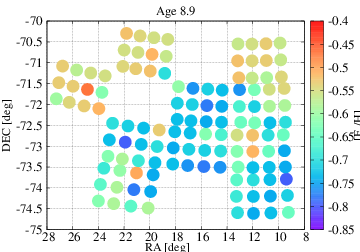
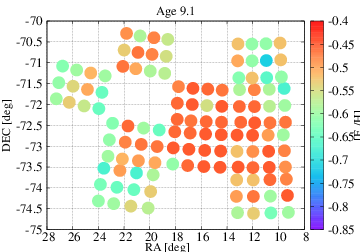
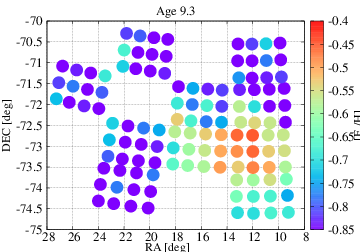
Indeed, this latter interpretation seems consistent with the simulations by Yozin & Bekki (2014), which predict that the LMC–SMC–Galaxy interaction could have triggered enhanced star formation in the SMC about 1.5 Gyr ago. This is also the epoch of the Magellanic Stream formation. They find that the 1.5-Gyr ago interaction can strongly distort the entire SMC body so that a large amount of gas in the outer part (thus metal-poor) can be funneled to the central bar region, where enhanced star formation can occur777Such simulations do not predict enhanced star formation at Gyr, because this is beyond the scope of the currently existing LMC-SMC interaction models. A possible burst (via merger) around 7.5 Gyr ago in the SMC is discussed by Tsujimoto & Bekki (2009). The 5 Gyr burst could constitute a useful constraint on such models, being described e.g. as the epoch of the first arrival close to the MW, or the epoch when the SMC started its strong interaction with the LMC.. When the outer metal-poor gas is transferred to the central region to be consumed by star formation, the new stars should have lower [Fe/H] initially. However, owing to the chemical evolution after the burst, [Fe/H] should increase again. A subsequent study by Yozin & Bekki (2014, see their figure 14) does not show clearly the dip in the AMR, perhaps because they averaged the AMR for the entire region. In the present work, however, the same galaxy-wide average still causes the metallicity dip to be clearly seen in the data.
On the other hand, as a cautionary note, we recall that the Gyr interval also corresponds to the ages at which the RGB quickly develops in stellar populations, so we cannot exclude that our method reacts to this sharp evolutionary transition by introducing some artificial feature in the AMR at those ages. However, in support of the “galaxy-interaction” hypothesis, is that most of the massive intermediate-age clusters in the LMC and SMC turn out to be observed exactly at ages close to Gyr (see e.g. Girardi et al., 2013). Moreover, the most massive LMC and SMC clusters of ages between and Gyr are known to present multiple turn-offs and dual red clumps (Goudfrooij et al., 2009; Girardi, Rubele & Kerber, 2009), which might be related to the same phenomenon: i.e., a galaxy interaction that has disturbed the ISM enough to drive the accumulation of gas in the cluster interiors, and the subsequent star formation there. Although this might sound as rather speculative, this picture could explain a wide range of observational facts, without resorting to extreme assumptions.
5 Summary and closing comments
In this work, we have provided SFH, distance and extinction maps across an area of 14 deg2 of the SMC. The maps are computed with an initial resolution of 20′, which is the size of the 120 nearly-square subregions used in the SFH-recovery. Although maps of similar or better resolution have been presented before, our work is distinguished from them by basically three crucial aspects: (1) the use of uniform and high-quality near-infrared photometry, reaching stars near the oldest main sequence turnoff across all of the observed area and with a reduced sensitivity to differential extinction; (2) the simultaneous derivation of all the quantities from the best global fit of the CMDs; (3) the extremely wide area that has been analysed, in a homogeneous way.
These results already allow us to revise previous results regarding the SMC morphology. We find that it is systematically tilted in the E–W direction, with a mean inclination angle of . However, there are enough significant displacements with respected to an inclined disk, to allow us to infer that the SMC is significantly distorted and similar to a warped disk. In addition, a large distance spread along the line of sight is clearly detected in the SE end of the SMC, which corresponds to the end of its Wing. After deriving the SFH for all these subregions, we assign to every observed star a probability of belonging to a given age–metallicity interval. This allows us to make high-resolution maps of the several stellar populations observed across the SMC. We can, for instance, illustrate the flocculant nature of the very young star formation, and identify the nearly smooth features drawn by the older stellar generations. We identify the centre of the intermediate-age to old stellar populations to be located at coordinates , which is displaced with respect to the kinematical SMC center determined by Stanimirović, Staveley-Smith & Jones (2004). We document the formation of the SMC Wing at ages younger than Gyr, and the dramatic features drawn by the young star formation in the SMC Bar, which peaked at ages of about Myr. Even more importantly in terms of the SMC history, we clearly detect periods of enhanced star formation at ages of and Gyr ago. The former is probably related to an interesting feature we find in the AMR, that points to the ingestion of metal-poor gas taking place at ages slightly larger than Gyr. The latter, instead, constitutes a major period of stellar mass formation in the SMC. Indeed, we confirm that the SFR was moderately low at even older ages in the SMC.
These findings are still to be further explored, and fully interpreted in terms of the possible scenarios for the evolution of the SMC. Although they clearly confirm many previous claims in the literature, they also provide significant more detail on several aspects, such as the wide-scale distributions of the populations with different stellar ages.
The SFH data are available at http://stev.oapd.inaf.it/VMC_SFHdata/. The analysis of additional VMC data, that over the next four years will complete the SMC and LMC mosaic, is in progress.
Acknowledgments
We thank the Cambridge Astronomy Survey Unit (CASU) and the Wide Field Astronomy Unit (WFAU) in Edinburgh for providing calibrated data products under the support of the Science and Technology Facility Council (STFC) in the UK. RdG acknowledges partial research support from the National Natural Science Foundation of China (NSFC) through grant 11373010. This work was partially supported by the Argentinian institutions CONICET and Agencia Nacional de Promoción Científica y Tecnológica (ANPCyT). PM acknowledges the support from the ERC Consolidator Grant funding scheme (project STARKEY, G.A. n. 615604).
Appendix A Homogenized deep tiles and PSF photometry
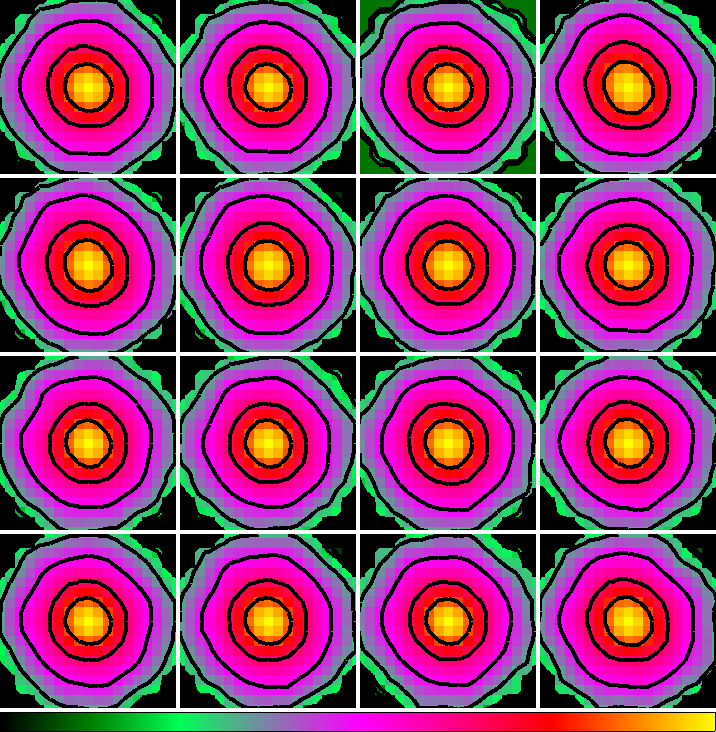
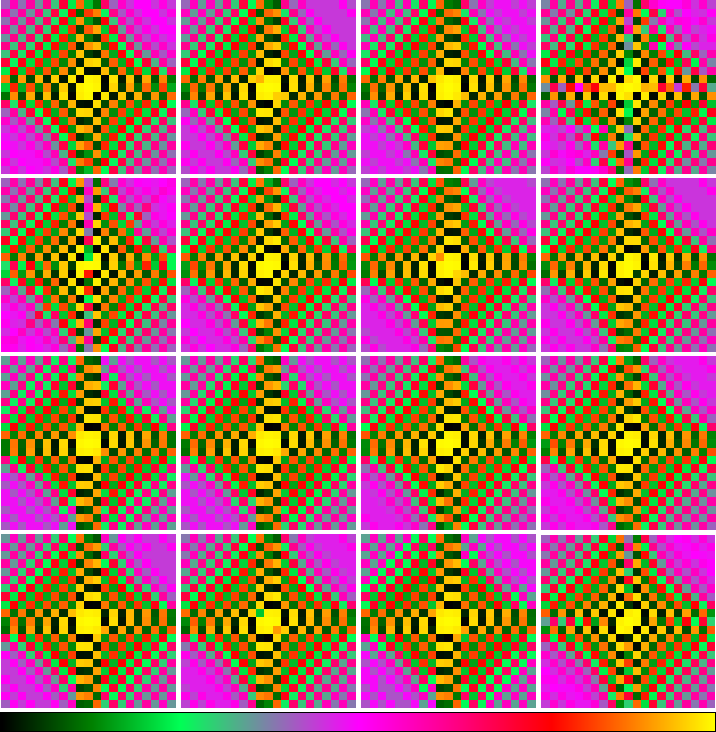
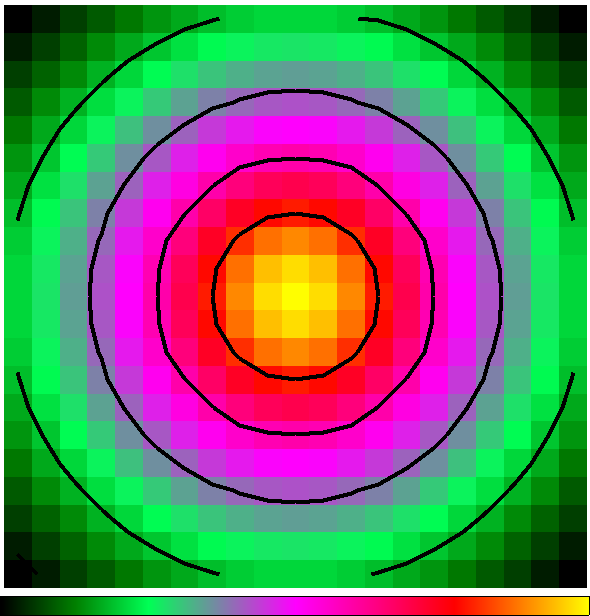
To generate a deep tile we combine images from different epochs (at least three in and and twelve in the band), each one formed by the combination of six pawprint images. These images are stacked single exposures reaching a total exposure time of seconds in and , and seconds in , for each pawprint888The average observing time across the deep tile is about twice these values.. Variations of the seeing occurring over these timescales could affect the PSF shape on the final deep tile, as a function of position. To avoid this, we apply a homogenization method to correct the PSF on each detector, in each pawprint image, in each epoch, to a constant and homogeneous PSF model, before generating a deep tile. We proceed as follow:
-
1.
First we derive the effective PSF model (EPSF) on pawprint images of a given epoch. To do that we assume a constant PSF across each detector of the VIRCAM camera, and use the IRAF/DAOPHOT tasks to find the best-fit PSF model. Usually, it corresponds to a Moffat function profile. Examples of such EPSFs are shown in the left panel of Fig. 19.
-
2.
Afterwards, we generate a symmetric Moffat function reference PSF model (RPSF) with a half-flux radius (HFR) equal to the largest HFR of the EPSF model of all detectors, in all pawprints images, at a given epoch.
-
3.
Subsequently, using a Fourier deconvolution method we derive the kernels that, when convolved with the pawprint images, convert them to images with a homogeneous RPSF model. An example of kernels and its RPSF model, applied on a pawprint image are illustrated in the central and right panels of Fig. 19.
- 4.
With this method, we obtain epoch images (in both pawprint and tile formats) with a homogeneous PSF, of course degraded to the worst pawprint at a given epoch, but gaining on quality of photometry in the final deep tile. The final deep tile image in fact presents a constant, round and homogeneous PSF, that allows us to perform aperture or PSF photometry on the entire tile without correction on the final catalog and optimising to improve the PSF photometry. Usually, variations in the seeing less than , that represent most of seeing differences in the VMC data set, are well corrected with this methodology and the degradation of the final deep tile is less than , compared with the original (non-homogenized) deep tile.
Having a homogenized tile image is also important for the evaluation of errors and completeness through very extensive artificial star tests (AST, see Sect. 2.2), preventing the occurrence of systematic errors due to differences between the PSF model used to simulate the artificial stars, and the PSF of real stars on the image.
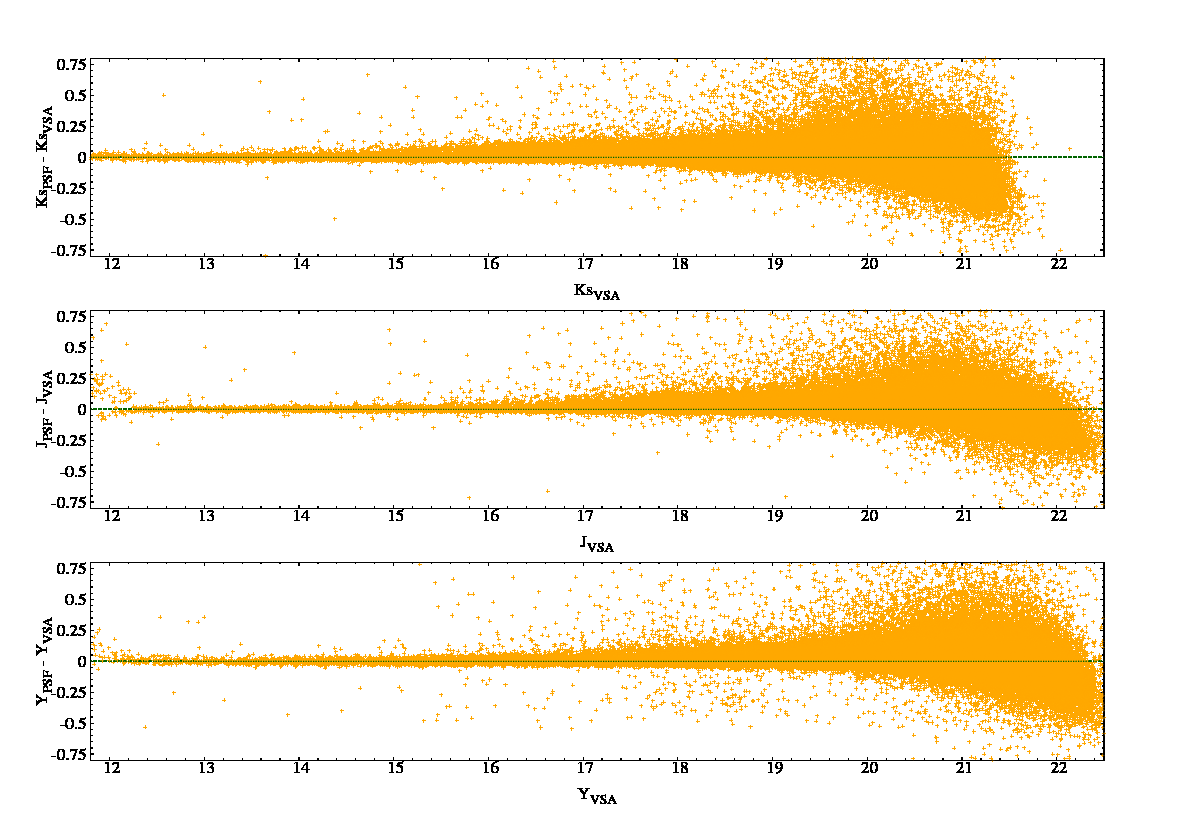
Finally, a comparison between our homogenized PSF photometry and the VSA aperture photometry is shown in Fig. 20. It reveals that the two photometries are similar, to within 0.1 mag, down to depths of 22 mag in and , and 21.5 mag in . Of course, differences are larger in high density fields or in the centres of star clusters, where the PSF photometry is expected to be more reliable.
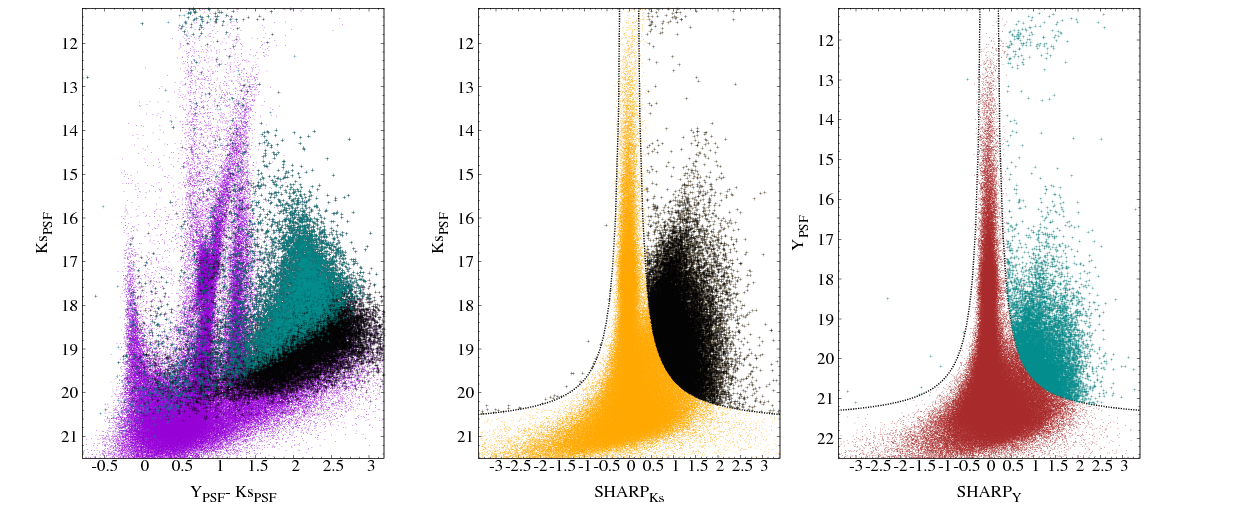
Figure 21 shows an example of the efficiency of the DAOPHOT parameter “sharp” in separating between point-like sources and extended objects – supposed to be stars and galaxies, respectively. Simple cuts in the sharp versus magnitude diagram (central and right panels) are able to isolate most stars, which have sharp values close to zero. Significant groups of objects with different sharpness are found both at the brightest and faintest magnitudes (black and cyan points). The former are simply partially-saturated stars at mag. The latter are mainly background galaxies. Examination of the CMDs (left panel) reveals that they are mainly located in the red part of the CMD. Fortunately, the bulk of the galaxies are redder than most SMC and MW foreground stars.
Appendix B Photometric zeropoints
As described in Rubele et al. (2012), we have estimated the differences between the calibration equations provided by CASU (eq. 1) and those predicted by the theoretical models which are, by construction, strictly on a Vegamag system (where Vega star has a null magnitude in all filters). The same process is repeated for this work, since we are using a different version of VSA data, and improved photometry. The basic idea is to reproduce, with the aid of stellar models, the same sort of photometric data used by CASU in the original calibration of VISTA data from 2MASS observations.
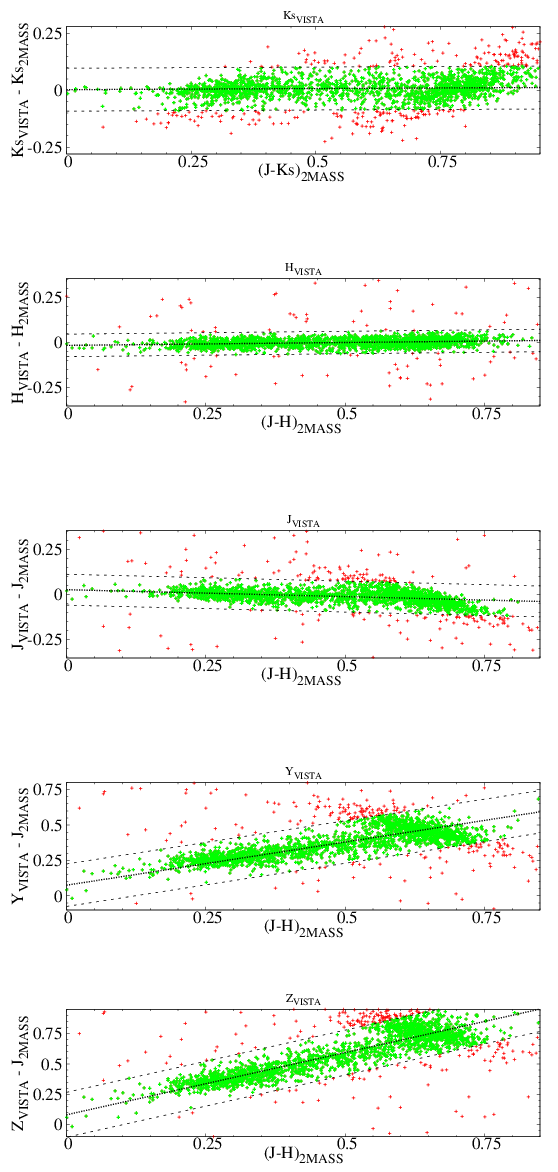
We proceed in the following way: First we generate a synthetic model of the Milky Way (MW), containing both 2MASS and VISTA filters, using the TRILEGAL code (Girardi et al., 2005). The simulated region has a total area of deg2 towards the SMC. The typical 2MASS photometric errors were added to the simulations following Bonatto, Bica & Girardi (2004). They dominate the error distribution compared to VISTA data. Then, we fit the distributions of these points in the colour-colour diagrams shown in Fig. 22, keeping the slope fixed at the same value as adopted by CASU, and adopting a sigma clipping of . For the best-fit equations we obtain:
| (1) | |||||
These fits imply offsets of mag in , in , in , in and in , between the model Vega-magnitudes and the CASU calibrations, reflecting the fact that the underlying colour-colour relations are not strictly linear as assumed in the calibrating equations. We apply these offsets to our stellar models (Sect. 3.2), thus converting them to the same set of ZPs as the observations, before starting the work of SFH-recovery.999Although we just use the offsets in , and , those in and are also provided here, so that everybody can convert the PARSEC isochrones (http://stev.oapd.inaf.it/cmd) – which are provided in a strict Vegamag VISTA system – into something more similar to the v1.1 and v1.2 VSA data.
References
- Bertin et al. (2002) Bertin E., Mellier Y., Radovich M., Missonnier G., Didelon P., Morin B., 2002, in Astronomical Society of the Pacific Conference Series, Vol. 281, Astronomical Data Analysis Software and Systems XI, D. A. Bohlender, D. Durand, & T. H. Handley, ed., pp. 228–+
- Besla et al. (2007) Besla G., Kallivayalil N., Hernquist L., Robertson B., Cox T. J., van der Marel R. P., Alcock C., 2007, ApJ, 668, 949
- Bica & Schmitt (1995) Bica E. L. D., Schmitt H. R., 1995, ApJS, 101, 41
- Bolatto et al. (2007) Bolatto A. D. et al., 2007, ApJ, 655, 212
- Bonatto, Bica & Girardi (2004) Bonatto C., Bica E., Girardi L., 2004, A&A, 415, 571
- Bressan et al. (2012) Bressan A., Marigo P., Girardi L., Salasnich B., Dal Cero C., Rubele S., Nanni A., 2012, MNRAS, 427, 127
- Caffau et al. (2011) Caffau E., Ludwig H.-G., Steffen M., Freytag B., Bonifacio P., 2011, Sol. Phys., 268, 255
- Caldwell & Coulson (1986) Caldwell J. A. R., Coulson I. M., 1986, MNRAS, 218, 223
- Cardelli, Clayton & Mathis (1989) Cardelli J. A., Clayton G. C., Mathis J. S., 1989, ApJ, 345, 245
- Carrera et al. (2008) Carrera R., Gallart C., Aparicio A., Costa E., Méndez R. A., Noël N. E. D., 2008, AJ, 136, 1039
- Chabrier (2003) Chabrier G., 2003, PASP, 115, 763
- Chiosi & Vallenari (2007) Chiosi E., Vallenari A., 2007, A&A, 466, 165
- Cignoni et al. (2012) Cignoni M., Cole A. A., Tosi M., Gallagher J. S., Sabbi E., Anderson J., Grebel E. K., Nota A., 2012, ApJ, 754, 130
- Cignoni et al. (2013a) —, 2013a, ApJ, 775, 83
- Cignoni et al. (2013b) —, 2013b, ApJ, 775, 83
- Cioni et al. (2011) Cioni M.-R. L. et al., 2011, A&A, 527, A116+
- Correnti et al. (2014) Correnti M., Goudfrooij P., Kalirai J. S., Girardi L., Puzia T. H., Kerber L., 2014, ApJ, 793, 121
- Cross et al. (2012) Cross N. J. G. et al., 2012, A&A, 548, A119
- de Grijs & Goodwin (2008) de Grijs R., Goodwin S. P., 2008, MNRAS, 383, 1000
- Dolphin (2002) Dolphin A. E., 2002, MNRAS, 332, 91
- Dolphin et al. (2001) Dolphin A. E., Walker A. R., Hodge P. W., Mateo M., Olszewski E. W., Schommer R. A., Suntzeff N. B., 2001, ApJ, 562, 303
- Emerson et al. (2004) Emerson J. P. et al., 2004, in Society of Photo-Optical Instrumentation Engineers (SPIE) Conference Series, Vol. 5493, Society of Photo-Optical Instrumentation Engineers (SPIE) Conference Series, P. J. Quinn & A. Bridger, ed., pp. 401–410
- Gardiner & Hawkins (1991) Gardiner L. T., Hawkins M. R. S., 1991, MNRAS, 251, 174
- Girardi et al. (2002) Girardi L., Bertelli G., Bressan A., Chiosi C., Groenewegen M. A. T., Marigo P., Salasnich B., Weiss A., 2002, A&A, 391, 195
- Girardi et al. (2008) Girardi L. et al., 2008, PASP, 120, 583
- Girardi et al. (2013) —, 2013, MNRAS, 431, 3501
- Girardi et al. (2005) Girardi L., Groenewegen M. A. T., Hatziminaoglou E., da Costa L., 2005, A&A, 436, 895
- Girardi, Rubele & Kerber (2009) Girardi L., Rubele S., Kerber L., 2009, MNRAS, 394, L74
- Girardi et al. (2010) Girardi L. et al., 2010, ApJ, 724, 1030
- Gómez et al. (2014) Gómez F. A., Besla G., Carpintero D. D., Villalobos Á., O’Shea B. W., Bell E. F., 2014, ArXiv e-prints
- Gonidakis et al. (2009) Gonidakis I., Livanou E., Kontizas E., Klein U., Kontizas M., Belcheva M., Tsalmantza P., Karampelas A., 2009, A&A, 496, 375
- Gordon et al. (2003) Gordon K. D., Clayton G. C., Misselt K. A., Landolt A. U., Wolff M. J., 2003, ApJ, 594, 279
- Goudfrooij et al. (2014) Goudfrooij P. et al., 2014, ApJ, 797, 35
- Goudfrooij et al. (2009) Goudfrooij P., Puzia T. H., Kozhurina-Platais V., Chandar R., 2009, AJ, 137, 4988
- Hambly et al. (2004) Hambly N. C., Mann R. G., Bond I., Sutorius E., Read M., Williams P., Lawrence A., Emerson J. P., 2004, in Society of Photo-Optical Instrumentation Engineers (SPIE) Conference Series, Vol. 5493, Society of Photo-Optical Instrumentation Engineers (SPIE) Conference Series, P. J. Quinn & A. Bridger, ed., pp. 423–431
- Harris (2007) Harris J., 2007, ApJ, 658, 345
- Harris & Zaritsky (2001) Harris J., Zaritsky D., 2001, ApJS, 136, 25
- Harris & Zaritsky (2004) —, 2004, AJ, 127, 1531
- Haschke, Grebel & Duffau (2011) Haschke R., Grebel E. K., Duffau S., 2011, AJ, 141, 158
- Haschke, Grebel & Duffau (2012) —, 2012, AJ, 144, 107
- Indu & Subramaniam (2011) Indu G., Subramaniam A., 2011, A&A, 535, A115
- Irwin et al. (2004) Irwin M. J. et al., 2004, in Society of Photo-Optical Instrumentation Engineers (SPIE) Conference Series, Vol. 5493, Society of Photo-Optical Instrumentation Engineers (SPIE) Conference Series, P. J. Quinn & A. Bridger, ed., pp. 411–422
- Israel et al. (2010) Israel F. P., Wall W. F., Raban D., Reach W. T., Bot C., Oonk J. B. R., Ysard N., Bernard J. P., 2010, A&A, 519, A67
- Ita et al. (2004) Ita Y. et al., 2004, MNRAS, 347, 720
- Kallivayalil et al. (2013) Kallivayalil N., van der Marel R. P., Besla G., Anderson J., Alcock C., 2013, ApJ, 764, 161
- Kerber et al. (2009) Kerber L. O., Girardi L., Rubele S., Cioni M.-R., 2009, A&A, 499, 697
- Laney & Stobie (1986) Laney C. D., Stobie R. S., 1986, MNRAS, 222, 449
- Marigo et al. (2008) Marigo P., Girardi L., Bressan A., Groenewegen M. A. T., Silva L., Granato G. L., 2008, A&A, 482, 883
- Moretti et al. (2014) Moretti M. I. et al., 2014, MNRAS, 437, 2702
- Nidever et al. (2011) Nidever D. L., Majewski S. R., Muñoz R. R., Beaton R. L., Patterson R. J., Kunkel W. E., 2011, ApJ, 733, L10
- Nidever et al. (2013) Nidever D. L., Monachesi A., Bell E. F., Majewski S. R., Muñoz R. R., Beaton R. L., 2013, ApJ, 779, 145
- Noël et al. (2009) Noël N. E. D., Aparicio A., Gallart C., Hidalgo S. L., Costa E., Méndez R. A., 2009, ApJ, 705, 1260
- Olsen et al. (2011) Olsen K. A. G., Zaritsky D., Blum R. D., Boyer M. L., Gordon K. D., 2011, ApJ, 737, 29
- Peek & Graves (2010) Peek J. E. G., Graves G. J., 2010, ApJ, 719, 415
- Piatti (2010) Piatti A. E., 2010, A&A, 513, L13
- Piatti (2011a) —, 2011a, MNRAS, 416, L89
- Piatti (2011b) —, 2011b, MNRAS, 418, L40
- Piatti (2011c) —, 2011c, MNRAS, 418, L69
- Piatti (2012) —, 2012, MNRAS, 422, 1109
- Rezaeikh et al. (2014) Rezaeikh S., Javadi A., Khosroshahi H., van Loon J. T., 2014, MNRAS, 445, 2214
- Ripepi et al. (2014) Ripepi V. et al., 2014, MNRAS, 437, 2307
- Ripepi et al. (2012) —, 2012, MNRAS, 424, 1807
- Rubele et al. (2012) Rubele S. et al., 2012, A&A, 537, A106
- Schlegel, Finkbeiner & Davis (1998) Schlegel D. J., Finkbeiner D. P., Davis M., 1998, ApJ, 500, 525
- Soszyński et al. (2010a) Soszyński I. et al., 2010a, Acta Astron., 60, 17
- Soszyński et al. (2010b) Soszyński I., Udalski A., Szymañski M. K., Kubiak J., Pietrzyñski G., Wyrzykowski Ł., Ulaczyk K., Poleski R., 2010b, Acta Astron., 60, 165
- Soszyński et al. (2011) Soszyński I. et al., 2011, Acta Astron., 61, 217
- Stanimirović, Staveley-Smith & Jones (2004) Stanimirović S., Staveley-Smith L., Jones P. A., 2004, ApJ, 604, 176
- Subramanian & Subramaniam (2009) Subramanian S., Subramaniam A., 2009, A&A, 496, 399
- Subramanian & Subramaniam (2012) —, 2012, ApJ, 744, 128
- Tatton (2014) Tatton B., 2014, in PhD Thesis, University of Keele, UK
- Tsujimoto & Bekki (2009) Tsujimoto T., Bekki K., 2009, ApJ, 700, L69
- van der Marel (2001) van der Marel R. P., 2001, AJ, 122, 1827
- Weisz et al. (2013) Weisz D. R., Dolphin A. E., Skillman E. D., Holtzman J., Dalcanton J. J., Cole A. A., Neary K., 2013, MNRAS, 431, 364
- Westerlund (1990) Westerlund B. E., 1990, A&A Rev., 2, 29
- Yoshizawa & Noguchi (2003) Yoshizawa A. M., Noguchi M., 2003, MNRAS, 339, 1135
- Yozin & Bekki (2014) Yozin C., Bekki K., 2014, MNRAS, 443, 522
- Zaritsky et al. (2002) Zaritsky D., Harris J., Thompson I. B., Grebel E. K., Massey P., 2002, AJ, 123, 855