Many-Body electronic structure calculations of Eu doped ZnO
Abstract
The formation energies and electronic structure of europium doped zinc oxide has been determined using DFT and many-body methods. In the absence of intrisic defects we find that the europium- states are located in the ZnO band gap with europium possessing a formal charge of 2+. On the other hand, the presence of intrinsic defects in ZnO allows intraband transitions otherwise forbidden in atomic europium. This result coorroborates with recently observed photoluminescence in the visible red region Geburt et al. (2014).
I Introduction
Doping has been widely used to tailor the electronic, magnetic and optical properties of semiconductors. Wide band-gap semiconductors such as ZnO are attractive for ultraviolet light-emitting diodes, lasers and high-power photonic applications. In ZnO, rar-earth elements can be incorporated in the material and the long life times of the excited states allow for an easy realization of population inversion with promising applications in optoelectronic applications Ishizumi et al. (2005); Peres et al. (2007); Pan et al. (2009); Ronning et al. (2010); Geburt et al. (2014). ZnO has a large band gap of 3.4 eV and a high thermal conductivity, enabling new electroluminescent devices.
Channeling experiments Wahl et al. (2003, 2004) indicate, that rare-earth elements in ZnO are preferentially incorporated at cation sites. More recent photoluminescence (PL) and photoluminescence excitation (PLE) investigations on ZnO nanoparticles corroborate this finding Du et al. (2008); Ji et al. (2009). PL investigations of Eu-doped ZnO nanoneedles showed sharp emission lines from Eu3+, suggesting the emission arises from intra-4 transitions, in addition to the ZnO interband emission Ebisawa et al. (2008). The f to f transitions are forbidden in the isolated atom. However the spherical symmetry is broken when the impurity is incorporated into the ZnO matrix. Besides Eu, optical emission from rare-earth orbitals has been achieved in ZnO nanowires implanted with erbium and ytterbium Ronning et al. (2010) and thin ZnO films doped with erbium, samarium and europium Petersen et al. (2010); Dai et al. (2011); Tsuji et al. (2012); Mezdrogina et al. (2012). The above experimental investigations have suggested explanations for the optical activation of rare-earths in ZnO Akazawa and Shinojima (2013); Yang et al. (2014) by means of substitutional hydrogen incorporation Akazawa and Shinojima (2013) or formation of defect complexes Du et al. (2008); Wang et al. (2011); Yang et al. (2014).
Theoretical investigations using density functional theory (DFT) in the generalized-gradient approximation (GGA) have performed for Eu doped ZnO Assadi et al. (2011); Chen et al. (2013), but were unable to ascertain the origin of the experimentally observed emission in ZnO. The main challenge here is the correct description of both ZnO band edges and defect states. It is common understanding that the use of local exchange-correlation functionals wrongly described the ZnO band gap, which could lead to misleading conclusions on the location of the impurity rare-earth -states. It has been shown that the correct description of the band gap is of paramount importance for the understanding of impurity and defect states in semiconductorsLany and Zunger (2008, 2009, 2010); Janotti and de Walle (2009); Sarsari et al. (2013). Besides, intrinsic defects may also play an important role, since during ion implantation they are often introduced in ZnO. Jiang et al. Jiang et al. (2009) have shown that for many open - or -shell compounds the GW approach can provide a consistent and accurate treatment for both localized and itinerant states.
Using DFT calculations and the technique, we have previously shown that a complex containing a single oxygen interstitial defect and an europium atom substituting a zinc atom is a probable candidate to explain the observed emission in the red region of the spectrum in europium doped ZnO nanowires,Geburt et al. (2014). Note that GW calculations do not include excitonic electron-hole interactions.
In this work we show calculations, as implemented in VASP, for Eu-doped ZnO. Besides the work reported in Ref.Geburt et al. (2014) we have considered the presence of the most common defects in ZnO, such as oxygen and zinc vacancies and interstitials. The wave functions are kept fixed to the GGA level, whereas the eigenvalues are updated in the Green’s function only. Here we show that this kind of defect has a relatively low formation energy and suggest possible mechanisms for the formation of such defect. Besides, we investigate other defects and calculate their formation energies and electronic structure.
II Computational details
In this work we have employed density functional theory (DFT) Hohenberg and Kohn (1964); Kohn and Sham (1965) and many-body techniques Hedin (1965) to investigate the formation energies and electronic structure of Eu doped ZnO. The projected augmented wave method (PAW) Blöchl (1994) has been used as implemented in the Vienna Ab-initio Package (VASP) Kresse and Joubert (1999); Shishkin et al. (2007). A 332 supercell containing 72 atoms with a (221) k-point sampling and a cutoff of 500 eV is used to calculate all isolated intrinsic defects and complexes. For Eu2O3 we have used (222) k-points. For Eu metal we adopted a bcc structure with a (666) k-point mesh.
II.1 Thermodynamic properties
To verify the thermodynamic stability of the investigated defect complexes, we follow the approach derived by van de Walle and Neugebauervan de Walle and Neugebauer (2004). The formation energy of a neutral defect or impurity is defined as:
| (1) |
where Etot(ZnO-defect) is the total energy of a defective supercell and EtotZnO-bulk is the total energy for the supercell of pure ZnO. is the number of atoms of type (defects or impurities) that have been added to or removed from the supercell and is the corresponding chemical potential of each species, q is the charge of the defect. The Fermi level is referenced with respect to the valence band maximum of the host.
The lower bound of the chemical potential corresponds to the total absence of impurities/defects in the material. An upper bound on the chemical potential is given by the energy of the elemental bulk phase or other solubility-limiting phases. Formation of Eu clusters (metal) can be avoided by imposing the europium chemical potential to obey to:
| (2) |
where Eu-bulk is the total energy of europium bulk in a bcc structure. Formation of europium precipitates are avoided by considering the bound for Eu2O3, a very stable phase of europium:
| (3) |
The oxygen and zinc chemical potential are not independent, but related by , where , and are the zinc, oxygen and zinc oxide chemical potentials, respectively. is the formation enthalpy of ZnO. Combining Eq.2 and 3 and these conditions, we obtain the following relations:
| (4) |
The chemical potential of europium oxide can be writen as:
| (5) |
where is the enthalpy of formation of europium oxide and and are the europium bulk and oxygen molecule chemical potentials, respectively. This results in
| (6) |
Here =0 for oxygen rich and =1 for oxygen poor conditions.
II.2 Electronic structure
The many-body methodology that is underlying the approximation goes back to pioneering work by Kadanoff and Baym Baym and Kadanoff (1961); Baym (1962) and Hedin Hedin (1965). In -based approximations, the screening of the Coulomb interaction, that enters the non-local self-energy operator, is calculated microscopically. This description of the screened potential is a main advantage of many-body methods over other approaches, like hybrid functional DFT, where screening is only included phenomenologically.
The single shot G0W0 approximation starting from GGA calculations often yields too small band gaps. It was suggested von Barth and Holm (1996); Shishkin et al. (2007) that partially or fully selfconsistent schemes, in which either Green’s function G () or both the Green’s function and the dielectric matrix () are updated can improve the agreement with experiments. We should mention that the implementation of selfconsistent or in VASP has the shortcoming, that only calculations that maintain a quasi-particle picture are possible, i.e. satellite peaks can not be accounted for. Even though this means that these are technically not ”full” calculations, we will for simplicity adopt the notation to call them and in the following. For detailed information on the implementation we refer the reader to Refs. Shishkin et al. (2007); Rinke et al. (2005); Usuda et al. (2002); Berger et al. (2012); Hüser et al. (2013); Malashevich et al. (2014).
III Results
III.1 Thermodynamic properties
It is in principle possible to calculate GW total energies by using the Galitskii-Migdal formula Fetter and Walecka (2003). In Ref. Holm (1999) it was found that for the electron gas, the total energies can be well described using schemes. Alternative approaches to tackle the formation energy in connection with methods have been proposed et al. (2009); Samsonidze et al. (2011). In VASP, the calculation of formation energies at level is not readily possible. Therefore, we have decided to calculate the formation energies at GGA level. This can be justified taking into account that the GGA calculations are used as starting point for more accurate calculations using the method. We would like to mention that we have performed PBE0 calculations for some defects and we note that the location of Eu--states are strongly dependent on the amount of HF included in the functional.
For europium oxide, the formation enthalpy is calculated to be =-14.43 eV compared with the experimental value of -16.51 eV bla (2014). For zinc oxide the formation enthalpy is =-2.90 eV, which is in good agreement with other GGA values Oba et al. (2011) and even GGA+U calculations Lany and Zunger (2010). This discrepancy is probably due to the wrong description of the oxygen molecule, as has been discussed in Ref.Perdew et al. (1996). Using these values, we can obtain the binding energy of the defect complexes, which are defined as
| (7) |
where is the formation energy of the defects and is the formation energy of isolated defects calculated according to Eq.(1). The calculated values are shown in Table 1 and a negative value means that the complex is stable. Calculations for intrinsic defects can reproduce well previous calculations reported using local functionals Oba et al. (2010, 2011); Janotti and Van de Walle (2007). Neutral oxygen vacancies have a low formation energy under oxygen poor-conditions. On the other hand, zinc vacancies can be formed under Zn-poor preparation conditions. Oxygen and zinc interstitials, as expected, have high formation energies, due to their size Janotti and Van de Walle (2007). For Eu doped ZnO at cation site we obtain a formation energy of 2.42 eV under O-rich conditions. Incorporation of Eu at interstitial positions is highly unfavorable, due to the strain Eu causes in the ZnO, leading to a strongly distorted lattice. Similar results have been reported in Ref. Ney et al. (2012). Complex formation with zinc and oxygen vacancies and zinc interstitials have a much higher formation energy. This can be understood by considering size effects, which causes a large strain in the lattice. As the defect complexes are formed in experiments under extreme non-equilibrium conditions (like, e.g.,ion-implantation) we find it more appropriate to report the binding energies of the defect complexes and hence their stability against dissociation.
As we can see the most stable neutral defect is under O-rich conditions the Eu-Oi(o) complex. It is interesting to point out that the formation of neutral oxygen defects at interstitial sites in pure ZnO has a high formation energy under thermodynamic equilibrium. However, as has been shown in Ref. Janotti and Van de Walle (2007) the diffusion barrier for this kind of defect is relatively low (around 0.2 eV). Therefore, once this defect is formed under ion implantation (non-equilibrium conditions), it can rapidly diffuse in the material and form complexes with europium atoms. This may explain why the complex Eu-Oi(o) is so stable in ZnO.
| Defect | (eV) | (eV) | ||
|---|---|---|---|---|
| O-rich | O-poor | O-rich | O-poor | |
| 2.42 | 7.44 | |||
| 2.58 | 5.48 | |||
| 3.38 | 6.28 | |||
| 3.20 | 0.30 | |||
| 1.37 | 4.27 | |||
| 6.68 | 3.78 | |||
| 4.52 | 14.67 | -0.48 | 1.75 | |
| 4.4 | 14.55 | -1.40 | 0.83 | |
| 6.1 | 10.45 | 0.48 | 2.70 | |
| 10.9 | 13.80 | 7.11 | 2.09 | |
| 9.88 | 12.78 | 0.79 | 1.56 | |
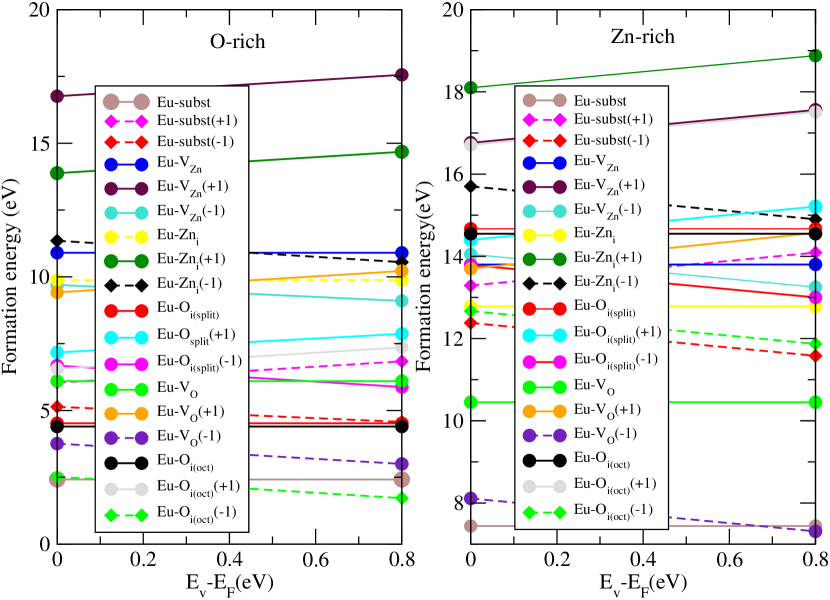
Now let us discuss the charged complexes. In Fig.1 we show the formation energies of several Eu-complexes as a function of the Fermi energy at O-rich and Zn-rich conditions. The top of the valence band for all defects calculations was aligned with the top of the valence band of the host ZnO using the averaged electrostatic potential as described in Ref.van de Walle and Neugebauer (2004). We see that the most stable structure at O-rich conditions is a complex of Eu-O in the -1 charge state. Although this is the thermodynamically most stable defect, followed by Eu-subst and , we argue that the fact that the neutral Eu-Oi(oct) correponds to the experimental f-f transition is very appealing. Obviouly we cannot rule out the co-existence of these other defects during the preparation conditions. Further calculations are needed to clarify whether these defects also have transitions in the experimentally observed region. On the other hand at Zn-rich the defect Eu-subst is the most stable one for between 0 and 0.6. For values lerger than that the defect Eu-VO in the -1 charge state is the most stable one. It is important to note that under Zn-rich conditions all defects have a very high formation energy, which is an indication that they are unlikely to form at these conditions.
.
III.2 Electronic properties
Because calculations can be performed using different approximations, the results for the theoretical band gap of ZnO has been under debate. Parameters controlling the calculations include the number of bands Shih et al. (2010); Friedrich et al. (2011); Klimeš et al. (2014), the exchange-correlation potential for the starting wave functionLany and Zunger (2010) as well as the use of approximate models for the screening, like plasmon pole approximations Shih et al. (2010).
Depending on the starting functional and the details of the calculation, values between 2.1 and 3.6 eV are obtained for Shishkin et al. (2007); Kang et al. (2014); Shih et al. (2010); Friedrich et al. (2011); Sarsari et al. (2013); Hüser et al. (2013); Malashevich et al. (2014); Klimeš et al. (2014), between 2.54-3.6 for GW0 Sarsari et al. (2013); Kang et al. (2014); Friedrich (2014); Hüser et al. (2013); Petretto and Bruneval (2014) and between 3.2-4.3 for GW Usuda et al. (2002); Sarsari et al. (2013).
We start by validating the method for bulk ZnO. For this purpose we consider a four-atom wurzite ZnO unit cell and employ a 888 k point sampling with an energy cutoff of 500 eV. The resulting band gaps and energetic positions of the Zn-3 states (with respect to the valence band maximum set at zero) for several levels of GW calculations are a) PBE: 0.8 and -5.1 eV, b) PBE0: 3.2 and -7.3 eV, c) HSE06: 2.5 and -7.1 eV, d) PBE+: 4.3 and -7.2 eV, e) PBE+: 3.3 and -7.0 eV.
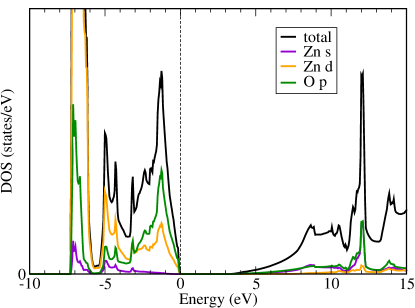
For the calculation, a cutoff of 200 eV for the response functions , as well as 1024 bands have been employed. It has been shown that a large number of bands is necessary to obtain properly converged results in earlier one-shot calculations Shih et al. (2010); Friedrich et al. (2011); Klimeš et al. (2014). We speculate that the deviations to Ref. Kang et al. (2014) are due to the rather low number of bands in that publication. The results are shown in Fig. 2. We find a band gap of 3.3 eV in reasonable agreement with the experimental value of 3.44 eV Madelung (1996), as well as with other all-electron calculations Friedrich (2014); Klimeš et al. (2014). It should be pointed out that recently norm conserving pseudopotentials were introduced in VASP to improve calculations Klimeš et al. (2014). However, as shown in Ref. Klimeš et al. (2014), we expect these to only lead to minor modifications of the bandstructure of up to 0.2eV, not changing the main conclusions of this work. It should be noted that that use of -based methods has been able to predict the positions of lanthanide -states in NiO Anisimov et al. (1997) and CeO2 Jiang et al. (2009).
The center of the Zn- orbitals is localted at -7 eV, in agreement with previous -calculations for ZnO Shishkin et al. (2007); Fuchs et al. (2007); Friedrich (2014). We want to point out, that a fully-selfconsistent calculation results in a much too high quasi-particle gap of 4.2 eV. Again this agrees well with recent all-electron calculations that find a quasi-particle gap of 4.3 Friedrich (2014).
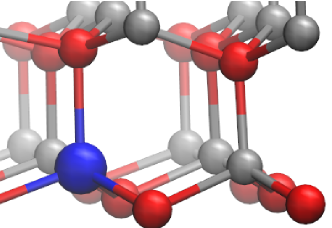
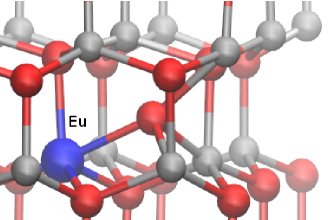
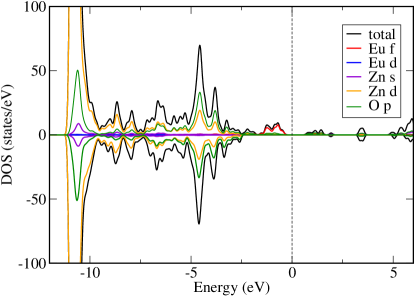
From here on we show only results for GW0 calculations. It has been shown that the position of defect states is not strongly influenced by the number of empty bands and the response function cutoff Sarsari et al. (2013). The relaxed geometry of Eu at a zinc lattice position without the presence of intrinsic defects is shown in Fig. 3. The europium distance to nearest oxygen atoms are 2.23Å and 2.27Å for in-plane and c-direction, respectively. These values are slightly larger than the Zn-O bond lengths in pure ZnO. This means that if Eu is incorporated at a Zn lattice position, it should not disturb the lattice significantly. We would like to point out that in the supercell calculations, the ZnO bandgap is slightly to large, around 3.6-3.9eV. We attribute this to the reduced -point sampling in the supercell calculation. We also several tests with sc calculations, to also investigate the influence of a selfconsistent update of also the wave-functions. In these tests, we find that quasi-particle energies are only changed by up to 0.1-0.2eV between sc and calculations, supporting the use of the approximation in the following.
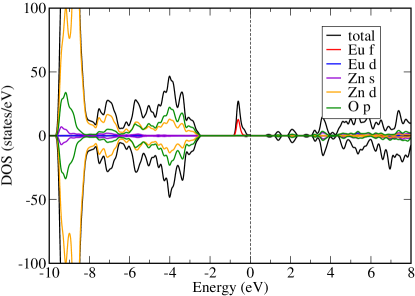
In Fig. 4 the electronic density-of-states of substitutionally incorporated Eu in this geometry is shown. The Eu- states lie within the band gap, around 2 eV above the VBM (valence band maximum), hybridize weakly with the Zn- and O- states. As expected for substitutional Eu at a Zn lattice position, Eu has a formal charge closer to 2+. The spin-up orbitals are fully occupied, giving a total magnetic moment of 7. Furthemore, the Eu -states lie deep in the conduction band of ZnO, 2.5 eV above the CBM, leading to an energetic difference to the Eu -states of over 3eV. Therefore, our results explain why the optical transition at 530 nm ( 2.3 eV) that is often observed additionally to the intra-f transitions for Eu incorporation into other host materials can not be found experimentally in Eu doped ZnO Petersen et al. (2010); Ronning et al. (2010).
A possible way to modify the oxidation state of Eu in the ZnO lattice is therefore a change of its environment. It is known that during ion implantation intrinsic defects are likely to form Ronning et al. (2010); Wang et al. (2011). We therefore investigated Eu doped ZnO in the presence of nearby oxygen and zinc vacancies as well as zinc and oxygen interstitials. In the presence of a neutral oxygen vacancy the Eu-O distances for neighboring oxygen atoms remain almost unchanged, compared to the case without vacancy, and increase slightly to 2.24Å. The geometry is shown in Fig. 5. The Eu-Zn distance is 3.27Åand relaxation of farther neighbors is insignificant.
The electronic structure for this system is shown in Fig. 6. The states due to the oxygen vacancy lie 1 eV above the VBM. This is in good agreement with calculations for pure ZnO (see e.g. Refs. Janotti and de Walle (2009); Oba et al. (2010, 2011)). The Eu -states are located now at 2.5 eV above the VBM. Moreover, we observe a small splitting of the Eu- states as well as a small hybridization with the Eu- and O- states. The splitting is caused by a shift of one of the seven Eu- states that we assume to be induced by changes in the local environment that affect the interaction matrix elements and therefore the charge distribution around the impurity.
Our GW0 results are in strong contrast to the findings of Ref. Assadi et al. (2011), where the Eu- states are energetically located directly above the VO states. We attribute this discrepancy to the choice of the GGA functional in Ref. Assadi et al. (2011), predicting a much too narrow band gap. On the other hand, the presence of the does not significantly change the formal charge around the Eu atom. Moreover, the positions of the Eu- spin down and Eu -states remain practically unchanged. Again this defects cannot explain the experimental observed transition in ZnO.
The relaxed geometry of the Eu+Zni defect is shown in Fig. 7. The bond lengths between the Eu atom and the nearest oxygen atoms are 2.19Å, 2.19Å and 2.24Å in the in-plane direction, and 2.41Å in the -direction. This is because Eu atom relaxes away from the Zn atom. The Eu-Zn distance is 2.72Å, while the distances to Zn second neighbors are 3.29Å.
The electronic structure of this system is shown in Fig. 8. The location of the Eu -states lies close to the conduction band minimum (CBM), around 2.9 eV above the VBM. We can infer a weak hybridization with both Zn- and Zn- states of the Zn interstitial atom. Similarly, a very small hybridization with the O- states is found. Here, the formal charge of the Eu atom remains close to 2+ with the spin-up -states occupied.
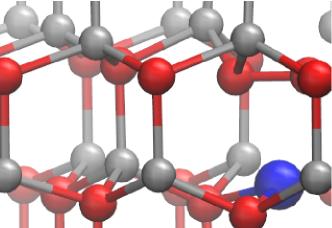
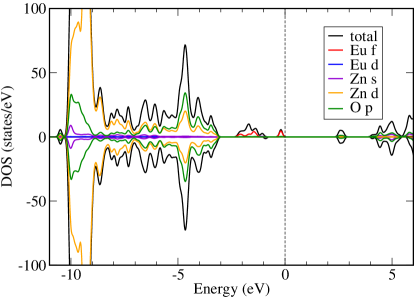
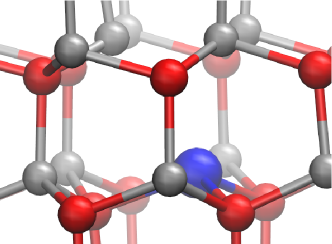
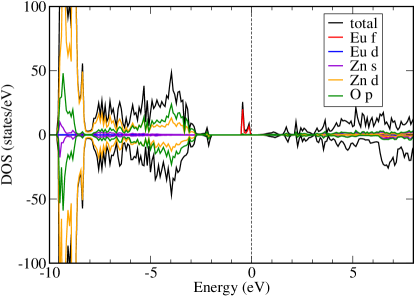
For the oxygen interstitial plus Eu defect, we have considered two geometries. The first consists of an Eu atom at substitutional Zn site next to an oxygen interstitial in dumbbell configuration Erhart et al. (2005). This configuration is shown in Fig. 9. In this case the lattice ralaxations are more pronounced, The Eu atom is shifted away from the interstitial complex, decreasing the Eu-O bond lengths to 2.21Å. The Eu-Zn distance is also slightly increased to 3.29Åand the distances to the oxygen atoms of the interstitial are 2.31Åand 2.33Å, respctively.
The electronic structure is presented in Fig. 10. We observe a splitting of the Eu- states that we attribute to a combination of the changed symmetry in the local environment. This affects both the interaction matrix elements as well as their screening, so that different Eu states are influences differently. While 6 of the Eu- are located closer to the VBM, the remaining occupied Eu- state lies about 1 eV higher in energy. We find contributions to the localized states from both and states. However, also in this case, the Eu atom possesses a formal charge of 2+ with all Eu- spin-up states fully occupied. The oxygen interstitial atom possesses a magetic moment of 0, a further confirmation, that no electron is transfered from the Eu atom to the oxygen site.
The geometry of Eu doped ZnO in the presence of a neutral Zn vacancy (VZn) is shown in Fig. 11. The Eu atom shifts towards the vacancy, increasing the in-plane Zn-Eu distance to 3.49Å and 3.40Å in comparison to 3.3Å that would correspond to Eu exactly on Zn lattice position. Consequently, the in-plane Eu-O distances also change, asymmetrically, to 2.09Å, 2.19Å and 2.24Å, respectively. Along the c-direction the Eu-O distance is 2.22Å. The corresponding electronic structure is shown in Fig. 12. We find no occupied Eu- states in the band gap. These states lie within the VB, close to the O- states and hybridize both with with O- and Zn- states. The local projected moment on the VZn site is 1, which is aligned anti-parallel to the magnetic moment on the Eu which is 6. However the fact that the Eu- states are energetically located inside the VB and the unoccupied Eu- state is energetically located at 2 eV above the VBM, does not fit with experimentally observed transition.
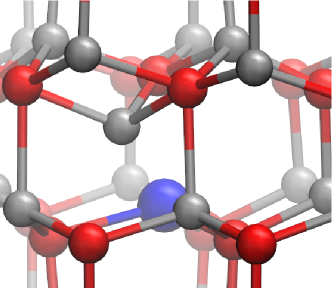
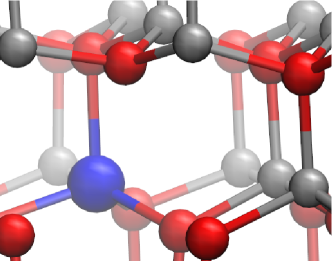
The other defect complex including an oxygen interstitial consists of an oxygen at a octahedral interstitial site next to an Eu at Zn lattice position. The corresponding atomic structure is shown in Fig. 13. We find much more pronounced lattice relaxations in this case, also involving second nearest neighbors. The Eu-Zn distance is 3.2Å, while the Eu-O bond lengths are 2.2Å to the oxygen atoms in the basal plane and 2.25Å to the oxygen along the -direction. The distance between the Eu atom and the oxygen interstitial is 2.24Å. This can be explained by looking at the coordination Eu adopts. The Eu-O distance to the nearest neighbors is very similar to Eu2O3, which possess a coordination number of and a radial distance of 2.33 Å according to RefFryxell et al. (2004).
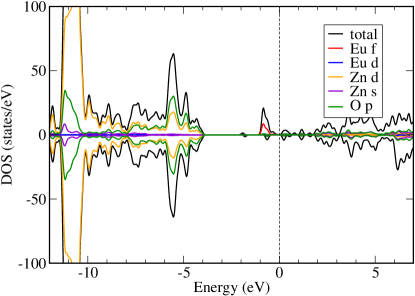
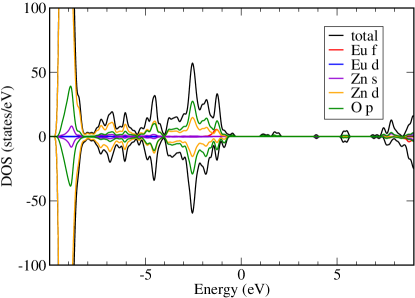
The corresponding electronic structure is shown in Fig. 14. We find the occupied Eu -states are located in the band gap, with the Eu- orbitals being occupied with six electrons. The occupied and unoccupied states are located at -0.7 eV and 1.3 eV, respectively. We find a small hybridization with O- and O-. The total magnetic moment of the complex is 5, determined by a magnetic moment of 6 spin up at the europium aligned anti-parallel to the magnetic moment of 1 at the oxygen interstitial atom. Therefore, we suggest that the intra-4 luminescence of the ZnO:Eu samples is most likely due to Eu+O complexes. We have also explored the mechanism for optical activation of Eu in ZnO reported in Ref. Akazawa and Shinojima (2013), where substitutional hydrogen at Zn lattice position next to an europium atom is suggested. However, this configuration does not change the formal charge of Eu.
In order to summarize the results discussed above we show the position of the defect levels with respect to the band edges of ZnO. The results are shown in Table 2. We show the relative position of Eu-f states for the complexes with respect to the top of the valence band of ZnO. The position of the Eu-f states were taken approximately in the middle of the -bands, since we cannot describe correctly with DFT the multiplets of the f-orbitals.
| Complex | |
|---|---|
| 2.8 | |
| 1.5/3.2 | |
| 2.5 | |
| 2.5/3.2 | |
| 1.0 | |
| 3.8 |
IV Conclusions
In conclusion, we have investigated Eu-doped ZnO using DFT and the many-body GW technique within the GW0 approximation. We find that the position and formal charge of the Eu- states is strongly dependent on the environment around the Eu atom. We conclude that the optical activity of Eu in ZnO is most likely due to Eu+O defect complexes, possibly either in a neutral or -1 charge state or in the presence of both. Finally, we believe our results can open the pathway for a better understanding of these complexes in zinc oxide.
Acknowledgements.
We acknowledge fruitful discussions with R. Röder, C. Ronning and H. Chacham and financial support from the Deutsche Forschungsgemeinschaft under the programm FOR1616. A. L. da Rosa would like to thank financial support from CNPq under the program “Science without Borders”. We also thank HLRN (Hannover/Berlin) for computational resources.References
- Geburt et al. (2014) S. Geburt, M. Lorke, A. L. da Rosa, T. Frauenheim, R. R der, T. Voss, U. Kaiser, W. Heimbrodt, and C. Ronning, Nano Letters 14, 4523 (2014).
- Ishizumi et al. (2005) A. Ishizumi, Y. Taguchi, A. Yamamoto, and Y. Kanemitsu, Thin Solid Films 486, 50 (2005).
- Peres et al. (2007) M. Peres, A. Cruz, S. Pereira, M. Correia, M. Soares, A. Neves, M. Carmo, T. Monteiro, A. Pereira, M. Martins, et al., Applied Physics A 88, 129 (2007), ISSN 0947-8396, URL http://dx.doi.org/10.1007/s00339-007-3941-9.
- Pan et al. (2009) C. Pan, C. Chen, J. Chen, P. Huang, G. Chi, C. Chang, F. Ren, and S. Pearton, Applied Surface Science 256, 187 (2009), ISSN 0169-4332, URL http://www.sciencedirect.com/science/article/pii/S0169433209011179.
- Ronning et al. (2010) C. Ronning, C. Borschel, S. Geburt, R. Niepelt, S. M ller, D. Stichtenoth, J. P. Richters, A. Dev, T. Voss, L. Chen, et al., physica status solidi (b) 247, 2329 (2010), ISSN 1521-3951, URL http://dx.doi.org/10.1002/pssb.201046192.
- Wahl et al. (2003) U. Wahl, E. Rita, J. G. Correia, E. Alves, J. P. Araújo, and T. I. Collaboration, Applied Physics Letters 82, 1173 (2003), URL http://link.aip.org/link/?APL/82/1173/1.
- Wahl et al. (2004) U. Wahl, J. G. Correia, E. Rita, E. Alves, J. C. S. B. D. Vries, V. Matias, A. Vantomme, and T. I. Collaboration, Hyperfine Interactions 159, 363 (2004).
- Du et al. (2008) Y.-P. Du, Y.-W. Zhang, L.-D. Sun, and C.-H. Yan, The Journal of Physical Chemistry C 112, 12234 (2008), eprint http://pubs.acs.org/doi/pdf/10.1021/jp802958x, URL http://pubs.acs.org/doi/abs/10.1021/jp802958x.
- Ji et al. (2009) S. Ji, L. Yin, G. Liu, L. Zhang, and C. Ye, The Journal of Physical Chemistry C 113, 16439 (2009), eprint http://pubs.acs.org/doi/pdf/10.1021/jp906501n, URL http://pubs.acs.org/doi/abs/10.1021/jp906501n.
- Ebisawa et al. (2008) K. Ebisawa, T. Okuno, and K. Abe, Japanese Journal of Applied Physics 47, 7236 (2008), URL http://jjap.jsap.jp/link?JJAP/47/7236/.
- Petersen et al. (2010) J. Petersen, C. Brimont, M. Gallart, G. Schmerber, P. Gilliot, C. Ulhaq-Bouillet, J.-L. Rehspringer, S. Colis, C. Becker, A. Slaoui, et al., Journal of Applied Physics 107, 123522 (pages 6) (2010), URL http://link.aip.org/link/?JAP/107/123522/1.
- Dai et al. (2011) Q. Q. Dai, L. Luo, F. Y. Huang, D. P. Xiong, X. Tang, and J. Chen, Materials Science Forum 687, 667 (2011).
- Tsuji et al. (2012) T. Tsuji, Y. Terai, M. H. B. Kamarudin, K. Yoshida, and Y. Fujiwara, Journal of Luminescence 132, 3125 (2012), ISSN 0022-2313, special Issue based on Symposium on rare-earth doped semiconductors and nanostructures for photonics at the E-MRS Fall 2011 meeting, URL http://www.sciencedirect.com/science/article/pii/S0022231311006958.
- Mezdrogina et al. (2012) M. Mezdrogina, M. Eremenko, S. Golubenko, and S. Razumov, Physics of the Solid State 54, 1235 (2012), ISSN 1063-7834, URL http://dx.doi.org/10.1134/S1063783412060248.
- Akazawa and Shinojima (2013) H. Akazawa and H. Shinojima, Journal of Applied Physics 114, 153502 (2013), URL http://scitation.aip.org/content/aip/journal/jap/114/15/10.1063/1.4825121.
- Yang et al. (2014) L. Yang, J. Dong, Y. She, Z. Jiang, L. Zhang, and H. Yu, Applied Physics Letters 104, 033109 (2014), URL http://scitation.aip.org/content/aip/journal/apl/104/3/10.1063/1.4863083.
- Wang et al. (2011) D. Wang, G. Xing, M. Gao, L. Yang, J. Yang, and T. Wu, The Journal of Physical Chemistry C 115, 22729 (2011), eprint http://pubs.acs.org/doi/pdf/10.1021/jp204572v, URL http://pubs.acs.org/doi/abs/10.1021/jp204572v.
- Assadi et al. (2011) M. Assadi, Y. Zhang, R.-K. Zheng, S. Ringer, and S. Li, Nanoscale Research Letters 6, 357 (2011), ISSN 1556-276X, URL http://www.nanoscalereslett.com/content/6/1/357.
- Chen et al. (2013) L. Chen, H. Hu, and Z. Xiong, Applied Physics Frontier 1, 22 (2013).
- Lany and Zunger (2008) S. Lany and A. Zunger, Phys. Rev. B 78, 235104 (2008), URL http://link.aps.org/doi/10.1103/PhysRevB.78.235104.
- Lany and Zunger (2009) S. Lany and A. Zunger, Modelling and Simulation in Materials Science and Engineering 17, 084002 (2009), URL http://stacks.iop.org/0965-0393/17/i=8/a=084002.
- Lany and Zunger (2010) S. Lany and A. Zunger, Phys. Rev. B 81, 113201 (2010), URL http://link.aps.org/doi/10.1103/PhysRevB.81.113201.
- Janotti and de Walle (2009) A. Janotti and C. G. V. de Walle, Reports on Progress in Physics 72, 126501 (2009), URL http://stacks.iop.org/0034-4885/72/i=12/a=126501.
- Sarsari et al. (2013) I. A. Sarsari, C. D. Pemmaraju, H. Salamati, and S. Sanvito, Phys. Rev. B 87, 245118 (2013), URL http://link.aps.org/doi/10.1103/PhysRevB.87.245118.
- Jiang et al. (2009) H. Jiang, R. I. Gomez-Abal, P. Rinke, and M. Scheffler, Phys. Rev. Lett. 102, 126403 (2009), URL http://link.aps.org/doi/10.1103/PhysRevLett.102.126403.
- Hohenberg and Kohn (1964) P. Hohenberg and W. Kohn, Phys. Rev. 136, B864 (1964), URL http://link.aps.org/doi/10.1103/PhysRev.136.B864.
- Kohn and Sham (1965) W. Kohn and L. J. Sham, Phys. Rev. 140, A1133 (1965), URL http://link.aps.org/doi/10.1103/PhysRev.140.A1133.
- Hedin (1965) L. Hedin, Phys. Rev. 139, A796 (1965).
- Blöchl (1994) P. E. Blöchl, Phys. Rev. B 50, 17953 (1994), URL http://link.aps.org/doi/10.1103/PhysRevB.50.17953.
- Kresse and Joubert (1999) G. Kresse and D. Joubert, Phys. Rev. B 59, 1758 (1999), URL http://link.aps.org/doi/10.1103/PhysRevB.59.1758.
- Shishkin et al. (2007) M. Shishkin, M. Marsman, and G. Kresse, Phys. Rev. Lett. 99, 246403 (2007), URL http://link.aps.org/doi/10.1103/PhysRevLett.99.246403.
- van de Walle and Neugebauer (2004) C. van de Walle and J. Neugebauer, J. Appl. Phys. (2004).
- Baym and Kadanoff (1961) G. Baym and L. Kadanoff, Phys. Rev. 124, 287 (1961).
- Baym (1962) G. Baym, Phys. Rev. 127, 1391 (1962).
- von Barth and Holm (1996) U. von Barth and B. Holm, Phys. Rev. B 54, 8411 (1996).
- Rinke et al. (2005) P. Rinke, A. Qteish, J. Neugebauer, C. Freysoldt, and M. Scheffler, New Journal of Physics 7, 126 (2005).
- Usuda et al. (2002) M. Usuda, N. Hamada, T. Kotani, and M. van Schilfgaarde, Phys. Rev. B 66, 125101 (2002).
- Berger et al. (2012) J. A. Berger, L. Reining, and F. Sottile, Phys. Rev. B 85, 085126 (2012).
- Hüser et al. (2013) F. Hüser, T. Olsen, and K. S. Thygesen, Phys. Rev. B 87, 235 (2013).
- Malashevich et al. (2014) A. Malashevich, M. Jain, and S. Louie, Phys. Rev. B 89, 075205 (2014).
- Fetter and Walecka (2003) A. L. Fetter and J. D. Walecka, Quantum Theory of Many-Particle Systems (Dover Publications, Mineola, New York, 2003), 2nd ed.
- Holm (1999) B. Holm, Phys. Rev. Lett. 83, 788 (1999).
- et al. (2009) P. R. et al., Phys. Rev. Lett. 102, 026402 (2009).
- Samsonidze et al. (2011) G. Samsonidze, M. Jain, J. Deslippe, M. L. Cohen, and S. G. Louie, Phys. Rev. Lett. 107, 186404 (2011).
- bla (2014) bla, Handbook of chemistry & physics online (2014), URL http://www.hbcpnetbase.com/.
- Oba et al. (2011) F. Oba, M. Choi, A. Togo, and I. Tanaka, Sci. Technol. Adv. Mater. 12, 034302 (2011).
- Perdew et al. (1996) J. P. Perdew, K. Burke, and M. Ernzerhof, Phys. Rev. Lett. 77, 3865 (1996), URL http://link.aps.org/doi/10.1103/PhysRevLett.77.3865.
- Oba et al. (2010) F. Oba, M. Choi, A. Togo, A. Seko, and I. Tanaka, Journal of Physics: Condensed Matter 22, 384211 (2010), URL http://stacks.iop.org/0953-8984/22/i=38/a=384211.
- Janotti and Van de Walle (2007) A. Janotti and C. Van de Walle, Phys. Rev. B 76, 165202 (2007), URL http://link.aps.org/doi/10.1103/PhysRevB.76.165202.
- Ney et al. (2012) V. Ney, S. Ye, T. Kammermeier, K. Ollefs, F. Wilhelm, A. Rogalev, S. Lebègue, A. L. da Rosa, and A. Ney, Phys. Rev. B 85, 235203 (2012), URL http://link.aps.org/doi/10.1103/PhysRevB.85.235203.
- Shih et al. (2010) B.-C. Shih, Y. Xue, P. Zhang, M. L. Cohen, and S. G. Louie, Phys. Rev. Lett. 105, 146401 (2010), URL http://link.aps.org/doi/10.1103/PhysRevLett.105.146401.
- Friedrich et al. (2011) C. Friedrich, M. C. Müller, and S. Blügel, Phys. Rev. B 83, 081101 (2011), URL http://link.aps.org/doi/10.1103/PhysRevB.83.081101.
- Klimeš et al. (2014) J. c. v. Klimeš, M. Kaltak, and G. Kresse, Phys. Rev. B 90, 075125 (2014), URL http://link.aps.org/doi/10.1103/PhysRevB.90.075125.
- Kang et al. (2014) Y. Kang, G. Kang, H.-H. Nahm, S.-H. Cho, Y. S. Park, and S. Han, Phys. Rev. B 89, 165130 (2014), URL http://link.aps.org/doi/10.1103/PhysRevB.89.165130.
- Friedrich (2014) C. Friedrich (2014), private communication.
- Petretto and Bruneval (2014) G. Petretto and F. Bruneval, Phys. Rev. Appl. 1, 024005 (2014).
- Madelung (1996) O. Madelung, ed., Semiconductors – Basic Data (Springer, 1996), 2nd ed.
- Anisimov et al. (1997) V. I. Anisimov, F. Aryasetiawan, , and A. Lichtenstein, J. Phys.: Condens. Matter 9, 767 (1997).
- Fuchs et al. (2007) F. Fuchs, J. Furthmüller, F. Bechstedt, M. Shishkin, and G. Kresse, Phys. Rev. B 76, 115109 (2007), URL http://link.aps.org/doi/10.1103/PhysRevB.76.115109.
- Erhart et al. (2005) P. Erhart, A. Klein, and K. Albe, Phys. Rev. B 72, 085213 (2005), URL http://link.aps.org/doi/10.1103/PhysRevB.72.085213.
- Fryxell et al. (2004) G. E. Fryxell, H. Wu, Y. Lin, W. J. Shaw, J. C. Birnbaum, J. C. Linehan, Z. Nie, K. Kemner, and S. Kelly, J. Mater. Chem. 14, 3356 (2004).