Resolving the Merging Planck Cluster PLCK G147.3-16.6 with GISMO
Abstract
The Planck satellite has recently completed an all-sky galaxy cluster survey exploiting the thermal Sunyaev-Zel’dovich (SZ) effect to locate some of the most massive systems observable. With a median redshift of , the clusters found by Planck at are proving to be exceptionally massive and/or disturbed systems. One notable Planck discovery at , PLCK G147.3-16.6, has an elongated core and hosts a radio halo, indicating it is likely in the process of merging. We present a 16″.5 resolution SZ observation of this high- merger using the Goddard-IRAM Superconducting 2-Millimeter Observer (GISMO), and compare it to X-ray follow-up observations with XMM-Newton. We find the SZ pressure substructure is offset from the core components seen in X-ray. We interpret this as possible line of sight temperature or density substructure due to the on-going merger.
Subject headings:
Cosmology: observations — galaxies: clusters: individual (PLCK G147.3-16.6) — galaxies: clusters: intracluster medium — Galaxies: clusters: general — cosmic background radiation — X-rays: galaxies: clusters1. Introduction
Forming from the largest fluctuations in the primordial matter power spectrum, galaxy clusters are among the most massive gravitationally-bound objects. Therefore, the distribution of clusters as a function of mass and redshift provides sensitive cosmological probes. Surveys spanning the electromagnetic spectrum are planned or underway to catalog clusters across their formation history. Recent efforts exploiting the redshift-independent surface brightness of the Sunyaev-Zel’dovich effect (SZ; Sunyaev & Zel’dovich 1972) in particular have detected 1000 previously-unknown clusters (see Fowler et al., 2010; Carlstrom et al., 2011; Planck Collaboration I, 2011; Planck Collaboration VIII, 2011; Hasselfield et al., 2013; Planck Collaboration XXIX, 2014; Bleem et al., 2015).
The Planck satellite has completed the first all-sky cluster survey since ROSAT (see e.g. Romer et al., 1994; Voges et al., 1999; Böhringer et al., 2000). Planck, however, is not well-suited for the discovery of high- systems, whose arcminute-scale SZ signals are heavily diluted inside Planck’s 7.′3–9.′7 beams at the detecting 2 & 3 mm bands. As such, Planck detects only the most prominent, rare systems at high-. The Planck XMM-Newton cluster validation program (Planck Collaboration IV, 2013) used the 15.5-month nominal survey data to identify likely cluster candidates and understand Planck’s selection function. It suggests that the high- detections are likely dynamically-disturbed massive systems, which are far from being virialized and, on average, less X-ray luminous than X-ray selected clusters of the same mass.
Here we report high-significance 16″.5 resolution SZ observations of a disturbed cluster from the final Planck XMM-Newton cluster validation program, imaging it with nearly better resolution than its original unresolved detection. These new data, from the Goddard-IRAM 2-Millimeter Observer (GISMO; Staguhn et al. 2006) on the 30-meter Institut de Radioastronomie Millimétrique (IRAM) Telescope111This work is based on observations carried out with the 30-meter IRAM Telescope. IRAM is supported by INSU/CNRS (France), MPG (Germany) and IGN (Spain). on Pico Veleta, Spain, reveal complex pressure substructure in this merging system and underscore the power of subarcminute SZ follow-up.
| Observatory | Date | Project Code | Pointing (J2000) | Clean Exposure Time | |
|---|---|---|---|---|---|
| R.A. | Dec. | (ksec) | |||
| GISMO | 7–9 Apr 2014 | 235-13 | 02:56:20.0 | +40:17:21.0 | 16.9 |
| GMRT | 18 Jan 2013 | 23_013 | 02:56:25.2 | +40:17:18.7 | 22 |
| XMM-Newton | 27 Aug 2012 | 0693661601 | 02:56:23.8 | +40:17:28.0 | 41.7/42.1/32.9aaTimes for the MOS1, MOS2, and PN detectors of XMM-Newton EPIC, respectively. |
| XMM-Newton | 22 Aug 2011 | 0679181301 | 02:56:25.3 | +40:17:18.7 | 15.4/15.7/8.6aaTimes for the MOS1, MOS2, and PN detectors of XMM-Newton EPIC, respectively. |
Note. — Aim points and unflagged exposure times for the observations of PLCK G147.3-16.6 included here.
We summarize the known cluster properties in Section 2, discuss the new observations in Section 3, and present the results of our analysis in Section 4. We adopt a CDM cosmology with , , and throughout this paper. At the redshift of PLCK G147.3-16.6 (; Planck Collaboration IV, 2013), 1″ corresponds to 6.9 kpc.
2. PLCK G147.3-16.6
PLCK G147.3-16.6 is a massive cluster at =0.645, discovered at a signal to noise ratio =4.41 in the nominal 15.5-month Planck mission. X-ray follow-up observations in the Planck XMM-Newton validation program (Planck Collaboration IV, 2013) reveal an extended, double core morphology, while optical observations with Gemini show no cD galaxy dominating the cluster field. More recently, 610 MHz observations with the Giant Metrewave Radio Telescope (GMRT) found that PLCK G147.3-16.6 hosts a 0.9 Mpc radio halo (van Weeren et al., 2014), placing it among the highest redshift radio halos known. The (re-)acceleration processes that create radio halos are thought to occur predominantly in mergers during and after the first core passage (Feretti et al., 2012; Brunetti & Jones, 2014), although at least one relaxed, cool-core cluster is known to host a radio halo (Bonafede et al., 2014). The disturbed X-ray morphology and lack of a dominant cD galaxy indicate that PLCK G147.3-16.6 belongs to the traditional category of merging clusters hosting radio halos.
3. Observations
In this section we describe the resolved GISMO SZ observations and new XMM-Newton data presented in this work. Table 1 summarizes the observations presented here, including those from the GMRT reported in van Weeren et al. (2014) and the previous XMM-Newton observations in Planck Collaboration IV (2013).
3.1. GISMO
We observed PLCK G147.3-16.6 for a total of 4.7 hours (16.9 ksec) in April 2014 using GISMO, an 816 element array of transition edge sensors. From the 30-meter IRAM Telescope, GISMO provides a instantaneous field of view with 16″.5 resolution at 150 GHz (2 mm). The GISMO data were reduced with CRUSH222 http://www.submm.caltech.edu/~sharc/crush (ver. 2.22-1; Kovács, 2008), which was optimized to recover extended, diffuse signals from the atmosphere-dominated bolometer data.
We estimate a total calibration uncertainty 7–9% due to the imperfect knowledge of the line of sight opacities, based on repeated observations of Mars and Uranus (see Staguhn et al., 2014, for a detailed description of the absolute calibration).
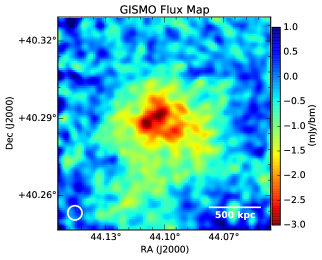
We deconvolved the resulting image with the measured point-source response of the reduction process; i.e., we divide the Fourier transform of the map by the 2-D transfer function, and back-transform. The resulting deconvolved image is shown in Figure 1 (left).
The cluster field was observed using a combination of 3–5′ alt-azimuthal Lissajous patterns, yielding a median noise 0.3 mJy/bm within the central 4′ diameter, and coverage extending to approximately area overall.
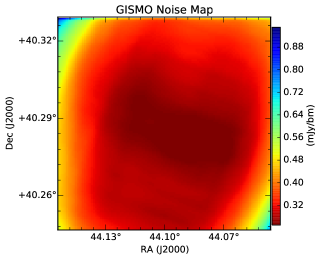
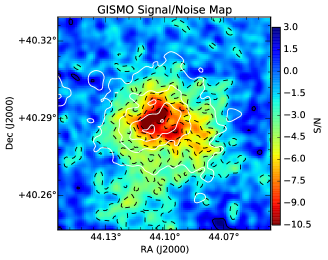
The noise in each map pixel was propagated from noise measured in the residual detector timestreams. Non-white (covariant) features, such as residual , is spatially invariant, and hence fully captured by an appropriate noise re-scaling, which we determined by the ratio of measured-to-expected deviation, , outside of the approximate cluster center (at 1.′5). The resulting noise map, shown in Figure 1 (middle), provides a fair measure of the true map noise for GISMO, with no apparent transient noise. We find the peak SZ decrement at 10- significance, and the overall detection is significant at 3- in every beam within the central of the map.
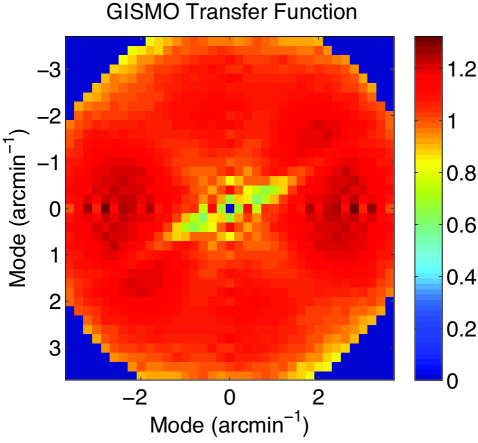
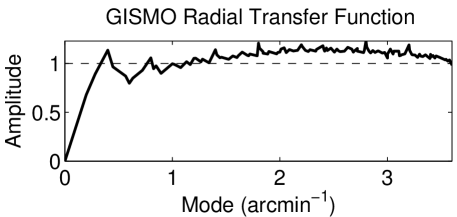
The two-dimensional transfer function of our GISMO data, shown in Figure 2, was obtained by inserting a faint point-like test source into jackknife realizations, which are reduced the same way as the cluster. Thus, we ensure that the test dataset has the same noise properties as the actual dataset, and therefore the test source undergoes the same filtering steps as our cluster, even with adaptive pipeline steps such as noise whitening. We averaged the response over 100 jackknife realizations to suppress the low-level sky-noise present in the individual realizations. The transfer function, obtained as the ratio of the observed 2D spatial spectrum of the response to the underlying spectrum of the test source, characterizes the pipeline’s response to arbirtrary structures.
Our transfer function is not circularly symmetric due to common mode subtraction along various correlated detector groups. Because CRUSH normalizes maps to preserve point-source peak fluxes (i.e. to keep the point source weighted mean response unity by definition), the response in the raw GISMO map diminishes gradually from above unity at the short spatial scales (20″; 3 arcmin-1), to 1 at scales 2′, which is comparable to the instantaneous field of view. The azimuthally-averaged transfer function is also shown in Figure 2 (lower panel).
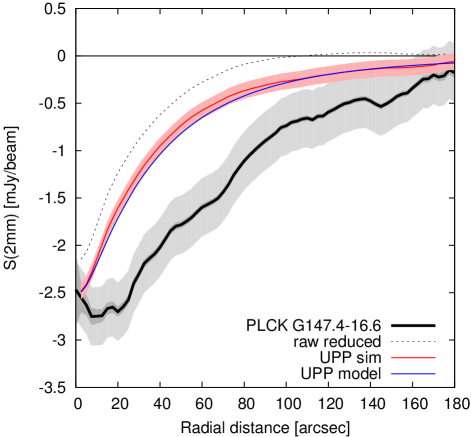
The raw map deconvolved by the transfer function provides an accurate representation of the underlying 2-mm flux distribution of PLCK G147.3-16.6 up to the 5′ scales shown. The reduction and deconvolution algorithm was tested on both a simulated point source and a simulated cluster model, and it accurately reproduced the expected fluxes and profiles for both (see Fig. 4). The zero level of the deconvolved map is estimated using the mean flux level outside the cluster decrement (at radii ; see Section 4).
3.2. XMM-Newton
The discovery of PLCK G147.3-16.6 was confirmed through a 16.9 ksec X-ray observation with the XMM-Newton European Photon Imaging Camera (EPIC) in August 2011, as part of the Planck XMM-Newton validation program (Planck Collaboration IV, 2013). An additional 43.9 ksec XMM-Newton observation was obtained in August 2012. We calibrated both datasets using the Science Analysis System (SAS, ver. 13.5.0) and the most recent calibration files as of July 2014. The calibrated, cleaned event files discard periods of high intensity due to background particle flares. Effective exposure times and other observation details are summarized in Table 1.
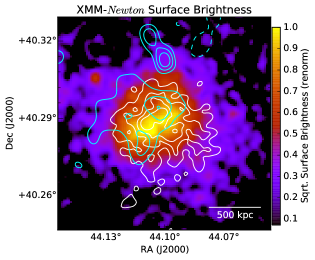
The images and spectra were cleaned of point sources. CCD4 of the MOS1 detector was operating in an anomalous state during observation 0679181301, and therefore excluded from further analysis. The merged, exposure-corrected X-ray surface brightness () image in Figure 3 (left) shows that the cluster has a disturbed morphology, with an elongated core angled 30∘ counterclockwise from E-W.
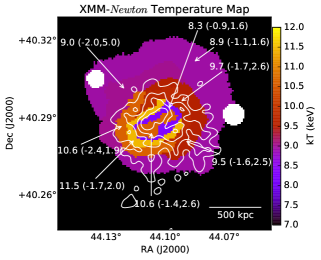
We extracted spectra for the temperature analysis using the SAS tools mos-spectra and pn-spectra. Extracted MOS1+MOS2 spectra were co-added, and the MOS and PN spectra were jointly fit using xspec using cstat statistics. Each region contained 2000 background-subtracted (i.e. source) counts. With the column density of hydrogen held fixed at the Galactic value, we fit the APEC plasma model to find the temperature of each region, marginalizing over abundance. Further details of the data reduction and analysis such as the treatments of the local, cosmic, and particle backgrounds are discussed in Bulbul et al. (2012).
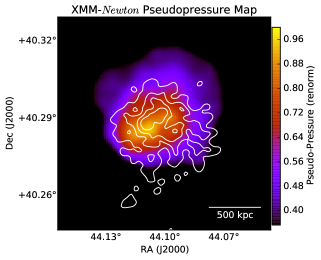
We used the XMM-Newton spectroscopic data to produce a temperature () map of the cluster using the contour binning algorithm of Sanders (2006), contbin, which selects regions of similar above a user-specified threshold. We used yielding 2000 source counts per region. The resulting temperature map is shown in Figure 3 (middle panel), with GISMO contours overlaid for comparison. A pseudo-pressure map () is shown in Figure 3 (right).
4. Results
In this section we compare the surface brightness of the GISMO SZ map with the model fit to the Planck data and to the properties inferred from the XMM-Newton observations. The thermal SZ effect traces the line-of-sight integral of thermal electron pressure . Its surface brightness is proportional to the Compton parameter,
| (1) |
where is the Thomson cross-section, is the Boltzmann constant, is the electron rest energy, is the electron number density, is the electron temperature, is the line of sight path through the cluster, and .
Planck Collaboration IV (2013) report a spherically-integrated Compton , where
| (2) |
Here is the angular diameter distance to the cluster, and , which for this cluster (2.′5 on the sky), is the radius within which the average density is 500 greater than the critical density of the Universe at that redshift. Planck Collaboration IV (2013) assume the spherically symmetric ‘universal pressure profile’ (UPP) of Arnaud et al. (2010) for their model fit, shown in blue on Figure 4. For simplicity, we plotted only the median UPP fit to the Planck data, noting the error bars on the SZ surface brightness profile are at , and at the peak.
The source of the discrepancy between the measured and modelled profiles is unknown, but may be an indication that the UPP is a poor fit to this disturbed cluster. We note that the UPP as fit by the Planck is treated as a matched filter function of a single parameter, namely the mass within as computed using the scalings reported in Arnaud et al. (2010). Furthermore, the Planck measurement of this cluster is entirely unresolved within , so the profile shown is an interpolation of the UPP that results in the integrated signal measurement by Planck on scales .
The GISMO map shows broad qualitative agreement with the X-ray imaging (Figure 3, left). In the core however, we find the SZ and X-ray peaks are offset. An attempt to realign the peaks would bring the agreement on arcminute scales into tension.
The observed peak offsets between the GISMO and XMM-Newton maps is not expected to be due to pointing errors. XMM-Newton imaging is precise to the subarcsecond level, and the positions of bright X-ray point sources agree with the locations of bright WISE counterparts. The GISMO pointing model is checked against 466 measurements of bright point sources, observed hourly through several days. All are within an RMS deviation . The GISMO observations combine 32 observation blocks, each bracketed by independent pointings, thus the statistical 1- pointing error of the composite map is estimated at 0″.8. We also note that the positions of dozens of bright compact sources observed by GISMO observations during the same observation period are reproduced within the expected accuracy. We therefore consider the discrepancy to be of astrophysical nature.
We do not expect to detect any contamination by the Cosmic Infrared Background (CIB). The unresolved part of the CIB is removed by flux zeroing outside of the cluster, so our fluxes are effectively referenced against the mean CIB level. Resolved CIB sources may be present in the map, but are unlikely to be detectable. A deep-field study with GISMO by Staguhn et al. (2014) finds no sources brighter than 1 mJy (3- in our map) in a similar area to our field, and put the 2 mm confusion noise at 50Jy, i.e. several times below the RMS in the observations presented here. The combined CMB+CIB at scales from 1–4′ has also been measured at 150 GHz by the SPT to be 100 K (George et al., 2015), corresponding to a signal Jy/bm in the GISMO data, comparable to the noise level in our map. We also note that recent studies by Sayers et al. (2013) and Gralla et al. (2014) both found the radio and submillimeter point source contribution to be minimal near 150 GHz. Therefore, CIB/CMB contamination in our map is expected to be small.
SZ and X-ray imaging are sensitive to the line of sight integrals of pressure (Eq. 1) and density squared, respectively; for bremsstrahlung emission, X-ray surface brightness has only a weak dependence on temperature, . Differences between the SZ and X-ray maps ( and ) can therefore be due to temperature substructure or to the differing line of sight distribution of the gas (e.g. clumping or asphericity).
The location of the SZ signal at 6- broadly agrees with the location of the hottest gas found in the temperature and pseudo-pressure maps (Figure 3, middle and right, respectively), but we find no clear evidence for shock-heated gas at the resolution of the X-ray spectroscopy. For the high-significance (6-) SZ region, we extracted spectra from both XMM-Newton observations, and X-ray counts within , using the same fitting procedure and plasma model as for deriving the temperature. We find only a marginal enhancement of keV over the global temperature keV, which agrees with that found by Planck Collaboration IV (2013).
This leaves the possibility that the SZ/X-ray offset is due to an irregular gas distribution along the line of sight or the breakdown of the assumption that pseudo-pressure and SZ features should directly match. The so-called ‘slab approximation’, which treats the line of sight temperature as isothermal in each spectroscopic bin and assumes the path length through the cluster is a constant (e.g Mroczkowski et al., 2012; Planck Collaboration X, 2013), may not hold for complicated merger geometries.
5. Conclusions
We present the first high significance maps of the SZ effect with GISMO, revealing substructure in the Planck-selected cluster PLCK G147.3-16.6. The core morphology mimics the appearance of the X-ray observation (reported here and in Planck Collaboration IV, 2013), but is notably offset from their X-ray counterparts. The presence of the giant radio halo reported in van Weeren et al. 2014 further supports the hypothesis that this system is likely a merger.
This GISMO observation demonstrates that a comparable level of detail in a moderately high- cluster can now be obtained from large, ground-based telescopes in a similar amount of time as that currently required for X-ray observations. This adds to a small but growing number of instruments that have imaged the SZ effect at resolutions better than 20″, which include such instruments as Nobeyama (e.g. Komatsu et al., 2001; Kitayama et al., 2004), MUSTANG (e.g. Mason et al., 2010), CARMA (e.g. Plagge et al., 2010), and NIKA (e.g. Adam et al., 2014, 2015). New and future observations with GISMO and GISMO-2 (Staguhn et al., 2012) will probe high- cluster mergers further, or confirm cluster candidates from SZ, X-ray, and optical surveys.
References
- Adam et al. (2015) R. Adam, B. Comis, J.-F. Macías-Pérez, A. Adane, P. Ade, et al. 2015, A&A, 576, A12
- Adam et al. (2014) R. Adam, B. Comis, J. F. Macías-Pérez, A. Adane, P. Ade, et al. 2014, A&A, 569, A66
- Arnaud et al. (2010) M. Arnaud, G. W. Pratt, R. Piffaretti, H. Böhringer, J. H. Croston, et al. 2010, A&A, 517, A92, (A10)
- Bleem et al. (2015) L. E. Bleem, B. Stalder, T. de Haan, K. A. Aird, S. W. Allen, et al. 2015, ApJS, 216, 27
- Böhringer et al. (2000) H. Böhringer, W. Voges, J. P. Huchra, B. McLean, R. Giacconi, et al. 2000, ApJS, 129, 435
- Bonafede et al. (2014) A. Bonafede, H. T. Intema, M. Brüggen, H. R. Russell, G. Ogrean, et al. 2014, MNRAS, 444, L44
- Brunetti & Jones (2014) G. Brunetti and T. W. Jones. 2014, International Journal of Modern Physics D, 23, 30007
- Bulbul et al. (2012) E. Bulbul, R. K. Smith, and M. Loewenstein. 2012, ApJ, 753, 54
- Carlstrom et al. (2011) J. E. Carlstrom, P. A. R. Ade, K. A. Aird, B. A. Benson, L. E. Bleem, et al. 2011, PASP, 123, 903
- Feretti et al. (2012) L. Feretti, G. Giovannini, F. Govoni, and M. Murgia. 2012, A&A Rev., 20, 54
- Fowler et al. (2010) J. W. Fowler, V. Acquaviva, P. A. R. Ade, P. Aguirre, M. Amiri, et al. 2010, ApJ, 722, 1148
- George et al. (2015) E. M. George, C. L. Reichardt, K. A. Aird, B. A. Benson, L. E. Bleem, et al. 2015, ApJ, 799, 177
- Gralla et al. (2014) M. B. Gralla, D. Crichton, T. A. Marriage, W. Mo, P. Aguirre, et al. 2014, MNRAS, 445, 460
- Hasselfield et al. (2013) M. Hasselfield, M. Hilton, T. A. Marriage, G. E. Addison, L. F. Barrientos, et al. 2013, J. Cosmology Astropart. Phys, 7, 8
- Itoh et al. (1998) N. Itoh, Y. Kohyama, and S. Nozawa. 1998, ApJ, 502, 7
- Kitayama et al. (2004) T. Kitayama, E. Komatsu, N. Ota, T. Kuwabara, Y. Suto, et al. 2004, PASJ, 56, 17
- Komatsu et al. (2001) E. Komatsu, H. Matsuo, T. Kitayama, R. Kawabe, N. Kuno, et al. 2001, PASJ, 53, 57
- Kovács (2008) A. Kovács. 2008, in Society of Photo-Optical Instrumentation Engineers (SPIE) Conference Series, Vol. 7020, Society of Photo-Optical Instrumentation Engineers (SPIE) Conference Series, 1
- Mason et al. (2010) B. S. Mason, S. R. Dicker, P. M. Korngut, M. J. Devlin, W. D. Cotton, et al. 2010, ApJ, 716, 739
- Mroczkowski et al. (2012) T. Mroczkowski, S. Dicker, J. Sayers, E. D. Reese, B. Mason, et al. 2012, ApJ, 761, 47
- Plagge et al. (2010) T. Plagge, B. A. Benson, P. A. R. Ade, K. A. Aird, L. E. Bleem, et al. 2010, ApJ, 716, 1118
- Planck Collaboration I (2011) Planck Collaboration I. 2011, A&A, 536, A1
- Planck Collaboration X (2013) Planck Collaboration X. 2013, A&A, 554, A140
- Planck Collaboration IV (2013) Planck Collaboration IV. 2013, A&A, 550, A130
- Planck Collaboration VIII (2011) Planck Collaboration VIII. 2011, A&A, 536, A8
- Planck Collaboration XXIX (2014) Planck Collaboration XXIX. 2014, A&A, 571, A29
- Romer et al. (1994) A. K. Romer, C. A. Collins, H. Böhringer, R. G. Cruddace, H. Ebeling, et al. 1994, Nature, 372, 75
- Sanders (2006) J. S. Sanders. 2006, MNRAS, 371, 829
- Sayers et al. (2013) J. Sayers, T. Mroczkowski, N. G. Czakon, S. R. Golwala, A. Mantz, et al. 2013, ApJ, 764, 152
- Staguhn et al. (2006) J. G. Staguhn, D. J. Benford, C. A. Allen, S. H. Moseley, E. H. Sharp, et al. 2006, in Society of Photo-Optical Instrumentation Engineers (SPIE) Conference Series, Vol. 6275, Society of Photo-Optical Instrumentation Engineers (SPIE) Conference Series, 1
- Staguhn et al. (2012) J. G. Staguhn, D. J. Benford, D. J. Fixsen, G. Hilton, K. D. Irwin, et al. 2012, in Society of Photo-Optical Instrumentation Engineers (SPIE) Conference Series, Vol. 8452, Society of Photo-Optical Instrumentation Engineers (SPIE) Conference Series, 0
- Staguhn et al. (2014) J. G. Staguhn, A. Kovács, R. G. Arendt, D. J. Benford, R. Decarli, et al. 2014, ApJ, 790, 77
- Sunyaev & Zel’dovich (1972) R. A. Sunyaev and Y. B. Zel’dovich. 1972, Comments Astrophys. Space Phys., 4, 173
- van Weeren et al. (2014) R. J. van Weeren, H. T. Intema, D. V. Lal, A. Bonafede, C. Jones, et al. 2014, ApJ, 781, L32
- Voges et al. (1999) W. Voges, B. Aschenbach, T. Boller, H. Bräuninger, U. Briel, et al. 1999, A&A, 349, 389