Universality and criticality of a second-order granular solid-liquid-like phase transition
Abstract
We experimentally study the critical properties of the non-equilibrium solid-liquid-like transition that takes place in vibrated granular matter. The critical dynamics is characterized by the coupling of the density field with the bond-orientational order parameter , which measures the degree of local crystallization. Two setups are compared, which present the transition at different critical accelerations as a a result of modifying the energy dissipation parameters. In both setups five independent critical exponents are measured, associated to different properties of : the correlation length, relaxation time, vanishing wavenumber limit (static susceptibility), the hydrodynamic regime of the pair correlation function, and the amplitude of the order parameter. The respective critical exponents agree in both setups and are given by , , , , and , whereas the dynamical critical exponent is . The agreement on five exponents is an exigent test for the universality of the transition. Thus, while dissipation is strictly necessary to form the crystal, the path the system undergoes towards the phase separation is part of a well defined universality class. In fact, the local order shows critical properties while density does not. Being the later conserved, the appropriate model that couples both is model C in the Hohenberg and Halperin classification. The measured exponents are in accord with the non-equilibrium extension to model C if we assume that , the exponent associated in equilibrium to the specific heat divergence but with no counterpart in this non-equilibrium experiment, vanishes.
pacs:
64.60.Ht, 64.70.qj 05.40.-a, 45.70.-n,I Introduction
Thermodynamics and equilibrium statistical mechanics have shown an extraordinary success in describing phase transitions. It has been possible to classify them, predict their properties, and understand the critical phenomena. Also, they provide a framework that can be used to build efficient numerical tools as the Monte Carlo simulations or to design and analyze experiments, for example exploiting the concept of universality classes. From a theoretical viewpoint the critical phase transitions were classified in universality classes in terms of symmetry and conservation properties BookCritical ; hohenberg .
In several order-disorder phase transitions the dynamics of the transition needs the interplay of two or more order parameters Hoh ; TanakaNature ; vanThiel ; Gorentsveig ; Glosli ; Shimizu ; Kockelkoren . One particularly interesting case is the so called model C in the Hohenberg and Halperin classification, where a non-conserved critical order parameter couples to the conserved noncritical density hohenberg ; Kockelkoren ; Ccorrect . Examples where this model can be applied are varied, comprising liquid-liquid phase transitions vanThiel ; Tanakaliquid ; Glosli ; Shimizu , binary alloys Gorentsveig , and anisotropic magnets Dudka .
In out of equilibrium conditions there is no such systematic framework that can be used to analyze or classify phase transitions. There are, nevertheless, some notorious examples of prototype models that have been shown to be quite general, allowing other systems to be compared with them. Some of these are, for example, the directed percolation process, the Kardar-Parisi-Zhang model for surface growth and the Swift-Hohenberg model MarroNonEq ; HenkelNonEq ; KPZ ; Takeuchi2014 ; CrossHohenbergRMP . The critical phenomena methodology in equilibrium has been extended to these cases, where again we find critical exponents, universality classes, and scaling functions, with the dynamic renormalization group as a useful approach. But, still much understanding is needed to reach a state of knowledge comparable to the equilibrium case.
Granular matter, due to the strong dissipation present at the particle interactions and the corresponding need for continuous energy injection to sustain dynamic states, is an excellent candidate for studying out of equilibrium phase transitions. Important progress has been made along this direction Melby2005 ; prevost2004 ; Reis2006 ; cartes ; clerc2008 ; Reis2002 ; YFan ; CMay ; Pacheco ; tanaka2008 , but a wider view in the context of dynamical phase transitions is still lacking. Recently, we presented an experimental study of a granular liquid-solid-like phase transition in a vibrated quasi-two-dimensional granular system castillo_PRL . There, we showed that the transition is characterized not only by the density field but also by a bond-orientational order parameter, which is described by the model C. To our understanding, this is the first non-equilibrium realization of this class of phase transition.
In this manuscript we extend the results found previously by focusing now on the universality of the transition. That is, we aim to verify if by varying some experimental parameters, the same critical exponents are found. We remark that in Ref. castillo_PRL five independent critical exponents were found which, therefore, put an exigent test the universality condition.
The article is organized as follows. Section II describes the liquid-solid-like transition that takes place in confined quasi two dimensional granular systems. In Sec. III the experimental setup and procedures are explained, describing the two configurations that are used to test the universality of the critical exponents. The experimental results and the determination of the critical accelerations and exponents are presented in Sec. IV. Finally, conclusions are given in Sec. V.
II The liquid-solid-like transition in quasi two dimensional granular systems
Granular matter is ubiquitous in our daily life, still a fully understanding of its dynamical behavior has remained rather elusive for several years Aranson ; Jaeger . Dry granular matter is a collection of athermal macroscopic particles that interact mainly through hard core-like dissipative collisions, and depending on external conditions such as pressure or packing fraction it may behave as a solid, a liquid or even a gas.
Energy injection is needed to compensate the energy dissipated in grain-grain and grain-wall collisions. Vibrations are an efficient method to perform this task in a distributed and controlled way, being possible to reach stable states. Among the different possibilities to perform the vibrations, the quasi-two dimensional (Q2D) geometry has gained attention because it allows the granular system to be followed in detail at the individual grain scale together with the collective dynamics. In Q2D systems, grains are placed in shallow box, with a height that is between one and two particle diameters, while it is large in the horizontal directions. The box is vertically vibrated with maximal accelerations larger than gravity such that grains acquire vertical energy that is transferred via collisions to the horizontal degrees of freedom. In the reduced two-dimensional dynamics, the system resembles a liquid but with the important difference that the collisions are not conservative.
For fixed density and vibration frequency, by increasing the maximum acceleration the system presents a phase transition where grains cluster in solid-like regions with crystalline order prevost2004 ; Melby2005 . The instability is originated in the development of an effective negative compressibility Argentina2002 ; clerc2008 and the transient dynamics is governed by waves clerc2008 . Once the system is segregated the solid-like cluster show fluctuations in the interface that are well described by the capillary theory, allowing us to extract an effective surface tension that has non-equilibrium origin Luu_PRE .
In our previous work we studied experimentally the solid-liquid-like phase transition in the vibrated Q2D geometry. Depending on the filling fraction and height of the cell, the transition was either discontinuous or continuous. In the later case critical phenomena develop, with static and dynamical properties that show power law behavior in terms of the distance to the critical acceleration castillo_PRL .
III Experimental setup and procedures
In this paper we extend the analysis of the previously published study castillo_PRL . Two sets of experiments are used to test the universality hypothesis. They differ in the dissipation coefficients, which will be labeled experiments A and B, with larger and lower dissipation respectively.
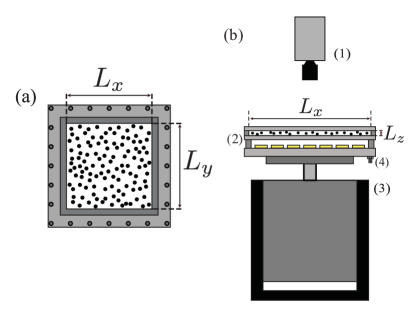
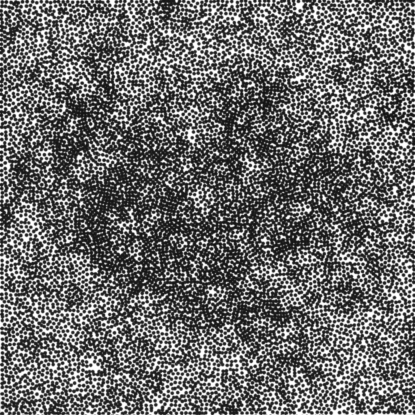
The granular system is composed of stainless steel spherical particles of mass , and mm diameter. The Q2D box has lateral dimensions . The box consists of two mm thick glass plates separated by a square metallic frame. Each inner glass surface has an indium tin oxide (ITO) coating, which dissipates electrostatic charges generated by collisions of particles with the walls. The box is fixed to a base by four posts placed at each corner of the cell. The base supports an array of high intensity light emitting diodes. A piezoelectric accelerometer is fixed to the base, allowing the measurement of the imposed forcing acceleration with a resolution of g. The main advantage of this setup is that particles are illuminated from below. They are then visualized as dark disks on a white background. This allows to detect particles in dense clusters, even when particles are partially mounted on top of each other. A scheme of the setup is shown in Fig. 1. A typical image of the system is shown in Fig. 2.
The whole setup is forced sinusoidally with an electromechanical shaker, with vertical displacement . Top view images are obtained with a camera at fps. The images acquired have a typical resolution of , thus we obtain particles of 10 pix diameter approximately. Particle positions are determined at sub-pixel accuracy. Results have been obtained by fixing the particle number , cell height and driving frequency Hz. The dimensionless acceleration is varied in the range . In this present work we focus on the configuration C2 of reference castillo_PRL , namely and , which implies the filling fraction to be . This filling fraction value is possible because the system is Q2D, which allows to accommodate more particles than for a pure 2D system.
As was demonstrated in castillo_PRL , under this particular configuration the system undergoes a second-order type phase transition. The aim of this paper is to present a more detailed study of the transition itself. Additionally, we are particularly interested if there is universality in this granular out-of-equilibrium phase transition. In order to study the universal behavior of the critical exponents, we change the dissipation parameters of the system by changing both the bottom and top lids. We use two pairs of ITO (indium tin oxide) coated glass plates. In the experiments of type A the coating is 25 nm thick, whereas for type B experiments it is 750 nm thick. It has been shown that ITO films mechanical, fracture, morphological and electric properties depend on fabrication details such as thickness, annealing, substrate, feed gas, among others Leterrier_2004 . So, it is expected that the dissipation parameters, namely inelastic and friction coefficients, should be different for the two sets of ITO coated glass plates. As will be shown below, our results indeed demonstrate that the dissipation is stronger for the thinner ITO coated glass plates (type A experiments).
The ITO coating works very well for many hours of experimental runs. Eventually, it does however get damaged by particle collisions. The precise time of reproducible runs is probably function of the ITO coating thickness. This is supported by the thickness dependence of the crack onset strain in ITO thin films, which is lower for thicker coatings Leterrier_2004 . All data presented in this paper correspond to reproducible runs for which no important damage was noticeable. In fact, a surface damaged ITO coating is manifested in important changes of the measured quantities – such as the density and order structure factors – with respect to those obtained for a new pair of ITO coated glass plates. We conjecture that the damage occurs because of erosion of the ITO coating, which in turn affects particle interactions by an increase of electrostatic forces and contamination of the system by dust formed from the ITO coating. In order to insure reproducibility, glass plates were changed periodically during the time duration of all the experimental runs, and all parts of the experiments are cleaned in an ultrasonic bath before mounting the experimental cell again, including the particles.
Two important issues are the top and bottom plates flatness and homogeneity of through the experimental cell. With the cell empty of particles the height is measured at nine different positions on a regular spaced grid with an optical microscope (see supplementary material of castillo_PRL ). Within experimental errors the vertical height is homogeneous, . However, the homogeneity of does not insure that the glass plates are both flat. Because of the mechanical constrains and stresses exerted on the plates, some small residual curvature could exist.
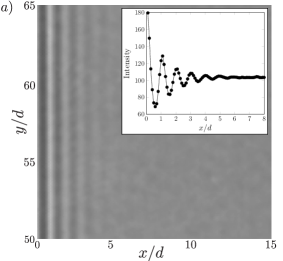
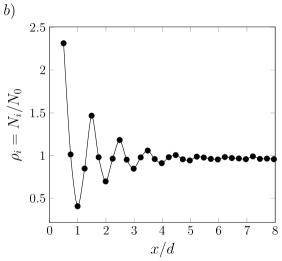
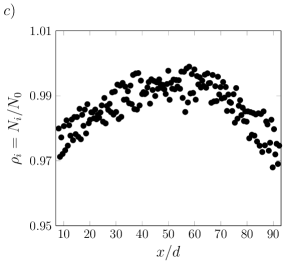
In Fig. 3(a) we show an average of 3270 images for , well below the solid-liquid transition (for type B experiments, ). Only a small part of the setup is shown, of size . Viewed from above it corresponds to the left side wall at almost half of the cell. It is clear that near the side wall particles tend to form layers of thickness , within which particles barely move compared with the rest of the system. This layering, observed at all side walls, is induced by the extra dissipation given by the side wall collisions, similar to what has been shown in sheared granular matter YFan . However, for a distance from a side wall, the system is nearly homogeneous. The inset of Fig. 3(a) shows an average intensity plot as a function of the position (time and averaged), showing the layers close to the edge and then saturating at a constant value. Also, by means of a time average coarse-graining procedure we can compute the density of particles as a function of distance from a wall. This is shown in Figs. 3(b) and 3(c). Close to the wall we notice the same particle layering and an apparent homogenization for (Fig. 3(b)). The asymptotic limit is slightly less than expected to compensate for the particle excess at the side walls. At a larger scale, as shown in Fig. 3(c), we observe that there is a small density gradient that leads to an excess of particles at the cell’s center compared to the edges: density is about higher at the center that near the side walls. This can be the result of three effects, which are probably all present. Firstly, even though the cell’s height is homogeneous within experimental errors, there might be a small residual concavity, which makes the particles to accumulate near the center. A second factor could be that the vertical acceleration may not be constant throughout the cell. In other words, there could be some “flapping” of the system. Indeed, we have measured the acceleration of the cell at different positions and we find that it is about higher near the borders that at the center. Finally, the presence of dissipative side walls could induce such large scale inhomogeneity.
Another important issue is the mechanical leveling of the whole setup (for details, see supplementary material of Ref. castillo_PRL ). The cell’s horizontality, and thus the system’s isotropy, can be checked by two ways: First, it is verified through the static structure factor (defined below) and the average density Fourier components (for now we can say that is a measure of density fluctuations in Fourier space). When these quantities are plotted versus and there is no preferential direction. For example, shows the characteristic symmetric circular annular shape at , where . A second verification is given by the even symmetry of the coarse-grained density with respect to the cell center line, as can be observed from the data presented in Fig. 3(c), which is indeed symmetric with respect to .
The particle detection is done by using a modified open source Matlab code which uses a least-square algorithm Shattuck . Our modified version in C++ & CUDA allows faster computation for large number of particles memoriaJuan ; juansilva . The algorithm allows to detect both layers of particles in a dense solid cluster, where the top layer particles are placed in the valleys that the bottom particles form. Typical experimental runs consist of at least 30 video acquisitions, one for each , of about 3300 images each. Therefore, the complete number of images to analyze for a single experimental run is about .
Finally, for fixed geometry, particle density and vibration frequency we perform vibration amplitude ramps, from in the liquid phase, increasing going through the solid-liquid transition that is reached at . In order to check that the transition is continuous, for some runs we also perform decreasing amplitude ramps starting above .
IV Experimental results
IV.1 Static structure function.
Particle positions in the plane are determined for each time . Experimentally, there is no access to the coordinate. Thus, the 2D microscopic density field Fourier components are
| (1) |
The static structure factor measures the intensity of density fluctuations in Fourier space:
| (2) | |||||
| (3) |
where denotes time averaging. In general , due to inhomogeneities induced by boundary conditions, as those shown in Fig. 3. The wave vectors are computed from , where , and .
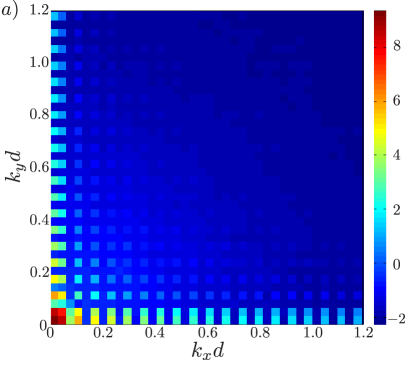
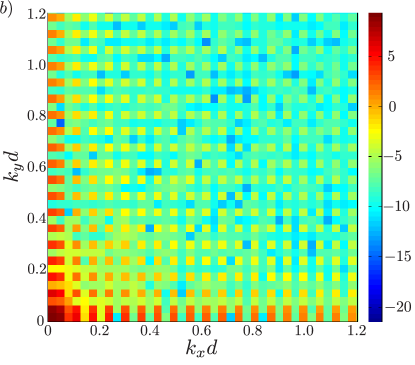
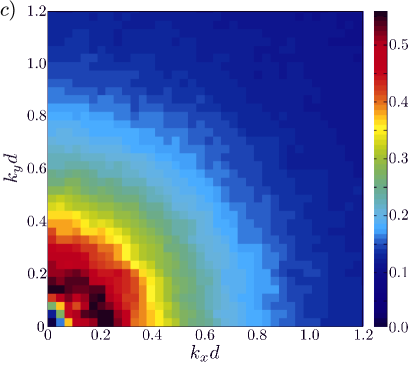
In Figs. 4(a) and 4(b) we present color plots of the two terms that are used for the computation of , namely and as functions of and (both in scale). It turns out that both quantities are strongly non-monotonic and are different by several orders of magnitude. In the lower wavenumber range that is plotted these quantities show a set of peaks placed on a regular grid on top of a smooth background, taking large values when both and are odd, whereas the other modes are much lower. This is understood by the even symmetry that the density field has with respect to the cell’s center, as shown in Fig. 3(c). Thus, its Fourier decomposition yields that the not pure odd harmonics should vanish, having very low values in practice. In Fig. 4(c), the subtraction of these two terms is shown, which defines . The smoothness of the resulting function, with no discrimination between even or odd modes, indicates that the density fluctuations are governed by long wavelength dynamics and not by the static density profile.
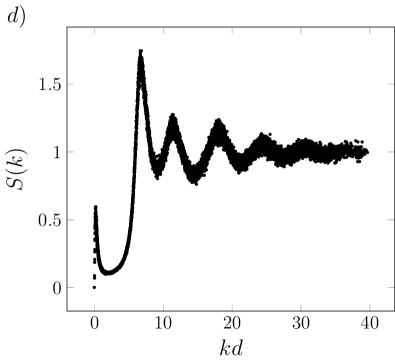
The structure factor presents a notorious pre-peak centered at , which corresponds to a large wavelength structure of size (the pre-peak term refers to the peak being at lower wavenumber than the one corresponding to the first coordination shell at , see below). The associated density fluctuations are indeed visible by simple visual inspection (see Fig. 2). Fig. 4(d) shows for a wider range of , up to . It has the usual form expected for liquids with short range order, presenting a maximum at related to the first coordination shell as well as the pre-peak discussed before. This pre-peak can be located in the range depending on the exact value of . Similar density fluctuations have been observed in amorphous materials Elliott1991 ; Tanaka2005b , which have been consistently related to the existence of medium-range-crystalline-order. These density fluctuations have also been related to the presence of a pre-peak in the structure factor. In fact, in the amorphous literature the pre-peak is known as the First Sharp Diffraction Peak (FSDP) because it appears at low and is obtained from X-ray diffraction measurements.
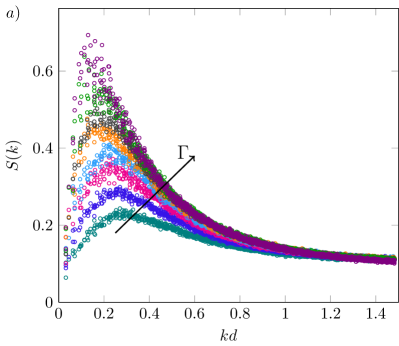
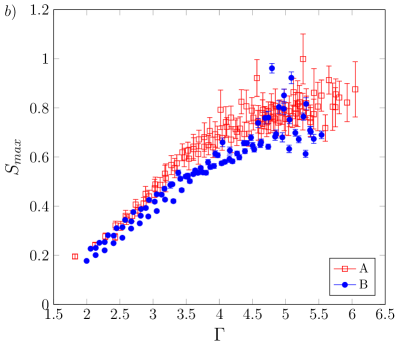
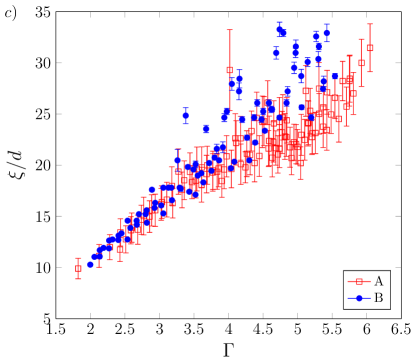
Fig. 5(a) presents for small wavenumbers at different accelerations below . From this figure it is clear how the pre-peak evolves as the system is driven towards the transition by increasing its acceleration towards : its height increases and its position shifts to lower . This implies that density fluctuations become larger in size and stronger as increases. We characterize the pre-peak by its maximum value , and the associated characteristic length scale , where is the position of the pre-peak. These quantities are plotted in Figs. 5(b) and 5(c) as functions of for increasing amplitude ramps and for both experiment types A and B. Although the data points are scattered and that they do not really overlap, specially at higher , both quantities show similar trends for each experimental type. Both and increase as the transition is approached, although the former seems to saturate at larger . We observe no great differences between the two ITO coatings, being their final values (near the transition) very similar, and . We also present in Fig. 5(d) the width of the pre-peak, , defined as its width at half . This quantity is a measure of the dispersion around the characteristic length . The collapse and scatter of the data are improved with respect to the other quantities, with no dependence on the different dissipation parameters.
By observing visually the persistence of the solid clusters we conclude that for the A type experiment, the transition is located at , whereas for type B it is found to be . Given that we are dealing with a continuous phase transition these are just approximated values. However, neither nor show evident changes at these values.
As a conclusion to this first part we can say that density fluctuations do not show critical behavior, but they are needed to create regions of high order. This is also evident from visual inspection; higher density patches are indeed more ordered, as can be verified in Fig. 2. Density is a conserved field. Its fluctuations are however limited by the system’s vertical geometrical constrain and the fact that the particles are in practice hard spheres. In what follows, medium range order will be analyzed with an appropriate bond-orientational order parameter, which does indeed present critical behavior.
IV.2 Bond-orientational order parameter.
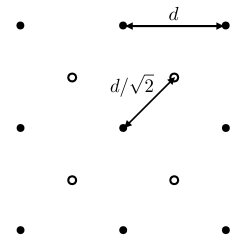
In the vicinity of the transition, fluctuations of high density present the same square symmetry as the solid phase. In the quasi-2D geometry the solid phase consists of two square interlaced layers instead of the hexagonal layer that is characteristic of 2D systems Melby2005 . The local order can be characterized through a 4-fold bond-orientational order parameter. This is still valid in quasi-2D geometry because the interlaced two-layer square lattices (with unit cell length in each plane) result also in a square lattice when projected in 2D, with unit cell length when the grains are close packed, as shown in Fig. 6. The 4-fold bond-orientational order parameter per particle is defined
| (4) |
where is the number of nearest neighbors of particle and is the angle between the neighbor of particle and the axis. For a particle in a square lattice, and the complex phase measures the square lattice orientation respect to the axis. For details on the computation of we refer the reader to the supplementary information of Ref. castillo_PRL .
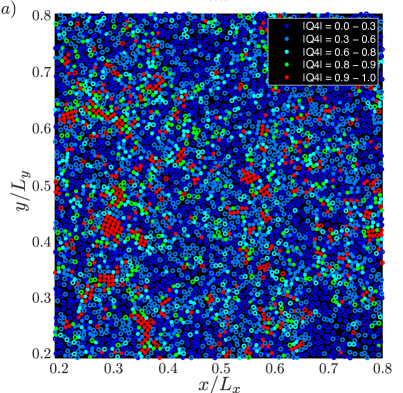
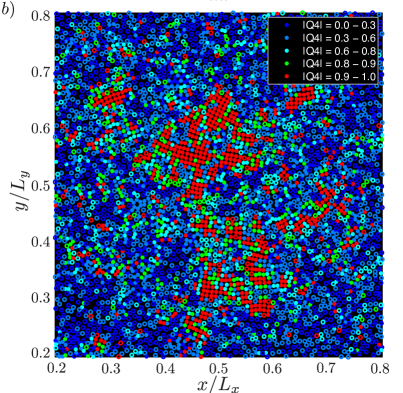
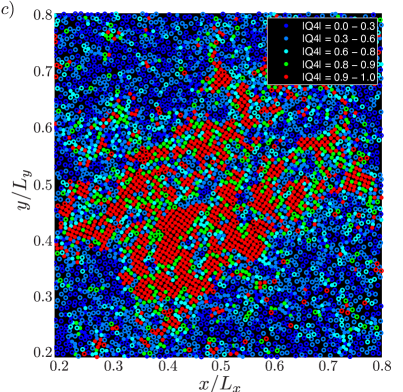
Representative maps of are shown in Fig. 7 for three accelerations, , and . In this case the maps are obtained from images for experiment type A (). Below the transition the ordered patches, or crystallites, are first small, more or less homogeneously distributed in space and are of short lifetime. They increase in size and live for longer time as approaches . Also, they tend appear more near the center than at the sidewalls, which we relate to the large scale small density inhomogeneity discussed before. The quantitative study of crystallites size and lifetime is presented below.
As discussed before, the local density can not change strongly at the transition because of the system’s vertical geometrical confinement. Thus, the correct order parameter must be the local 4-fold symmetry order, measured through the orientational parameter . With this in mind, we define its global average, in space first and then in time,
| (5) |
which measures the fraction of particles in the ordered phase.
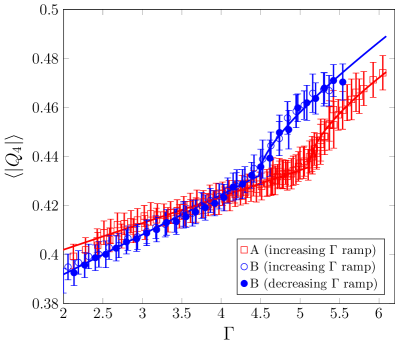
In order to show that the transition is indeed of second order for both experiment types, we present in Fig. 8a the global average versus for the thin and thicker ITO coated plates (type A and B respectively). For the latter, both increasing and decreasing ramps are presented, showing good reproducibility. This figure indeed demonstrates that both configurations present a second order type transition, continuous and with no hysteresis.
The qualitative behavior is the same for both experiment types. First, has a linear dependence on below the transition. This reflects the fact that the fraction of particles that form crystallites with square fold symmetry, even if it is transiently, increases when the transition is approached. For both experiments A and B there is a clear deviation from this linear trend above a given threshold. The critical acceleration –defined for now as the value where the qualitative change occurs– for the thicker ITO coating is lower () than the one for the thin ITO coating (). Also, the initial linear slope below the transition is larger for the thick ITO coating case. Both facts, the lower critical value and larger slope for the thicker ITO coating, are consistent with a lower effective dissipation at the top and bottom walls. Indeed, in this case the transition occurs at a lower amplitude, thus at lower energy injection and dissipation rates, and transient crystals form and grow more easily as increases. In this figure, the continuous lines correspond to fits of a linear dependence for and a supercritical deviation for (details in the figure caption).
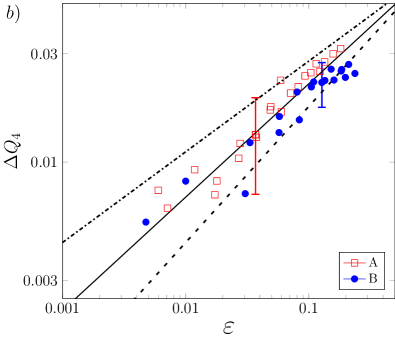
The deviation from the linear trend observed for is defined as , where is defined as the extrapolation of the linear trend over the complete range of . Fig. 8(b) presents versus in log-log scale for each ITO coating thickness. The continuous line shows the supercritical law as a guide to the eye.
The results of Fig. 8(a) are fitted to the supercritical law . The adjusted parameters are (type A) and (type B). We conjecture that the different adjusted values also reflect the difference of dissipation parameters that control the particle-wall collisions.
Next, in order to characterize quantitatively the ordered patches shown in Fig. 7, in particular their typical length and time scales, we analyze the orientational order parameter in momentum space. Its Fourier components are
| (6) |
Then, local order can also be analyzed through its fluctuations in Fourier space by means of the 4-fold bond-orientational structure factor
| (7) |
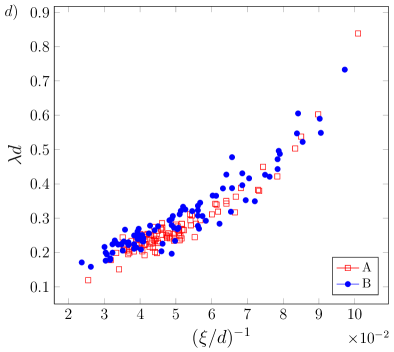
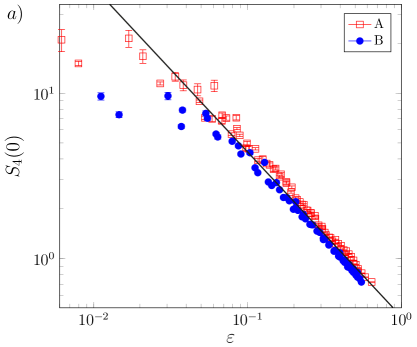
This structure factor is shown in Fig. 9 for several accelerations and for experiment type A. Results for experiments type B are basically the same and are not shown. For both experiment types and for , shows an Ornstein-Zernike-like behavior in the limit ,
| (8) |
where and are the 4-fold bond-orientational correlation length and static susceptibility respectively.
| Experiment type A – Thin ITO coating – larger wall dissipation | ||||
| Free critical exponents | ||||
| () | ||||
| () | ||||
| () | ||||
| Fixed critical exponents | ||||
| Experiment type B – Thick ITO coating – lower wall dissipation | ||||
| Free critical exponents | ||||
| () | ||||
| () | ||||
| () | ||||
| Fixed critical exponents | ||||
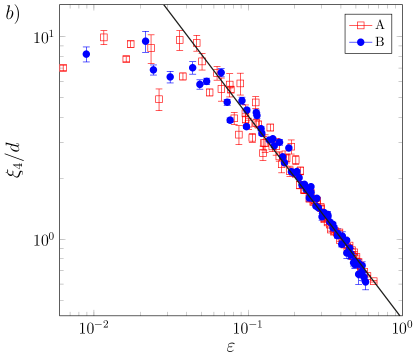
In Fig. 10 we present both and for , obtained from the fits of the Ornstein-Zernike behavior for both ITO coatings. Both quantities are plotted as functions of the reduced acceleration , where is obtained from a specially adapted fitting procedure castillo_PRL . The correlation length and susceptibility vary strongly as the transition is approached. For the two ITO coatings these quantities obey critical power laws. In the limit they both saturate, presumably due to the system’s finite size. For they saturate to and respectively. The critical-like behavior is fitted with both free and fixed exponents. As discussed in our previous work castillo_PRL , the precise measurement of and the critical exponents is far from trivial. Initial fits give in the range and exponents that can vary up to a factor of almost 2. Additionally, the fitted can be quite different depending from which quantity they are obtained. The lack of precision is due to the arbitrariness in the choice of the range to be used for the fit. In castillo_PRL we present a robust method for the determination of these quantities, readers are referred to its supplementary information document for details.
The results for both experiment types are given in Table 1 (the columns referring to the relaxation time and in the hydrodynamic regime will be discussed below). We conclude that for both ITO coatings, the exponents are the same within experimental errors.
In what follows, the exponents are assumed to be fixed and we define
| (9) |
with the critical exponents and . The critical divergence with makes it necessary to fit the separately for each case. For experiment type A the adjusted critical accelerations are and for and respectively, whereas for B they are and respectively. For each ITO coating we find that within experimental errors both critical accelerations are very consistent, as well as with the value obtained from the supercritical behavior of ( and for A and B respectively). Notice that now the critical accelerations are obtained from fits of measured quantities below the transition, whereas for they were obtained with fits of the order parameter above the transition. Finally, the critical accelerations are less consistent between the different measured quantities when the critical exponents are let to be free parameters. This supports the choice of fixing the critical exponents.
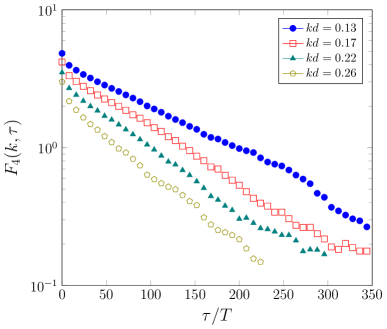
Now, we present the characterization of the crystallite’s relaxation time. Time correlations are computed through the two-time bond-orientational correlation function
| (10) |
where ∗ stands for the complex conjugate and . Our results show that for low wavevectors
| (11) |
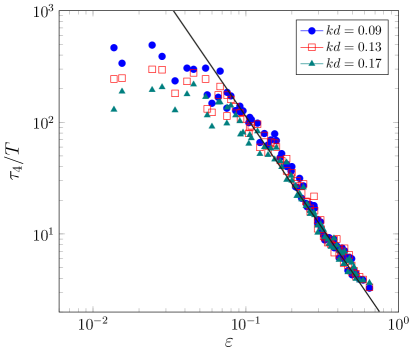
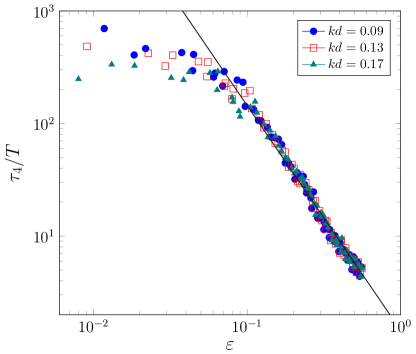
from which the relaxation time is measured. The exponential decay behavior is shown in Fig. 11. From the measured relaxation times we also obtain a critical-like behavior, which is presented in Fig. 12 for the particular cases , and . Here, again we obtain critical power law forms, for both ITO coatings. We have also used free and fixed critical exponents, for which details are given in Table 1. The conclusion is the same as for the correlation length and susceptibility, namely that within experimental errors the free exponent adjustment is very consistent with a fixed critical exponent . Thus, we assume this critical exponent to be fixed and we define
| (12) |
with and is the vibration period. The adjusted critical accelerations are and , for A and B respectively. The relaxation time also seems to saturate for small , which occurs at smaller for lower , that is for fluctuations of larger size.
From the relaxation time analysis we conclude that the dynamical exponent is . As usual, there is critical slowing down in the dynamics. As a consequence, close to the critical point, stationary states are obtained after a long relaxation has taken place. Taken that into account, all ramps are chosen to be slow. Also, averages are taken for long times.
As a final evidence of the observed criticality we now turn to the characterization of the anomalous exponent . In the hydrodynamic regime, , is expected to present a power law decay
| (13) |
where is the critical exponent related to the decay of the pair correlation function , with the dimensionality.
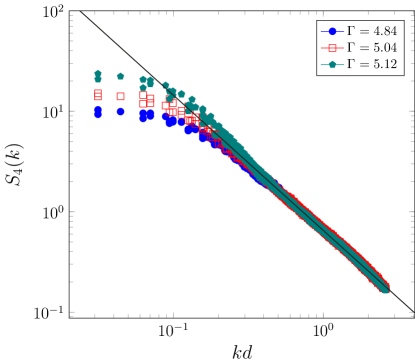
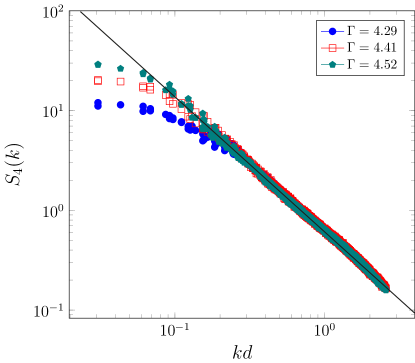
Fig. 13 presents in log-log scale for various . Indeed, as the transition is approached, curves tend to collapse for shorter wavelengths. They are clearly different for larger wavelengths as they converge to different static susceptibilities . In principle, must be obtained in the limit . As the critical acceleration is not known with sufficient precision, in Fig. 13 we present for three accelerations in the vecinity of for both ITO coatings. For the highest , it is not even certain that the system is below the transition or not. Performing power law fits constraining to the range , for configuration A, the measured critical exponents are , and for , and respectively. Similarly, for experiment type B they are , and for , and respectively. Thus, although the anomalous exponent varies rather strongly depending on , we can state that close enough to it can be bounded in the range for both ITO coatings. In conclusion, there is clearly a hydrodynamic regime for which the power behavior is valid, even for a wider range than predicted. However, the measurement of needs to be done extremely close to . With the present data, we can state that is a good estimation.
V Discussion and conclusions
We studied the liquid-solid-like transition that takes place in confined quasi two dimensional granular systems. Two configurations that differ in the dissipation were analyzed, presenting the transition at different critical accelerations. We have demonstrated that the non-equilibrium transition is a second order type for both configurations studied.
Besides, we showed that in our experiments, for both cases, density fluctuations do not present strong variations at the transition. In fact, the static structure factor actually presents a peak at low wavenumbers, which is related to the existence of medium range crystalline order Elliott1991 . In our case, the characteristic length of the these structures in the system does not show critical behavior.
On the contrary, local order presents critical behavior. It is characterized through the bond-orientational order parameter , which in Fourier space shows an Ornstein-Zernike-like behavior. The associated correlation length , the relaxation time , the zero limit of fluctuations (static susceptibility), the pair correlation function of , and the amplitude of the order parameter obey critical power laws, with saturations due to finite size effects. Their respective critical exponents are , , , and , whereas the dynamical critical exponent . Although the critical accelerations and the pre-factors of the power laws differ between the two setups, the reported critical exponents are the same. Hence, while dissipation is strictly necessary to form the crystal, the path the system undergoes towards the phase separation is part of a well defined universality class.
In equilibrium, the scaling hypothesis predicts relations among the critical exponents. It is worth mentioning that the relation is not satisfied, while and ( is the spatial dimension) can be satisfied simultaneously if . This exponent, associated in equilibrium to the specific heat divergence, has no interpretation out of equilibrium.
The critical order parameter in the present case is a non-conserved complex scalar field. Its dynamics, however, is not expected to be autonomous even close to the critical point as density fluctuations are needed to create the ordered phase. Although it has been shown that the transition dynamics is mediated by waves clerc2008 , momentum density decays fast due to friction. Therefore, the most appropriate description in the theory of dynamical critical phenomena is model C, in which a non-conserved order parameter is coupled to a conserved non-critical density hohenberg . In this case hohenberg ; Ccorrect , and in extensions to non-equilibrium dynamics noneqC , the dynamical exponent is predicted to be , consistent with the measurements if .
Acknowledgements.
We thank D. Risso and J. Silva for valuable technical help and discussions. This research is supported by Fondecyt Grants No. 1120211 (N.M) and No. 1140778 (R.S.). G.C. acknowledges the financial support of Conicyt Postdoctorado-2013 74140075.References
- (1) P.C. Hohenberg and B.I. Halperin, Theory of dynamic critical phenomena, Rev. Mod. Phys. 49, 435 (1977).
- (2) J.J. Binney, N.J. Dowrick, A.J. Fisher, and M.E.J. Newman, The Theory of Critical Phenomena: An Introduction to the Renormalization Group (Clarendon Press, Oxford, 1992).
- (3) H. Tanaka, T. Kawasaki, H. Shintani, and K. Watanabe, Critical-like behaviour of glass-forming liquids, Nature Materials 9, 324 (2010).
- (4) P.C. Hohenberg and D. R. Nelson, Early stages of spinodal decomposition in superfluid 3He-4He mixtures, Phys. Rev. B 20, 2665 (1979).
- (5) M. van Thiel and F. H. Ree, High-pressure liquid-liquid phase change in carbon, Phys. Rev. B 48, 3591 (1993).
- (6) V. I. Gorentsveig, P. Fratzl, and J. L. Lebowitz, Kinetics of joint ordering and decomposition in binary alloys, Phys. Rev. B 55, 2912 (1997).
- (7) J. N. Glosli and F. H. Ree, Liquid-Liquid Phase Transformation in Carbon, Phys. Rev. Lett. 82, 4659 (1999).
- (8) R. Shimizu, M. Kobayashi, and H. Tanaka, Evidence of Liquid-Liquid Transition in Triphenyl Phosphite from Time-Resolved Light Scattering Experiments, Phys. Rev. Lett. 112, 125702 (2014).
- (9) J. Kockelkoren and H. Chaté, Late stages of coarsening in model C, Physica D 169-168, 80 (2002).
- (10) R. Folk and G. Moser, Critical dynamics of stochastic models with energy conservation (model C), Phys. Rev. E 69, 036101 (2004).
- (11) H. Tanaka, General view of a liquid-liquid phase transition, Phys. Rev. E 62, 6968 (2000).
- (12) M. Dudka, R. Folk, Y. Holovatch, and G. Moser, Model C critical dynamics of random anisotropy magnets, J. Phys. a: Math. Theor. 40, 8247 (2007).
- (13) J. Marro and R. Dickman, Non-equilibrium Phase Transitions in Lattice Models (Cambridge University Press, Cambridge, 1999).
- (14) M. Henkel, H. Hinrichsen, and S. Lübeck, Non-equilibrium Phase Transitions (Springer, Berlin, 2008).
- (15) M. Kardar, G. Parisi and Y.C. Zhang, Dynamic Scaling of Growing Interfaces, Phys. Rev. Lett. 56, 889 (1986).
- (16) M. C. Cross and P. C. Hohenberg, Pattern formation outside of equilibrium, Rev. Mod. Phys. 65, 851 (1993).
- (17) K.A. Takeuchi, Experimental approaches to universal out-of-equilibrium scaling laws: turbulent liquid crystal and other developments, J. Stat. Mech. P01006 (2014).
- (18) A. Prevost, P. Melby, D. A. Egolf, and J. S. Urbach, Nonequilibrium two-phase coexistence in a confined granular layer, Phys. Rev. E 70, 050301(R) (2004).
- (19) P. M. Reis, R. A. Ingale, and M. D. Shattuck, Crystallization of a Quasi-Two-Dimensional Granular Fluid, Phys. Rev. Lett. 96, 258001 (2006); Caging Dynamics in a Granular Fluid, Phys. Rev. Lett. 98, 188301 (2007).
- (20) C. Cartes, M.G. Clerc, and R. Soto, van der Waals normal form for a one-dimensional hydrodynamic model, Phys. Rev. E 70, 031302 (2004).
- (21) K. Watanabe and H. Tanaka, Direct Observation of Medium-Range Crystalline Order in Granular Liquids Near the Glass Transition, Phys. Rev. Lett. 100, 158002 (2008).
- (22) P.M. Reis and T. Mullin, Granular Segregation as a Critical Phenomenon, Phys. Rev. Lett. 89, 244301 (2002).
- (23) Y. Fan and K. M. Hill, Phase Transitions in Shear-Induced Segregation of Granular Materials, Phys. Rev. Lett. 106, 218301 (2011); Theory for shear-induced segregation of dense granular mixtures, New J. Phys. 13 095009 (2011).
- (24) F. Pacheco-Vázquez, G.A. Caballero-Robledo, and J.C. Ruiz-Suárez, Superheating in Granular Matter, Phys. Rev. Lett. 102, 170601 (2009).
- (25) P. Melby et al., The dynamics of thin vibrated granular layers, J. Phys. Cond. Mat. 17, S2689 (2005).
- (26) M.G. Clerc et al., Liquid-solid-like transition in quasi-one-dimensional driven granular media, Nature Physics 4, 249 (2008).
- (27) C. May, M. Wild, I. Rehberg, and K. Huang, Analog of surface melting in a macroscopic nonequilibrium system, Phys. Rev. E 88, 062201 (2013).
- (28) G. Castillo, N. Mujica, and R. Soto, Fluctuations and Criticality of a Granular Solid-Liquid-like Phase Transition, Phys. Rev. Lett. 109, 095701 (2012).
- (29) H.M. Jaeger, S.R. Nagel, and R.P. Behringer, Granular solids, liquids, and gases, Rev. of Mod. Phys. 68, 1259 (1996).
- (30) I. S. Aranson and L. S. Tsimring, Patterns and collective behavior in granular media: Theoretical concepts, Rev. Mod. Phys. 78, 641 (2006).
- (31) M. Argentina, M.G. Clerc, and R. Soto, van der Waals Like Transition in Fluidized Granular Matter, Phys. Rev. Lett. 89, 044301 (2002).
- (32) L.H. Luu, G. Castillo, N. Mujica, and R. Soto, Capillary-like Fluctuations of a Solid-Liquid Interface in a Non-Cohesive Granular System, Phys. Rev. E 87, 040202(R) (2013).
- (33) Y. Leterrier et al., Mechanical integrity of transparent conductive oxide films for flexible polymer-based displays, Thin Solid Films 460, 156 (2004).
- (34) M.D. Shattuck, http://gibbs.engr.ccny.cuny.edu/technical.php
- (35) M. Cerda and J. Silva, http://www.dfi.uchile.cl/~nmujica/PTrack2/
- (36) J. Silva, Computer Science Engineer thesis, Optimización de proceso de detección de partículas a partir de imágenes de video mediante paralelización, Universidad de Chile (2012).
- (37) S.R. Elliott, Medium-range structural order in covalent amorphous solids, Nature 354, 445 (1991).
- (38) H. Tanaka, Two-order-parameter model of the liquid glass transition. II. Structural relaxation and dynamic heterogeneity, J. of Non-Crystalline Solids 351, 3385 (2005).
- (39) V.K. Akkineni and U.C. Täuber, Nonequilibrium critical dynamics of the relaxational models C and D, Phys. Rev. E 69, 036113 (2004).