Crystal field states of Tb3+ in the pyrochlore spin liquid Tb2Ti2O7 from neutron spectroscopy
Abstract
We report time-of-flight neutron scattering measurements of the magnetic spectrum of Tb3+ in Tb2Ti2O7. The data, which extend up to 120 meV and have calibrated intensity, enable us to consolidate and extend previous studies of the single-ion crystal field spectrum. We successfully refine a model for the crystal field potential in Tb2Ti2O7 without relying on data from other rare earth titanate pyrochlores, and we confirm that the ground state is a non-Kramers doublet with predominantly components. We compare the model critically with earlier models.
pacs:
75.10.Kt, 75.40.Gb, 71.70.Ch, 78.70.NxI Introduction
Among the many magnetically frustrated pyrochlore oxides, Tb2Ti2O7 (TTO) stands out because of its intriguing low temperature state which is thought to be a type of spin liquid.Gardner-RMP-2010 TTO shows no sign of any conventional symmetry-breaking transition (magnetic or structural) down to temperatures as low as 50 mK (Refs. Gardner-PRL-1999, ; Gardner-PRB-2003, ) despite an antiferromagnetic Curie–Weiss temperature of K (Ref. Gingras-PRB-2000, ) and predictions of magnetic order at 1–2 K (Refs. denHertog-PRL-2000, ; Kao-PRB-2003, ). There are, however, strong short-range antiferromagnetic correlations in TTO at low temperatures.Gardner-PRB-2001 ; Rule-PRL-2006 ; Guitteny-PRL-2013 ; Fritsch-PRB-2013
The spin liquid state in TTO is not fully understood, but a key factor is the low energy part of the crystal-field-split electron manifold of Tb3+, which comprises two doublets separated by about 1.5 meV (Refs. Gardner-PRL-1999, ; Gingras-PRB-2000, ). This splitting is comparable with the exchange and dipolar coupling strengths in TTO. Therefore, although the single-ion ground state is Ising-like, transverse fluctuations of the ground state moment appear once interactions are taken into account, and the cooperative nature of these fluctuations could lead to a quantum spin ice state.Molavian-PRL-2007 ; Gingras-RPP-2014 Moreover, the two doublets are also connected by quadrupolar interactions, allowing coupling to phonons. Indeed, the recent observation of hybridization between an acoustic phonon and a crystal field excitation in TTO demonstrates the importance of magnetoelastic interactions in this system.Guitteny-PRL-2013 ; Fennell-PRL-2014 So the conditions exist in TTO for enhanced quantum fluctuations and suppressed magnetic ordering via both magnetic and magnetoelastic interactions, and an accurate determination of the crystal field states is required for quantitative modelling.
Several models for the crystal field potential in TTO have been reported based on analyses of neutron and optical spectra combined with thermal and magnetic data.Gingras-PRB-2000 ; Gardner-PRB-2001 ; Mirebeau-PRB-2007 ; Malkin-PRB-2004 ; Malkin-JPCM-2010 ; Klekovkina-JPCS-2011 ; Klekovkina-Optics-2014 ; Bertin-JPCM-2012 ; Zhang-PRB-2014 Unfortunately, there are significant discrepancies between the published sets of crystal field parameters. These are partly caused by the fact that some of the models employ a truncated basis containing only the 13 states of the ground state 7F6 manifold, whereas others include all the states in the configuration of Tb3+. The main difficulty, however, has been that up to now only four transitions within the level have been observed unambiguously. Information from other heavy rare-earth titanates has generally been used to augment the data on TTO so that the six free parameters needed to describe the single-ion crystal-field Hamiltonian can be determined independently.
In a very recent neutron scattering study,Zhang-PRB-2014 a splitting of one of the peaks was resolved and assumed to originate from two distinct crystal field transitions. This led to a significantly different crystal field potential compared with previous models for TTO. For instance, the wave functions of the ground and first excited doublets are interchanged compared with models informed by data from other rare-earth titanates. The correctness of this assumption has recently been questioned, and the splitting attributed instead to coupling to a phononKlekovkina-Optics-2014 .
The purpose of this paper is to resolve these discrepancies as far as possible. We report neutron scattering measurements of TTO which extend to higher energies than before. We have observed a crystal field transition that was not previously detected, and we have determined the transition intensities on an absolute scale. By fitting the data from TTO alone, using a model that includes intermediate coupling basis states and partial -mixing, we find a crystal field potential that provides a good description of the experimental data. The model described in Ref. Zhang-PRB-2014, cannot be reconciled with our data.
II Experimental Details
A powder sample of mass 16 g was prepared by standard solid state synthesis. The sample was found to be single phase and of high quality to within the precision of laboratory X-ray diffraction. Neutron inelastic scattering measurements were performed on the MERLIN time-of-flight spectrometer at the ISIS Facility.Bewley-Notiziario-2009 The sample was contained in an aluminium foil packet in the form of an annulus of diameter 40 mm and height 45 mm and sealed in an aluminium can containing helium exchange gas. The can was cooled by a closed-cycle refrigerator. Spectra were recorded for approximately 4 hours each with neutrons of incident energy and 150 meV at temperatures of and 90 K. The raw data were corrected for detector efficiency, sample attenuation and time-independent background following standard procedures. Vanadium spectra recorded at the same two incident energies were used to determine the energy resolution and to convert the intensities into units of cross section, mb sr-1 meV-1 f.u.-1, where f.u. stands for the formula unit of Tb2Ti2O7.
III Results
.
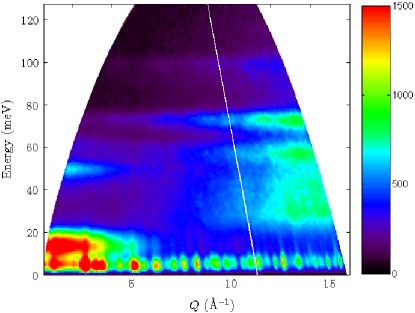
Figure 1 provides an overview of the data recorded at K with meV. The spectrum is presented in the form of a color map of , where is the scattering intensity as a function of energy and the magnitude of the scattering vector . Multiplication by energy suppresses the strong elastic and low energy inelastic scattering and makes the weaker signals at higher energies more visible.
Previous neutron measurements of the spectrum of TTO revealed magnetic transitions centred at 1.5, 10, 16 and 49 meV. In Ref. Zhang-PRB-2014, , a weak feature near 70 meV was also attributed to a magnetic transition, and the 16 meV signal was found to be split into two peaks separated by 2.5 meV consistent with earlier neutronMirebeau-PRB-2007 and RamanLummen-PRB-2008 spectra. The 10–16 meV transitions are clearly visible in Fig. 1 although they not resolved in this particular data set.footnote-1 The 49 meV transition is also present and confirmed as magnetic by the characteristic reduction of its intensity with due to the magnetic form factor. Above 50 meV there is a weak feature near 61 meV which decreases with , and there are peaks near 72 and 90–100 meV which increase with consistent with scattering from phonons.
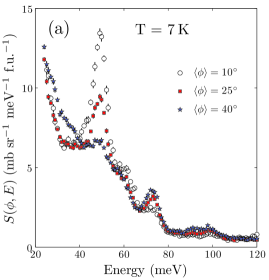
The part of the spectrum with meV is represented in more quantitative detail in Fig. 2. Figure 2(a) shows the intensity as a function of energy for three different average scattering angles taken from the meV run at 7 K. The large peak at 49 meV and the small peak at 61 meV both decrease with increasing (i.e. increasing ), whereas the peaks at 72, 91 and 99 meV all increase with angle. This confirms that the latter three peaks are caused by scattering from phonons, to within the sensitivity of the measurement, whereas the 49 and 61 meV peaks are from magnetic transitions.
Figure 2(b) compares spectra at 7 and 90 K measured with meV. Two features stand out:
(1) The 49 meV peak in the 7 K spectrum is broader than the resolution, with a width (full width at half maximum) of 4.9 meV as compared with the instrumental resolution of about 1.5 meV at this energy. The peak is also asymmetric, with a low energy tail that is not wholly accounted for by the asymmetry of the resolution function. On warming to 90 K, the peak increases in intensity and shifts down in energy to 47.5 meV. Transitions from the thermally populated 1.5 meV first excited crystal field level account for some of the peak width at 7 K but not all, and there are no sharp phonon peaks at this energy (see Fig. 1). These observations suggest that there exists an additional crystal field level at about meV which is strongly connected to the 1.5 meV level. The peak positions and widths at 7 K and 90 K would then be explained by transitions from the ground state and 1.5 meV level to levels at 48 and 49 meV.
(2) In the range 20–45 meV there is considerable additional scattering at 90 K relative to 7 K. The 90 K scattering does not display any particularly prominent features, but a small peak has grown at about 24 meV and there is a weak shoulder near 29 meV which coincides with a minimum in the 7 K spectrum. These temperature-induced features are not accounted for by the thermal population of phonons (the temperature factor for phonon scattering increases by only 4% at 24 meV on warming from 7 to 90 K). The additional scattering must therefore derive from transitions out of thermally excited magnetic levels, and since the separation between the peaks near 16 and 49 meV is significantly greater than 25 meV there must exist a hitherto undetected level between these two. Indeed, thermally excited transitions from the 10 and 16 meV levels to a level near 39 meV would give rise to enhanced intensity around 24 and 29 meV, as observed.
In short, we have observed a magnetic peak at 61 meV which corresponds to a crystal field level not found in previous studies, and we have indirect evidence for additional levels near 39 meV and 48 meV.
To constrain the crystal field model for TTO as tightly as possible we shall also consider the transition intensities. We determined the integrated intensities of the magnetic peaks in the low angle spectrum at 7 K by fitting an asymmetric pseudo-Voigt line shape to the peaks. The parameters of the pseudo-Voigt function were determined according to an empirical implementation of the analytic line shape which contains a contribution from the velocity selection via the chopper,Windsor and an additional component due to the pulse width. The nonmagnetic (phonon) background was estimated from the high angle part of the spectrum, which was scaled to match the high energy transfer part of the low angle spectrum. A list of observed energy levels and transition intensities at 7 K is given in Table 1. For ease of comparison, the intensities have been extrapolated to zero via the dependence of the magnetic dipole form factor of Tb3+.
| Level | (Q=0) | |||
| (meV) | (meV) | (mb sr-1 f.u.-1) | (mb sr-1 f.u.-1) | |
| 0.0 | 0.0 | 2918 | ||
| 1.4(4)111The first excited state is dispersive at low temperature with a band width approaching 1 meV.Gardner-PRL-1999 ; Guitteny-PRL-2013 ; Mirebeau-PRB-2007 ; Zhang-PRB-2014 ; Kanada-JPSJ-1999 | 1.5 | 2744 | ||
| 10.2(4) | 10.3 | 1740(60) | 1836 | |
| 16.0(5)222Comprises two peaks separated by 2.5 meV.Mirebeau-PRB-2007 ; Zhang-PRB-2014 | 16.1 | 990(100) | 1010 | |
| 39(2) | 39.0 | 31 | ||
| 48(1) | 48.2 | | 230(35) | 62 | |
| 49(1) | 48.8 | 184 | ||
| 61(1) | 60.8 | 44(6) | 52 | |
| 71.0 | 8 |
The crystal field at the Tb3+ site in TTO has point symmetry () and is described by the Hamiltonian
| (1) | |||||
where are the crystal field parameters and are Wybourne tensor operators.Wybournebook Diagonalisation of was performed in the intermediate coupling scheme with the program SPECTRE.SPECTRE To speed up the calculation, the complete basis of the configuration of Tb3+ (3003 states) was truncated to the lowest 110 states (the complete term, plus the states , , , and ) extending to 3.5 eV above the ground state. The diagonalisation of included -mixing within the truncated basis.
The neutron spectrum of single-ion magnetic transitions is given byneutronbook
| (2) | |||||
where mb. The first summation is over the initial states with thermal population , and the second summation is over the final states . The Debye–Waller factor is taken to be unity at the low temperatures of the measurements. We assume the dipole approximation, in which case can be replaced by where is the dipole form factor, is the Landé -factor and is the component of the total angular momentum perpendicular to . Calculated intensities are powder-averaged for comparison with the data.
The six crystal field parameters in Eq. (1) were refined by a weighted least-squares fitting algorithm against the experimental data given in Table 1, with the intensities expressed relative to the 10.2 meV peak. The squares of the experimental uncertainties were used as reciprocal weights. The crystal field parameters determined for Ho2Ti2O7 (Ref. Rosenkranz-JAP-2000, ) were used as starting parameters for the fit. The procedure converged to an excellent fit with , where is the standard normalised goodness-of-fit statistic. Fits were also performed with different sets of starting parameters but no other acceptable distinct solutions were found. In particular, fits starting from the parameters found by Zhang et al.Zhang-PRB-2014 did not converge.
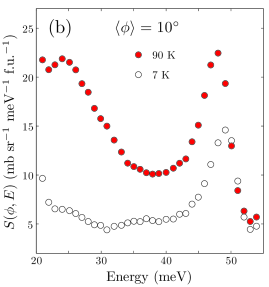
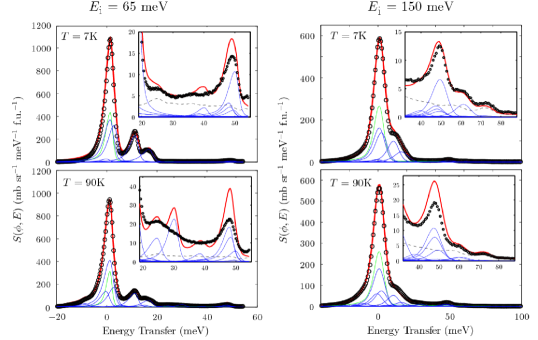
The best-fit parameters are given in Table 1 together with the calculated energy levels and intensities at 7 K. The calculated values agree very well with the observations, including the absolute intensities which have a systematic error of 5–10% from uncertainties in the vanadium calibration and in the corrections for attenuation and the dependence of the magnetic form factor. Figure 3 compares the predictions of the best-fit model with the spectra measured at 7 K and 90 K. Pseudo-Voigt line shapes have been used to model the resolution function. The intensities are calculated in absolute units from Eq. (2) and have not been scaled to fit the data. Overall, the agreement is very good. The main discrepancy is that the measured spectrum at 90 K is less structured above 20 meV than the calculated spectrum, which suggests that the crystal field levels in this energy range broaden significantly with temperature.
| Ref. | ||||||
|---|---|---|---|---|---|---|
| Gingras-PRB-2000, | 53.6 | 318 | 146 | 149 | 67.6 | |
| Mirebeau-PRB-2007, | 60.9 | 291 | 103 | 96.6 | 97.5 | |
| Klekovkina-Optics-2014, 333The model in Ref. Klekovkina-Optics-2014, is a refinement of the models presented in Refs. Malkin-PRB-2004,; Malkin-JPCM-2010,; Klekovkina-JPCS-2011, | 56.0 | 329 | 95 | 107 | 109 | |
| Bertin-JPCM-2012, | 67.3 | 320 | 119 | 113 | 101 | |
| Zhang-PRB-2014, | 144 | 268 | 162 | 171 | 349 | 799 |
| Rosenkranz-JAP-2000, 444Parameters for Ho2Ti2O7 scaled with the point-charge relationHutchings , where is the radial moment of the 4 electron distribution. | 75.3 | 329 | 100 | 111 | 130 | |
| This work | 55.3 | 370 | 128 | 114 | 120 |
IV Discussion
We have presented here a single-ion model based solely on measurements on Tb2Ti2O7 that successfully describes the general features of the observed magnetic spectrum of Tb3+ in Tb2Ti2O7. The crystal field parameters of our model are compared with previously published sets [converted to the Wybourne tensor parameters of Hamiltonian (1)] in Table 2. Our parameters have similar magnitudes and signs to those obtained for TTO in Refs. Gingras-PRB-2000, and Mirebeau-PRB-2007, ; Malkin-PRB-2004, ; Malkin-JPCM-2010, ; Klekovkina-JPCS-2011, ; Klekovkina-Optics-2014, ; Bertin-JPCM-2012, (which however relied on spectroscopic data on other rare earth titanates). The crystal field parameters are also similar to those of Ho2Ti2O7 (Ref. Rosenkranz-JAP-2000, ) and Pr2Sn2O7 (Ref. Princep-PRB-2013, ) after taking into account the differences in the radial moments of the respective orbitals. The lack of significant variation shown in the crystal field potential across different systems implies that the local structure and bonding is similar for different pyrochlore oxides.
As deduced many years ago,Gingras-PRB-2000 the low energy part of the spectrum at low temperature is composed of two non-Kramers doublets separated by approximately 1.5 meV. From our model, the largest components of the ground state and first excited doublet wave functions are found to be
The upper and lower signs give the two components of the doublet, and identifies the spectroscopic term and value for each component. The dominant components in the wave functions are from the Hund’s rule ground state term , as expected, but there is a non-negligible admixture of the and states which in the free ion lie 250 and 410 meV, respectively, above the ground state. For comparison, with the same crystal field model but working in the pure basis with the Stevens operator form of instead of Eq. (1) we find that the overall splitting increases from 71 meV to 81 meV. A list of the wave functions for all the levels within the manifold is given in the Appendix.
Our results are consistent with most previous studies, but are in contrast to the work of Zhang et al.Zhang-PRB-2014 who found essentially the same two lowest doublets as above but in the reverse order, i.e. with as the dominant components of the ground state doublet. This difference arises because Zhang et al. assumed in their analysis that the splitting of the 16 meV peak was due to two distinct crystal field transitions. Although the model of Zhang et al. fits their own data well, our measurements reveal a number of problems with it. Firstly, the magnetic peak we observe at 61 meV was not identified as a crystal field transition by Zhang et al., and therefore not used to constrain the model. Second, their model predicts a level at 101 meV with a very large cross section for transitions to it from the ground state doublet: 440 mb sr-1 f.u.-1 at zero . This prediction is inconsistent with our data since such an intense transition would produce a peak centred at 101 meV in Figs. 1 and 2(a) which, after correction for the Tb3+ form factor, would be of roughly the same size as the peak at 49 meV. Third, the model of Zhang et al. predicts a strong transition from the first excited doublet to a level near 72 meV. The zero- cross section for this transition, which should appear as a thermally excited peak near 70 meV, is about 270 mb sr-1 f.u.-1 at K, inconsistent with the 90 K spectrum shown in the lower right panel of Fig. 3. Finally, the significant intensity from thermally excited transitions observed between 20 and 40 meV — see Fig. 2(b) — is not reproduced.
| Energy (meV) | |||||||||||||
|---|---|---|---|---|---|---|---|---|---|---|---|---|---|
| 0.0 | 0.0 | 1.5 | 1.5 | 10.3 | 16.1 | 39.0 | 39.0 | 48.2 | 48.8 | 60.8 | 60.8 | 71.0 | |
| 0.145 | 0.687 | 0.678 | |||||||||||
| 0.181 | 0.952 | 0.033 | |||||||||||
| 0.968 | 0.194 | ||||||||||||
| 0.686 | |||||||||||||
| 0.110 | 0.176 | 0.956 | 0.057 | ||||||||||
| 0.089 | 0.061 | 0.974 | |||||||||||
| 0.019 | 0.982 | ||||||||||||
| 0.061 | 0.058 | 0.974 | |||||||||||
| 0.110 | 0.956 | 0.057 | |||||||||||
| 0.686 | 0.675 | 0.173 | 0.066 | ||||||||||
| 0.968 | 0.096 | ||||||||||||
| 0.952 | 0.182 | ||||||||||||
| 0.678 | |||||||||||||
The success of our model, which assumes that the split peak at 16 meV corresponds to a single crystal field level, raises questions about the nature of this excitation. One possibility is that the splitting could be the result of disorder, e.g. Tb/Ti site mixing, which could produce two slightly different local environments for the Tb site. However, the fact that no splitting is detectable in any of the other transitions, especially the doublets whose degeneracy is lifted once the symmetry is broken, suggests that there is only one Tb3+ environment. Further, the splitting is too large to be explained by the same two-ion magnetic coupling model which accounts for the dispersion of the first excited doublet.Kao-PRB-2003 Klekovkina and Malkin have suggested that the peak splitting is caused by coupling to a phonon with an energy near 16 meV at the zone centre.Klekovkina-Optics-2014 Indeed, hybridization of acoustic phonons with the 1.5 meV and 10 meV crystal field levels has recently been observed in neutron spectra of TTO,Guitteny-PRL-2013 ; Fennell-PRL-2014 and strong thermally-induced phonon anomalies are observed and attributed to magneto-phonon coupling.Maczka-PRB-2008 The existence of magnetoelastic modes was suggested as an explanation for why frustration is not relieved in TTO by any conventional symmetry-breaking transitions at low temperatures.Guitteny-PRL-2013 ; Fennell-PRL-2014 Although our data cannot shed much light on this interesting question, we mention that the crystal field states in TTO do have strong quadrupole moments so a perturbation to the single-ion states involving a coupling via orbitals is plausible. Measurements on single crystals are needed to identify any coupling to specific phonon modes and to see whether the size of the splitting varies throughout the Brillouin zone.
As far as the physical properties of TTO are concerned, the most important result from this study is that the ground state is dominated by the components . This means that at temperatures where the first excited doublet has negligible population TTO has strong Ising-like anisotropy with the moments confined to the quantization axis, i.e. to the local directions. For the ground state doublet, we calculate that the components of the zero-field spectroscopic -tensor parallel and perpendicular to the quantization axis are and ( in a field of 1 Tesla), consistent with previous estimates.Bertin-JPCM-2012
V Conclusion
We have successfully refined a model for the crystal field in Tb2Ti2O7 against the magnetic spectrum measured by neutron spectroscopy. The model is in very good quantitative agreement with the experimental spectrum, including the absolute intensity, and confirms that the single-ion magnetic properties at low temperature are controlled by two non-Kramers doublets separated by about 1.5 meV. The wave functions of these states are approximately and , respectively. Our analysis is more tightly constrained by experiment than has hitherto been possible, and resolves an uncertainty in the literature about the composition of the ground state. The splitting of the 16 meV peak remains unexplained, and needs further investigation.
Acknowledgements.
We are grateful to Michel Gingras and Bruce Gaulin for helpful comments. This work was supported by the UK Engineering & Physical Sciences Research Council.Appendix A Single-ion eigenfunctions of Tb2Ti2O7
The eigenfunctions for the best-fit model are given in Table 3.
References
- (1) J. S. Gardner, M. J. P. Gingras, and J. E. Greedan, Rev. Mod. Phys. 82, 53 (2010).
- (2) J. S. Gardner, S. R. Dunsiger, B. D. Gaulin, M. J. P. Gingras, J. E. Greedan, R. F. Kiefl, M. D. Lumsden, W. A. MacFarlane, N. P. Raju, J. E. Sonier, I. Swainson, and Z. Tun, Phys. Rev. Lett. 82, 1012 (1999).
- (3) J. S. Gardner, A. Keren, G. Ehlers, C. Stock, E. Segal, J. M. Roper, B. Fåk, M. B. Stone, P. R. Hammar, D. H. Reich, and B. D. Gaulin, Phys. Rev. B 68, 180401(R) (2003).
- (4) M. J. P. Gingras, B. C. den Hertog, M. Faucher, J. S. Gardner, S. R. Dunsiger, L. J. Chang, B. D. Gaulin, N. P. Raju, and J. E. Greedan, iPhys. Rev. B 62, 6496 (2000).
- (5) B. C. den Hertog and M. J. P. Gingras, Phys. Rev. Lett. 84, 3430 (2000).
- (6) Y-J. Kao, M. Enjalran, A. Del Maestro, H. R. Molavian, and M. J. P. Gingras, Phys. Rev. B 68, 172407 (2003).
- (7) J. S. Gardner, B. D. Gaulin, A. J. Berlinsky, P. Waldron, S. R. Dunsiger, N. P. Raju, and J. E. Greedan, Phys. Rev. B 64, 224416 (2001).
- (8) K. C. Rule, J. P. C. Ruff, B. D. Gaulin, S. R. Dunsiger, J. S. Gardner, J. P. Clancy, M. J. Lewis, H. A. Dabkowska, I. Mirebeau, P. Manuel, Y. Qiu, and J. R. D. Copley, Phys. Rev. Lett. 96, 177201 (2006).
- (9) S. Guitteny, J. Robert, P. Bonville, J. Ollivier, C. Decorse, P. Steffens, M. Boehm, H. Mutka, I. Mirebeau, and S. Petit, Phys. Rev. Lett. 111, 087201 (2013).
- (10) K. Fritsch, K. A. Ross, Y. Qiu, J. R. D. Copley, T. Guidi, R. I. Bewley, H. A. Dabkowska, and B. D. Gaulin, Phys. Rev. B 87, 094410 (2013).
- (11) H. R. Molavian, M. J. P. Gingras, and B. Canals, Phys. Rev. Lett. 98, 157204 (2007).
- (12) M. J. P. Gingras and P. A. McClarty, Rep. Prog. Phys. 77, 056501 (2014).
- (13) T. Fennell, M. Kenzelmann, B. Roessli, H. Mutka, J. Ollivier, M. Ruminy, U. Stuhr, O. Zaharko, L. Bovo, A. Cervellino, M. K. Haas, and R. J. Cava, Phys. Rev. Lett. 112, 017203 (2014).
- (14) I. Mirebeau, P. Bonville, and M. Hennion, Phys. Rev. B 76, 184436 (2007).
- (15) B. Z. Malkin, A. R. Zakirov, M. N. Popova, S. A. Klimin, E. P. Chukalina, E. Antic-Fidancev, Ph. Goldner, P. Aschehoug, and G. Dhalenne, Phys. Rev. B 70, 075112 (2004).
- (16) B. Z. Malkin, T. T. A. Lummen, P. H. M. van Loosdrecht, G. Dhalenne, and A. R. Zakirov, J. Phys.: Condens. Matter 22, 276003 (2010).
- (17) V. V. Klekovkina, A. R. Zakirov, B. Z. Malkin, and L. A. Kasatkina, J. Phys.: Conf. Ser. 324, 012036 (2011).
- (18) V. V. Klekovkina and B. Z. Malkin, Optics and Spectroscopy 116, 849 (2014).
- (19) A. Bertin, Y. Chapuis, P. Dalmas de Réotier, and A. Yaouanc, Phys.: Condens. Matter 24, 256003 (2012).
- (20) J. Zhang, K. Fritsch, Z. Hao, B. V. Bagheri, M. J. P. Gingras, G. E. Granroth, P. Jiramongkolchai, R. J. Cava, and B. D. Gaulin, Phys. Rev. B 89, 134410 (2014).
- (21) R. I. Bewley, T. Guidi, and S. Bennington, Notiziario Neutroni e Luce di Sincrotrone 14, 22 (2009).
- (22) T. T. A. Lummen, I. P. Handayani, M. C. Donker, D. Fausti, G. Dhalenne, P. Berthet, A. Revcolevschi, and P. H. M. van Loosdrecht, Phys. Rev. B 77, 214310 (2008).
- (23) The 10 and 16 meV peaks are resolved in our meV spectrum — see Fig. 3. The energy resolution of this run is not sufficient to resolve the splitting of the 16 meV peak observed in other samples, but the 16 meV peak is broader than the 10 meV peak and has two shoulders consistent with the 2.5 meV splitting reported previously. It is likely, therefore, that the splitting of this peak is present in the spectrum of our sample too.
- (24) C. G. Windsor, Pulsed Neutron Scattering (Taylor & Francis, London, 1981).
- (25) M. Kanada, Y. Yasui, M. Ito, H. Harashina, M. Sato, H. Okumura, and K. Kakurai, J. Phys. Soc. Jpn. 68, 3802 (1999).
- (26) B. G. Wybourne, Spectroscopic Properties of Rare Earths (Wiley, New York, 1965).
- (27) A. T. Boothroyd, SPECTRE — a program for calculating spectroscopic properties of rare earth ions in crystals (1990–2014).
- (28) E. Balcar and S. W. Lovesey, Theory of Magnetic Neutron and Photon Scattering (Oxford University Press, Oxford, UK, 1989).
- (29) S. Rosenkranz, A. P. Ramirez, A. Hayashi, R. J. Cava, R. Siddharthan, and B. S. Shastry, J. Appl. Phys. 87, 5914 (2000).
- (30) A. J. Princep, D. Prabhakaran, A. T. Boothroyd, and D. T. Adroja, Phys. Rev. B 88, 104421 (2013).
- (31) M. T. Hutchings, Solid State Phys. 16, 227 (1964).
- (32) M. Ma̧czka, M. L. Sanjuán, A. F. Fuentes, K. Hermanowicz, and J. Hanuza, Phys. Rev. B 78, 134420 (2008).