Constraining spacetime variations of nuclear decay rates from light curves of type Ia supernovae
Abstract
The luminosity of fading type Ia supernovae is governed by radioactive decays of 56Ni and 56Co. The decay rates are proportional to the Fermi coupling constant and, therefore, are determined by the vacuum expectation value of the Brout–Englert–Higgs field. We use publicly available sets of lightcurves of type Ia supernova at various redshifts to constrain possible spacetime variations of the 56Ni decay rate. The resulting constraint is not very tight; however, it is the only direct bound on the variation of the decay rate for redshifts up to . We discuss potential applications of the result to searches for non-constancy of and .
pacs:
06.20.Jr, 95.30.Cq, 97.60.BwI Introduction.
Probing the limits of applicability of fundamental laws of Nature is one of noble tasks for a present-day physicist or astrophysicist. In particular, tests of constancy of parameters of the Standard Model of particle physics and of General Relativity, dubbed fundamental physical constants, attract interest for decades (see e.g. Refs. const1 ; const2 for recent reviews and extensive lists of references). Astrophysics and cosmology, working with largest distances and longest time periods available for research, provide for excellent opportunities to constrain spacetime variations of the fundamental constants.
One of the tools to perform these studies is to compare particular astrophysical processes taking place at various distances and in various directions. Here, we concentrate on the latest stages of explosions of type Ia supernovae. Being very bright, these exploding stars have been observed at cosmologically large distances. At the same time, studies of relatively nearby explosions revealed clear universality in features of these supernovae and related their observable parameters to underlying physical processes. While precise details of the explosion itself remain to be understood, the fading luminosity of a supernova days to months after the explosion is governed by beta decays of 56Ni and 56Co, as it has been confirmed in 2014 by direct observations Ni ; Co . This fact has been used SNGF2 ; SNGF3 to constrain spacetime variations of the decay rates, which are determined by the Fermi constant . In the Standard Model, this “constant” is directly related to the vacuum expectation value of the Brout–Englert–Higgs scalar field. This value is determined by the effective potential for the scalar and may, in principle, vary with the evolution of the Universe.
In this work, we take advantage of the fact that type Ia supernovae have been extensively studied in recent years because of their importance as distance indicators in cosmology. We use the most recent JLA publicly available set JLA , see http://supernovae.in2p3.fr/sdss_snls_jla/ReadMe.html. The light curves are available for 740 objects from various observational campaigns, spanning redshifts between 0 and . This enlarges significantly both the number and the redshift range of supernovae, as compared to previous studies. This allows us to obtain the first constraints on possible spacetime variations of the 56Ni decay rate for the redshift range up to . They may be related to variations in and under certain assumptions.
The relation between the amount of decaying isotopes and the supernova luminosity is not direct and we refer the reader to previous studies SNGF2 ; SNGF3 for discussions of this point. The bottom line is that after the maximum, the luminosity fading is well described by two exponential functions, related to the 56Ni and 56Co decays, with the slopes proportional to the decay rates with a coefficient of order one. Given considerable universality in all type Ia supernova explosions, the coefficient of proportionality does not vary significantly from one object to another and constraints on the variations in the brightness slope are directly translated into constraints on the variations of .
II Analysis and results.
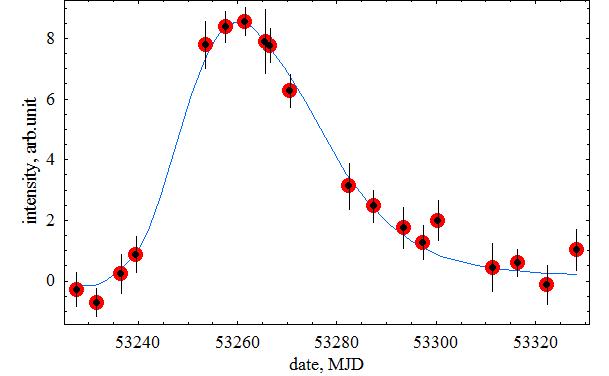
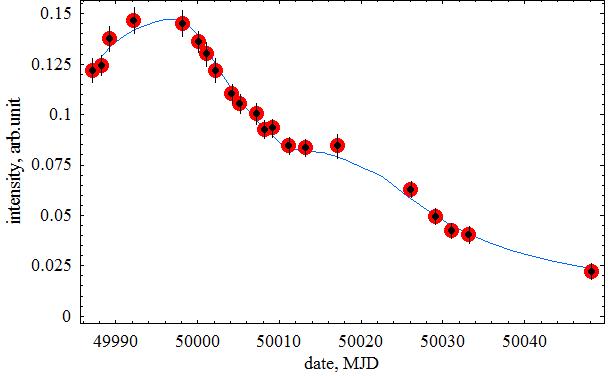
We are dealing here with high-redshift objects, so the observations, performed with a certain filter, correspond to various emitted wavelengths. The relation between the luminosity and the amount of the isotope may be wavelength-dependent, thus causing a systematic redshift-dependent bias in our study. For each supernova, we considered the light curve measured in the R filter and calculated the corresponding emitted wavelength, given known . The light curve was then fitted by a standard wavelength-dependent template obtained by interpolation of templates of Ref. Nugent available at https://c3.lbl.gov/nugent/nugent_templates.html. Example supernova light curves are presented in Fig. 1,


together with our fit.
It is well known that type Ia supernova light curves are not precisely universal; there exists a scatter in the time dependence of the flux parametrized by the so-called stretch factor , one of the parameters of the fit. It is probably determined by variations in the initial chemical composition of the exploding star. This stretch factor relates directly to the quantity we are interested here, the decay rate, since it rescales the time axis. Therefore, the slope of the decay exponent may be determined by approximating a segment of the standard light curve by an exponential function, , where is the flux and is the time after the maximum. We choose the B-filter template and select the first 30 days after maximum to obtain day-1. Then, for a supernova with a stretch factor , we have (note that the trivial redshift multiplicative correction, , is already included at the stage of fitting).
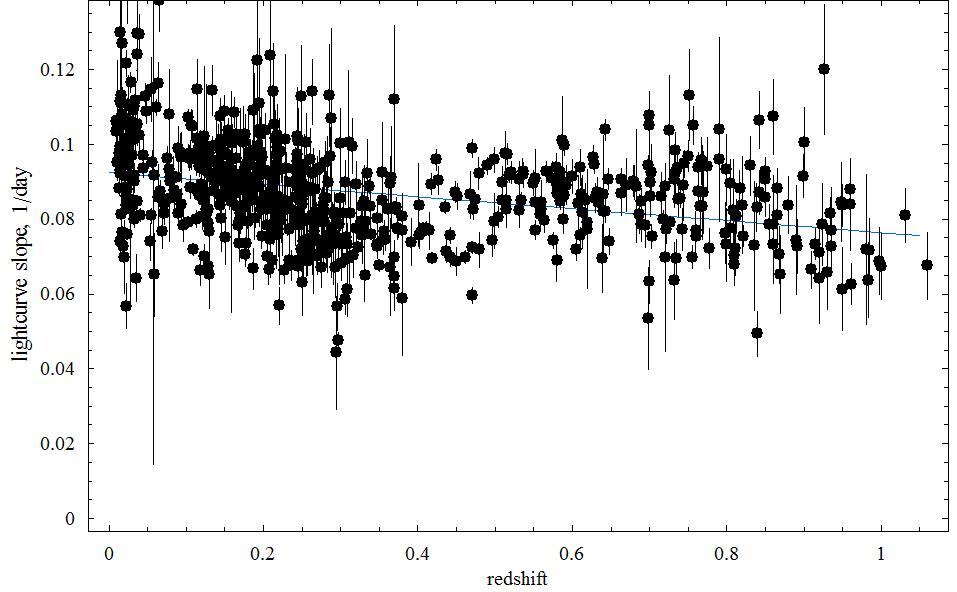
For our analysis, we selected supernovae with at least five data points in the light curve. We removed objects for which the fit was poor. There remained 687 objects in the sample after applying these cuts. Figure 2

presents the redshift-corrected measured lightcurve slopes versus the redshift.
In this figure, one can see the intrinsic scatter of the decay slopes, reflecting variations in chemical composition, absorption etc. It is manifested by the fact that the data points at a given redshift are scattered far beyond their error bars. We account for this intrinsic scatter by introducing a universal systematic error, added in quadrature to the statistical error of the slope measurement. The value of the systematic error is adjusted in such a way that the best-fit of the dependence takes the median value expected for the corresponding number of degrees of freedom111Note that for the relevant number of degrees of freedom, there is almost no difference between median and average.. Assuming linear variation, , we obtain the best-fit value of the slope in the redshift range ,
We will return to the interpretation of this would-be significant effect in Sec. III; here we derive a conservative constraint from it,
| (1) |
Next, we make use of the fact that the observed objects are located in different parts of the sky and search for global patterns of directional variations of . To this end, we study the distribution of the lightcurve slopes on the sky and fit it with a dipole harmonics in the equatorial coordinates ,
where is a unit vector pointing to the direction with coordinates ; the parameters of the fit are the monopole harmonic , the direction and the magnitude of the dipole. The dipole anisotropy is constrained as
| (2) |
III Discussion and conclusions.
The constraints on the variation of the 56Ni decay rate obtained here may be compared to other (scarce) limits on the variation of beta decay rates, see Table 1.
| Isotope | Method | Result | Redshift | Reference |
|---|---|---|---|---|
| 56Ni | supernovae | 1.0 | this work | |
| 56Co | supernovae | 0.024 | SNGF3 | |
| 187Re | meteorites | 0.45 | meteorite |
The next step, that is to relate the observed result to the constancy of fundamental constants, is not straightforward and requires additional assumptions (see e.g. an excellent description of how contrived this step is in Ref. Planck , Sec. 2.2, not to mention numerous more general discussions in the literature).
First, the variations may be constrained in a self-consistent way for dimensionless constants only, while the decay rates and related, more fundamental, parameters and are all dimensionful. A plausible dimensionless combination for our analysis may be formed with the help of the gravitational constant , cf. the “” constant of Ref. Duff2014 . This raises the second subtle point, which constants are allowed to vary. For instance, allowing for variations of the gravitational constant may change the conclusions significantly. Therefore, constraining just the variation of a constant is not that useful; a particular physical model predicting the variations of the entire set of fundamental constants should be constrained instead. The results presented here, that is constraints on the variations of a physical quantity, the decay rate, may be used in any work of that kind.
However, just to put our results in context and to compare them with other limits, we interpret our bounds on the variation of in terms of within a simplified assumption that no other constants are allowed to vary. This is presented for demonstration only, because we do not mean any particular underlying theory behind the assumption.
Apart from the approach we use here, there exist other ways to constrain variations of . The change of another radioactive decay rate, also proportional to , was constrained with meteorite data. People analyzed the effect of on the Big Bang nucleosynthesis (BBN, through several quantities) and on the Cosmic Microwave Background (CMB) and the Large-Scale Structure (LSS) of the Universe (through the change in the electron mass which is proportional to ). All indirect constraints require model-dependent interpretation which is especially hard when effects of the strong interaction, which are not calculable in the fundamental theory, are taken into account. For completeness, we mention here also the possibility to constrain variations of through the change in the electron mass by constraining variations of the electron-proton mass ratio , the most restrictive constraints coming from measurements with atomic clocks (AC) and with quasar (QSO) spectra. These result may constrain variations of if it is assumed that the proton mass does not change with the change of while the electorn mass does, because the former is dominated by strong-coupling effects and is not given by the sum of quark masses, which are in turn proportional to in the high-energy limit. This point requires, however, a quantitative derivation which is presently missing. A far from being exhaustive list of recent constraints and references is presented in Table 2
| Quantity | Method | Result | Redshift | Reference |
| supernovae | 1.0 | this work | ||
| supernovae | 0.024 | SNGF3 | ||
| meteorites | 0.45 | meteorite | ||
| BBN | bbn2 | |||
| BBN | bbn1 | |||
| CMB | Planck | |||
| LSS | lss | |||
| QSO | 0.89 | qsoR1 | ||
| QSO | 0.89 | qsoR4 | ||
| QSO | 1.3 | qsoR3 | ||
| QSO | 2.4 | qsoR5 | ||
| QSO | 3.17 | qsoR2 | ||
| AC | yr-1 | 0 | atom2 | |
| AC | yr-1 | 0 | atom1 |
Studies of the light-curve shapes of type Ia supernovae, in particular of their redshift dependence, have a long story. Probably the first work on this subject was one by Pskovskii Pskovskii . Studies of the rise time of type Ia supernovae, whose redshift dependence was discussed, in particular, in Ref. 2006AJ132-1707 , can hardly be directly used for the purposes of the present work. Modern studies of the fading part of the light curve, e.g. 2007ApJ667L37 , suggest a trend to decreasing of the decay slope of the curve as the redshift increases, similarly to what we observe in the present work. A possible explanation is that the slope depends on the environment in the supernova host galaxy: the decay of the light curve is slower in young stellar environments, while the age of stellar populations decreases with increasing redshift. Therefore, selecting only supernovae residing in galaxies with active star formation may result in a more homogeneous sample 1409.2951 and thus reduce the corresponding bias in the study of the decay rates. This is a prospective way to improve the precision of constraints presented here.
To conclude, we have obtained constraints on the spacetime variation of the 56Ni decay rate; our results are given in Eqs. (1), (2), (3). These are the first bounds on the variation of the nuclear decay rates obtained for the redshift range as large as , see Table 1 for comparison with other results. The interpretation of the results in terms of varying fundamental constants like the Higgs scalar vacuum expectation value may require a formulation of a particular theory describing how these, and other, constants vary. Within simplified assumptions, we compared our result in terms of the variation of to others, including more model-dependent ones, in Table 2.
Acknowledgements.
We are indebted to the anonymous referee for helpful comments and to M. Pshirkov for interesting discussions. The work has made use of JLA supernova lightcurves publicly available at http://supernovae.in2p3.fr/sdss_snls_jla/ReadMe.html. The work of M.P. and S.T. was supported in part by the Russian Foundation for Basic Research, grant 13-02-01293.References
- (1) J. P. Uzan, “Varying Constants, Gravitation and Cosmology,” Living Rev. Rel. 14 (2011) 2 [arXiv:1009.5514 [astro-ph.CO]].
- (2) T. Chiba, “The Constancy of the Constants of Nature: Updates,” Prog. Theor. Phys. 126 (2011) 993 [arXiv:1111.0092 [gr-qc]].
- (3) R. Diehl et al., “Early 56Ni decay -rays from SN2014J suggest an unusual explosion,” Science 345 (2014) 1162 [arXiv:1407.3061 [astro-ph.HE]].
- (4) E. Churazov et al., “First detection of 56Co gamma-ray lines from type Ia supernova (SN2014J) with INTEGRAL,” Nature 512 (2014) 406 [arXiv:1405.3332 [astro-ph.HE]].
- (5) R. J. Scherrer and D. N. Spergel, “How constant is the Fermi coupling constant?,” Phys. Rev. D 47 (1993) 4774.
- (6) A. Ferrero and B. Altschul, “Limits on the Time Variation of the Fermi Constant Based on Type Ia Supernova Observations,” Phys. Rev. D 82 (2010) 123002 [arXiv:1008.4769 [hep-ph]].
- (7) M. Betoule et al., “Improved cosmological constraints from a joint analysis of the SDSS-II and SNLS supernova samples,” Astron. Astrophys. 568 (2014) A22 [arXiv:1401.4064 [astro-ph.CO]].
- (8) P. Nugent, A. Kim and S. Perlmutter, “K-Corrections and Extinction Corrections for Type Ia Supernovae,” Publ. Astron. Soc. Pac. 114 (2002) 803 [astro-ph/0205351].
- (9) K. A. Olive et al., “A Re-examination of the Re-187 bound on the variation of fundamental couplings,” Phys. Rev. D 69 (2004) 027701 [astro-ph/0309252].
- (10) P. A. R. Ade et al. [Planck Collaboration], “Planck intermediate results. XXIV. Constraints on variation of fundamental constants,” arXiv:1406.7482 [astro-ph.CO].
- (11) M. J. Duff, “How fundamental are fundamental constants?,” arXiv:1412.2040 [hep-th].
- (12) M. E. Mosquera and O. Civitarese, “Effect of the variation of the Higgs vacuum expectation value upon the deuterium binding energy and primordial abundances of D and He-4,” Astron. Astrophys. 520 (2010) A112.
- (13) S. J. Landau et al., “Early Universe Constraints on Time Variation of Fundamental Constants,” Phys. Rev. D 78 (2008) 083527 [arXiv:0809.2033 [astro-ph]].
- (14) C. G. Scoccola et al., “The clustering of galaxies in the SDSS-III Baryon Oscillation Spectroscopic Survey: constraints on the time variation of fundamental constants from the large-scale two-point correlation function,” Mon. Not. Roy. Astron. Soc. 434 (2013) 1792 [arXiv:1209.1394 [astro-ph.CO]].
- (15) J. Bagdonaite et al., “A Stringent Limit on a Drifting Proton-to-Electron Mass Ratio from Alcohol in the Early Universe”, Science 339 (2013) 46.
- (16) N. Kanekar et al., “Constraints on changes in the proton-electron mass ratio using methanol lines,” arXiv:1412.7757 [astro-ph.CO].
- (17) H. Rahmani et al., “Constraining the variation of fundamental constants at using 21-cm absorbers,” Mon. Not. Roy. Astron. Soc. 425 (2012) 556 [arXiv:1206.2653 [astro-ph.CO]].
- (18) P. Bonifacio et al., “Fundamental constants and high resolution spectroscopy,” Astron. Nachr. 335 (2014) 83 [arXiv:1310.6280 [astro-ph.CO]].
- (19) R. Srianand et al., “Detection of 21-cm, H2 and Deuterium absorption at along the line-of-sight to J13373152,” Mon. Not. Roy. Astron. Soc. 405 (2010) 1888 [arXiv:1002.4620 [astro-ph.CO]].
- (20) N. Huntemann et al., “Improved limit on a temporal variation of from comparisons of Yb+ and Cs atomic clocks,” Phys. Rev. Lett. 113 (2014) 21, 210802 [arXiv:1407.4408 [physics.atom-ph]].
- (21) R. M. Godun et al., “Frequency Ratio of Two Optical Clock Transitions in Yb+171 and Constraints on the Time Variation of Fundamental Constants,” Phys. Rev. Lett. 113 (2014) 21, 210801.
- (22) Yu.P. Pskovskii, “Photometric classification and basic parameters of type I supernovae,” Sov. Astron. 28 (1984) 658 [Astron. Zh. 61 (1984) 1125].
- (23) A. J. Conley et al. [SNLS Collaboration], “The Rise Time of Type Ia Supernovae from the Supernova Legacy Survey,” Astron. J. 132 (2006) 1707 [astro-ph/0607363].
- (24) D. A. Howell, M. Sullivan, A. J. Conley and R. Carlberg, “Predicted and observed evolution in the mean properties of Type Ia supernovae with redshift,” Astrophys. J. 667 (2007) L37 [astro-ph/0701912 [ASTRO-PH]].
- (25) M. J. Childress, C. Wolf and H. J. Zahid, “Ages of Type Ia Supernovae Over Cosmic Time,” Mon. Not. Roy. Astron. Soc. 445 (2014) 2, 1898 [arXiv:1409.2951 [astro-ph.CO]].