Electronic correlations, magnetism and Hund’s rule coupling
in the ruthenium perovskites SrRuO3 and CaRuO3
Abstract
A comparative density functional plus dynamical mean field theory study of the pseudocubic ruthenate materials CaRuO3 and SrRuO3 is presented. Phase diagrams are determined for both materials as a function of Hubbard repulsion and Hund’s rule coupling . Metallic and insulating phases are found, as are ferromagnetic and paramagnetic states. The locations of the relevant phase boundaries are determined. Based on the computed phase diagrams, Mott-dominated and Hund’s dominated regimes of strong correlation are distinguished. Comparison of calculated properties to experiments indicates that the actual materials are in the Hund’s coupling dominated region of the phase diagram so can be characterized as Hund’s metals, in common with other members of the ruthenate family. Comparison of the phase diagrams for the two materials reveals the role played by rotational and tilt (GdFeO3-type) distortions of the ideal perovskite structure. The presence of magnetism in SrRuO3 and its absence in CaRuO3 despite the larger mass and larger tilt/rotational distortion amplitude of CaRuO3 can be understood in terms of density of states effects in the presence of strong Hund’s coupling. Comparison of the calculated low- properties of CaRuO3 to those of SrRuO3 provides insight into the effects of magnetic order on the properties of a Hund’s metal. The study provides a simultaneous description of magnetism and correlations and explicates the roles played by band theory and Hubbard and Hund’s interactions.
pacs:
71.27.+a,75.50.Cc,72.15.EbI Introduction
The notion that the electronic properties of crystalline materials can to a large degree be understood in terms of the energy bands arising from the solution of the Schrödinger equation for a single electron in a periodic potential is fundamental to condensed matter physics and its applications. Electrons are charged and the inter-electron Coulomb interaction cannot be neglected. Density functional theory (DFT), in essence a sophisticated mean field treatment of electron-electron interactions, provides a very good approximation to the interacting electron problem, enabling the theoretical description from first principles of many properties of many compounds. However DFT does not describe all electronic properties of all materials, and the cases where it fails can be taken to define the “strong correlation problem”.
One dramatic example of strong correlations is the “Mott” insulator Mott (1949): a material in which the correlations are so strong that they lead to insulating behavior in situations where band theory predicts a metal. Less extreme cases, where the interactions do not drive the material insulating but do lead to strong renormalization of electron velocity relative to band theory, to large and strongly temperature and frequency dependent electron lifetimes, and to the occurrence of magnetic order, have been extensively documented Imada et al. (1998).
Transition metal oxides (TMOs) Mott (1949); Imada et al. (1998) play a particularly important role in the investigation of electronic correlations. In many TMO materials the transition metal shells are partially filled. Interactions between electrons in the orbitals of a transition metal ion are characterized by a sizable effective Coulomb repulsion that is close in magnitude to the bandwidth of the -derived bands and leads to the formation of spin and orbital degrees of freedom. As a result the physics of TMO materials often differs sharply from the predictions of DFT and involves an intricate interplay of charge, spin and orbital degrees of freedom, which is furthermore highly sensitive to details of the crystal structure.
These issues have been intensively studied in the context of TMOs which crystallize in variants of the O3 perovskite structure. In the ideal perovskite structure the site ions lie on the vertices of a simple cubic lattice; each site ion is octahedrally coordinated by oxygen. Few members of the family of O3 transition metal oxides crystallize in the ideal cubic structure: in most materials a mismatch between the size of the and site ions (“tolerance factor” less than one) leads to a compressive strain on the O3 network. This strain is typically accommodated by a rotational and tilt (GdFeO3-type) distortion of the O6 octahedra that diminishes the width of the -derived bands and lowers the degeneracy of the multiplets.
Particular attention has been given to materials in which the -site ion is drawn from the first transition metal row of the periodic table so that the shell of the transition metal ion is partially occupied. In these materials the key physics is the correlation-induced metal-insulator transition (often referred to as the ‘Mott’ transition Mott (1949) although actual atomic-scale physics may be more involved Zaanen et al. (1985)). The prevailing understanding Fujimori (1992); Imada et al. (1998) is that in most of these materials the basic “correlation strength” is related to the proximity of the material to the Mott transition (but see Refs. Mizokawa et al., 2000; Park et al., 2012; Johnston et al., 2014; Subedi et al., 2015 for the exceptional case of the nickelates) while the rotational and tilting distortions play a key role in determining this proximity. For example, SrVO3 (nominal valence ) crystallizes in the simple cubic structure and is a moderately correlated Fermi liquid Inoue et al. (1998). In CaVO3, a small-amplitude GdFeO3 distortion occurs; the material is still metallic but more correlated than SrVO3 Inoue et al. (1995, 1998); Makino et al. (1998). In LaTiO3 the nominal valence is also , however a larger-amplitude GdFeO3 distortion is present and the material is a Mott insulator. In isoelectronic YTiO3 the distortion amplitude and the insulating gap are larger than in LaTiO3 Arima et al. (1993); Imada et al. (1998). The differences between Sr- and CaVO3 or between La- and YTiO3 may be attributed to different amplitudes of the GdFeO3 distortion. Theoretical work Pavarini et al. (2004) showed that the key physics is a lifting of the degeneracy of the transition metal levels; this is important because the critical interaction strength needed to drive a Mott transition depends strongly on orbital degeneracy, see, e.g. Ref. Werner et al., 2009 and references therein. (The differences between the V-based and Ti-based materials arise in part from difference in GdFeO3 distortion amplitude and in part from the difference in relative electronegativities of Ti and V Dang et al. (2014a, b).)
However, proximity to a Mott insulating state is not the only cause of correlated electron behavior. In heavy-fermion materials a lattice version of the Kondo effect can lead to enormous mass enhancements and other exotic physics Löhneysen et al. (2007). In transition metal oxides with nominal valences from to the Hund’s coupling can play a crucial role in producing very large renormalizations even for materials far from a Mott transition Haule and Kotliar (2009); Werner et al. (2008); Mravlje et al. (2011); de’ Medici et al. (2011); Yin et al. (2011); Georges et al. (2013).
In this regard transition metal oxides where the transition metal is drawn from the series are of particular interest. Because orbitals have a much greater spatial extent than orbitals, the effective bandwidth is larger and the is smaller, suggesting that the materials are in general likely to be farther from the Mott state than the materials. Although many of the series TMO are indeed itinerant metals, signatures of strong correlations, such as enhancement of the specific heat Bergemann et al. (2003); Chubukov and Millis (2006), magnetic transitions Mackenzie and Maeno (2003) and evidence of other unusual electronic phases Grigera et al. (2001), are clearly present, in particular in the ruthenate family Mackenzie and Maeno (2003); Georges et al. (2013). Further, some members of the series (for example Ca2RuO4) have been identified as Mott insulators Gorelov et al. (2010). Thus in the -series transition metal oxides the issue of the relative importance of Mott and Hund’s correlations remains unclear, as does the role of the GdFeO3 distortions.
Here, we explore these issues by focusing on the two of pseudocubic ruthenates: SrRuO3 and CaRuO3 . Both crystallize in GdFeO3-distorted versions of the O3 perovskite structure; with the distortion amplitude being larger in CaRuO3 than in SrRuO3 . SrRuO3 is ferromagnetically ordered (a rather rare behaviour among TMOs) below a Curie temperature K while CaRuO3 remains paramagnetic to lowest temperatures. On the applied side, SrRuO3 is a convenient electrode material, widely used as a substrate and magnetic ingredient in heterostructures and spin-valves Bibes et al. (1999); Hikita et al. (2007); He et al. (2011); Koster et al. (2012). Basic scientific questions remain open, including their degree of correlation, the origin of the apparently non-Fermi-liquid properties evident in the optical spectra Kostic et al. (1998); Lee et al. (2002) and the reason for the magnetism, in particular why the apparently less strongly correlated material SrRuO3 is magnetic while the apparently more correlated CaRuO3 is not. There is also fundamental interest in obtaining a better understanding of ruthenates in general, because insights gained in the study of the pseudocubic materials may shed light on the unconventional superconductivity of Sr2RuO4 Mackenzie and Maeno (2003) and the metamagnetism and other phenomena observed in Sr3Ru2O7 Grigera et al. (2001).
The question of the correct physical picture of the pseudocubic ruthenate perovskites (whether they should be regarded as weakly correlated itinerant metals or as strongly correlated systems) is the subject of controversy. On the experimental side, photoemission experiments Maiti and Singh (2005) do not detect Hubbard sidebands, suggesting that the materials are not in proximity to a Mott transition. However, an earlier interpretation of the photoemission spectroscopy Fujioka et al. (1997) indicated that sizable renormalizations occur at low energies Kim et al. (2005). Optical spectroscopy Kostic et al. (1998); Dodge et al. (2000); Lee et al. (2002); Schneider et al. (2014) indicates strong deviations from Fermi-liquid behavior, while transport experiments reveal very low Fermi liquid coherence scales ( K for SrRuO3 Capogna et al. (2002) and K for CaRuO3 Schneider et al. (2014)) and large mass enhancements.
On the theory side, early analyses Singh (1996); Mazin and Singh (1997) of the electronic structure based on spin-dependent density functional theory [local spin density approximation (LSDA) or spin-dependent generalized gradient approximation (GGA)] correctly describe many of the magnetic properties. The ferromagnetism in SrRuO3 was interpreted as the result of a Stoner instability, and the presence of magnetism in SrRuO3 and its absence in CaRuO3 was related to the Fermi-level density of states, which is higher and more sharply peaked in SrRuO3 than in CaRuO3 . However the DFT calculations do not account for the low coherence scales and large mass renormalizations. A more recent comparative study of magnetism using a range of band theoretic techniques including the density functional plus method concluded that gives the best description of the experimentally observed transition temperatures Etz et al. (2012). Within LSDA, properties of SrRuO3 and CaRuO3 under strain were calculated Zayak et al. (2006, 2008) and the predicted occurrence of ferromagnetism in CaRuO3 under tensile strain was recently observed Tripathi et al. (2014). On the other hand, many theoretical papers including the LSDA+ work of Rondinelli and collaborators Rondinelli et al. (2008) and several dynamical mean-field theory (DMFT) investigations Laad et al. (2008); Jakobi et al. (2011); Huang and Ao (2013); Grånäs et al. (2014) assert that correlations beyond LSDA/GGA are important.
The existing literature thus suggests that the challenge presented by the perovskite ruthenates is to develop a theory that includes the electronic correlations that provide the experimentally indicated mass enhancement and other renormalizations without spoiling the good account of the magnetic phase diagram found in density functional calculations. In this paper we address this challenge by performing a systematic density functional plus dynamical mean field theory study that includes realistic electronic structure and investigates a wide range of potentially relevant interaction parameters. We calculate the phase diagram in the plane and by comparing calculated and measured properties we locate the perovskite ruthenates in the correlated Hund’s metal region of the phase diagram. Effective masses are found to be large and coherence scales small in the paramagnetic phase. The greater tendency to magnetic ordering in SrRuO3 than in CaRuO3 is accounted for in a manner similar to that found in earlier electronic structure calculations. Our results also provide insight into the general issue of the effect of GdFeO3 distortions on the effective correlation strength of Hund’s metal. The low frequency properties are affected by the density of states (which in the ruthenates is reduced by GdFeO3 distortions) while the global and higher frequency correlation strength is controlled by the inverse bandwidth (which is increased by GdFeO3 distortions).
The rest of this paper is organized as follows. Section II describes the methods we use. Section III presents our computed ferromagnetic/paramagnetic (FM/PM) and metal-insulator phase diagrams and discusses the physics behind them. Section IV discusses the differences of two ruthenates in the mass enhancement and the self-energy and uses this information to locate the materials on the phase diagram of Sec. III. The magnetic phase of SrRuO3 is analyzed in detail in Sec. V. Section VI presents a summary and prospects for future work. Appendices provide details of the calculations
II Crystal structure, electronic structure and model
CaRuO3 and SrRuO3 crystallize in a symmetry crystal structure related to the ideal cubic perovskite structure by a GdFeO3 distortion corresponding to a tilt and rotation of each RuO6 octahedron. The tilts and rotations alternate in a four-sublattice pattern. SrRuO3 has a Ru-O-Ru bond angle of about , in between the ideal perovskite Ru-O-Ru bond angle of and the Ru-O-Ru bond angle of observed in CaRuO3 Jones et al. (1989); Bensch et al. (1990).
Valence counting implies that in CaRuO3 and SrRuO3 the Ru is in the electron configuration with four electrons in the Ru shell. The octahedral ligand field pushes the levels up in energy so the relevant near-Fermi-surface bands are derived from Ru symmetry states with some admixture of the O states. Because Ru is a second-row transition metal ion, the states are expected to be more extended and the on-site interaction is expected to be weaker than for the first-row transition metal ions, indicating Georges et al. (2013) that the materials are not in the charge transfer regime of the Zaanen-Sawatzky-Allen phase diagram Zaanen et al. (1985). We therefore adopt the “frontier orbital” approach in which the low energy electronic properties are obtained from a multiband Hubbard model with hybridizations and level splittings obtained from the near-Fermi-surface transition metal -derived bands.
The Hamiltonian takes the general form
| (1) |
where describes the dispersion of the bands derived from the frontier orbitals and the additional interactions. The chemical potential is set to ensure that these bands contain four electrons per Ru.
To define the near-Fermi-surface bands of precisely we use the non-spin-polarized generalized gradient approximation (GGA) as implemented in the Quantum ESPRESSO density functional code Giannozzi et al. (2009); QEP to obtain electronic band structures and then project the resulting bands onto maximally-localized Wannier functions (MLWF) Marzari and Vanderbilt (1997); Souza et al. (2001) using the wannier90 code Mostofi et al. (2008) (details are given in Appendix A).
In most of this paper we construct by projecting the Kohn-Sham Hamiltonian onto -symmetry Wannier functions centered on the Ru sites. This procedure captures correctly all of the electronically active frontier orbitals and provides a reliable description of the phase diagram and quasiparticle properties. However, as will be discussed in detail in Sec. V, this procedure leads to an overestimate of the magnetic moment in the magnetically ordered phase. Obtaining a correct estimate of the ordered moment requires inclusion of bands derived from Ru states. In our analysis of the magnetic state the -derived bands are therefore retained, but because the -derived states are far from the Fermi level, they are treated by the mean-field approximation used in Ref. Held, 2007.
The orbitals are treated dynamically. As usual in studies of transition metal oxides, the interaction Hamiltonian is taken to be site-local and to have the rotationally invariant Slater-Kanamori form Imada et al. (1998). We use the form appropriate Georges et al. (2013) for intra- orbitals, since these are the primary focus of this work
| (2) |
where are orbital indices and is the spin index. Different values of and have been used for ruthenates in the literature. For Sr2RuO4, constrained LDA Pchelkina et al. (2007) gives values of while the values Mravlje et al. (2011) and Vaugier et al. (2012) have been obtained from constrained random phase approximation (cRPA) method. As discussed above, for the perovskite ruthenates values ranging from zero to rather large numbers have been employed. For this reason and because the behavior of the model for general parameters is of theoretical interest, we consider a range of values for and in this paper. However we restrict attention to the regime where the effective on-site interaction is positive in all channels.
To treat the onsite interaction [Eq. (2)], we employ single-site dynamical mean-field theory (DMFT) Georges et al. (1996). This method allows us to map the Hamiltonian [Eq. (1)] into a multiorbital impurity model embedded in a fermion bath. The impurity model is solved by using the hybridization expansion version of the continuous time quantum Monte Carlo (CT-HYB) Werner et al. (2006) implemented in the TRIQS code Parcollet et al. (2015) for rotationally invariant interaction using conserved quantities Parragh et al. (2012) to speed up the calculations.
Care is required in the definition of the impurity model. Each Ru ion is at the center of an octahedron defined by six oxygen ions. The structure means that the local symmetry axes of a given RuO6 octahedron are not parallel to the axes that define the global crystal structure. If the and combinations of the -derived states in a single octahedron are defined with respect to the global, rather than the local, symmetry axes, the impurity model will contain off-diagonal terms which mix the different orbitals at the single-particle level. This causes a severe sign problem for the CT-HYB solver Gull et al. (2011). It is preferable to avoid this complication, following Ref. Dang and Millis, 2013, by using a local basis with symmetry axes aligned along the octahedral directions appropriate to a given Ru, instead of the global axes. When restricted to the manifold only, the MLWF approach used here produces orbitals that are already aligned with respect to the local axes of the appropriate octahedron so the hybridization function is essentially diagonal. Thus if only orbitals are retained the DMFT calculation is straightforward: the impurity model with hybridization function defined directly from the projection of the Kohn-Sham Hamiltonian onto the Wannier states is solved for one Ru site. The self-energies for the other Ru sites are then constructed by applying appropriate rotation operators. If the MLWF procedure is applied to the full manifold (including both and orbitals) then the resulting orbitals turn out not to be aligned to the local symmetry axes and an additional change of basis is required before solving the impurity model (see Appendix A). From the solution of the dynamical mean field equations we determine the phase (metal versus insulator, paramagnetic versus ferromagnetic) and some properties of the phases, in particular the quasiparticle mass enhancement and the magnetic moment. Details of our procedure for determining different phases are given in Appendix B.
III Qualitative Physics
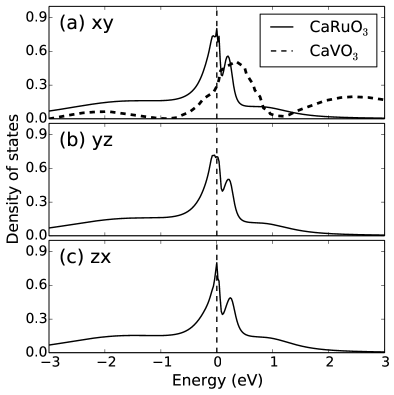
III.1 Electronic structure: Density of states
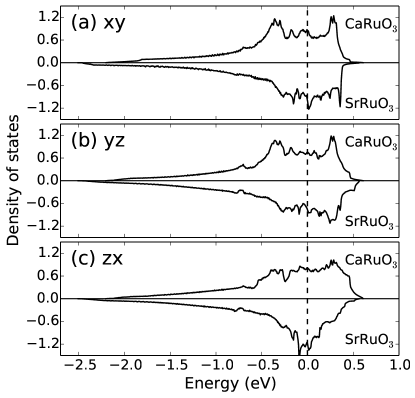
Figure 1 shows the orbitally-resolved near-Fermi-surface density of states (DOS). The DOS of the two materials are similar, as expected from the essentially identical quantum chemistry, but the difference in the magnitude of the GdFeO3 distortion occurring in the two materials leads to two important differences in the DOS. First, the -derived bands in SrRuO3 are approximately wider than those of CaRuO3 (SrRuO3 bandwidth eV, as compared to eV for CaRuO3). To the extent that correlation effects scale as the ratio of an interaction strength to a bandwidth, this would suggest that CaRuO3 would be the more strongly correlated material.
However, SrRuO3 has the larger density of states at the Fermi level. This can be traced back to the van Hove singularity of the undistorted cubic structure, which happens to lie very close to the Fermi level. Because the GdFeO3 distortion lifts the degeneracy of the levels, it splits the van Hove peak into three features. In SrRuO3 the splitting is small and the density of states remains large. In CaRuO3 the splitting is larger, leading to a smaller Fermi-level DOS. To the extent that correlation effects are related to the Fermi-level density of states, this suggests that SrRuO3 would be the more strongly correlated material. In particular, the Stoner model of ferromagnetism relates the presence of magnetic order to the value of the product of an interaction constant and the Fermi-level density of states Stoner (1927), so the density of states difference would suggest (in agreement with experiment and with the DFT work of Refs. Allen et al., 1996; Singh, 1996; Mazin and Singh, 1997) that SrRuO3 is more likely to be magnetic than CaRuO3 . Further, particularly in CaRuO3 , the splitting creates a density of states peak below the Fermi level. The considerations of Ref. Dang and Millis, 2013 building on previous work of Vollhardt and collaborators Vollhardt et al. (1996); Ulmke (1998); Wahle et al. (1998); Held and Vollhardt (1998); Chan et al. (2009) suggest that this peak is unfavorable to magnetism.
III.2 Phase diagrams
Figure 2 displays the phase diagrams in the plane of the Hubbard and the Hund’s coupling , determined by the procedure described in Appendix B. We considered metallic and insulating phases, paramagnetic and ferromagnetic phases. Antiferromagnetism was not studied.
Focus first on the upper right panel, which presents results for CaRuO3. We see that as the interaction strength is increased at fixed , there is a phase transition from a metal (which may be paramagnetic or ferromagnetic) to a Mott insulator. As is increased at fixed , a transition to a ferromagnetic metal phase occurs but no ferromagnetism was found in insulating phases in the and ranges that we studied. From this phase diagram one can identify two regimes: at large values of , near the metal-insulator phase boundary, properties are most sensitive to the value of the effective Hubbard interaction. Note in particular that at large the phase boundary becomes a straight line with slope . The quantity is the effective Hubbard interaction (correlation strength) relevant to the Mott transition because it gives the lowest energy cost for a valence change from to high spin . In contrast, far from the metal-insulator phase boundary, the Hund’s coupling is the key parameter: by increasing a ferromagnetic phase is induced and there is a range of in which the location of the critical boundary is only weakly dependent on .
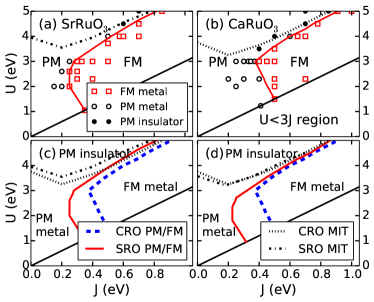
The upper left panel displays our results for SrRuO3. The same phases are found but the difference in GdFeO3 distortion amplitude causes the location of the phase boundaries to be different. To highlight the differences between the two calculations we present in Fig. 2(c) a superposition of the two phase diagrams. At larger the phase boundaries are parallel (and controlled by ), with CaRuO3 requiring a slightly smaller value of to be driven into the Mott phase, as expected from the smaller bandwidth and larger -level splitting following from the larger distortion in CaRuO3 . However, in this region of the phase diagram the magnetic phase boundaries are very similar, and an extreme fine-tuning of would be required to account for the fact that CaRuO3 is a paramagnetic metal, while SrRuO3 is a ferromagnetic metal.
A much more significant difference between phase boundaries for the two structures is found at smaller values of eV. There, the CaRuO3 phase diagram has a significantly smaller region of ferromagnetism than the SrRuO3 one. Thus, in this regime much less fine-tuning of the parameters is needed to correctly account for the difference in magnetic behavior of the two materials. As discussed in Sec. IV, there are also other experimental indications suggesting that these two materials should be viewed as being in this Hund’s coupling dominated regime. We also note that the cRPA values of found for the related Sr2RuO4 material Vaugier et al. (2012) are in the moderate , larger region where CaRuO3 is paramagnetic but SrRuO3 is ferromagnetic.
We now discuss further the qualitative origin of the observed differences between the phase diagrams of the two structures, by presenting in Fig. 2(d) a superposition of the phase diagrams of the two materials, but with the and values for SrRuO3 rescaled by the ratio of the SrRuO3 to the CaRuO3 bandwidth. At larger the phase diagrams for both the metal-insulator transition and magnetism coincide in the rescaled plot. This indicates that in the Mott-dominated region the physics is controlled by the ratio of the interaction strengths to the bandwidths and depends only weakly on for example the Fermi-level DOS. However, in the smaller regime, the magnetic phase diagrams do not coincide, indicating that in this regime the physics is clearly not controlled solely by the difference in bandwidths.
Instead, the substantial difference in the critical required to drive the ferromagnetic transition is associated to the DOS in the near-Fermi-level region. One important property is the value of the DOS at the Fermi level . In the standard Stoner theory Stoner (1927) magnetism is associated with a value greater than unity of a dimensionless interaction parameter constructed as the product of an appropriate interaction energy and the Fermi level density of states (). Clearly the larger DOS in SrRuO3 makes it easier for the Stoner parameter to exceed the critical value and as discussed by Mazin and collaborators Singh (1996); Mazin and Singh (1997) spin dependent DFT calculations indeed indicate a Stoner parameter slightly greater than unity for SrRuO3 and slightly less for CaRuO3 . It is also worth noting that the Stoner theory is in essence a Hartree approximation. When the correlation is fully treated, other factors such as the energy derivative of the DOS at the Fermi level and indeed the structure of the DOS far from the Fermi level are also important and provide significant corrections to the simple Stoner estimate. Dynamical mean field studies of related models Vollhardt et al. (1996); Ulmke (1998); Wahle et al. (1998); Dang and Millis (2013) indicate that for systems with carrier concentration such that the shells are less than half occupied such as La1-xSrxVO3 ( valence ) ferromagnetism is favored if the DOS peak is at or below the Fermi level Dang and Millis (2013). A particle-hole transformation allows us to relate the results of Ref. Dang and Millis, 2013 (derived for a system with valence near ) to the ruthenates (valence ), concluding that in the ruthenates a DOS peak at or above the Fermi level favors ferromagnetism. Therefore, as seen in Fig. 1, the larger distortion of CaRuO3 produces below-Fermi-level density of states peaks, thus disfavoring ferromagnetism, while in SrRuO3 the DOS peaks concentrate at the Fermi level and ferromagnetism is favored.
IV Self-Energy, Mass Enhancement and Quasiparticle Lifetime
In this section we study the electron self-energy and quasiparticle properties, choosing interaction parameters and eV as representatives of the Hund’s metal and Mott-dominated regimes respectively. These values are similar to those obtained for the related material Sr2RuO4 from ab initio estimations using constrained DFT Pchelkina et al. (2007) and constrained RPA Mravlje et al. (2011) approaches, respectively. We fix eV as a representative value for which the Ca material is paramagnetic and the Sr material is ferromagnetic.
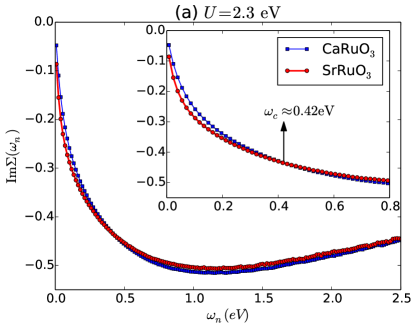
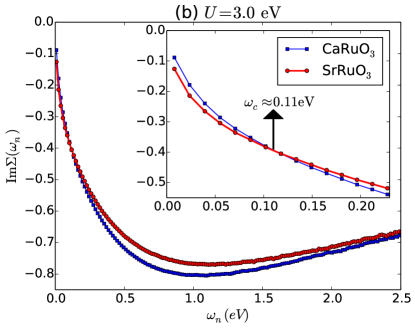
Figure 3 displays the imaginary parts of the computed Matsubara-axis DMFT self-energies restricted to the paramagnetic phase over a wide range of Matsubara frequencies. We see that at low frequencies the self-energy of the Sr-compound is larger, indicating that for quantities dominated by low energies the Sr material may be viewed as more correlated. On the other hand, above a frequency the self-energy of the Ca material is larger, reflecting the effect of the difference of bandwidths on the effective correlation strength at higher energies. The Hubbard and Hund’s coupling compete in this respect. At smaller [Fig. 3(a)], the Hund’s coupling effect is stronger, resulting in a wider range of low frequency (larger eV) in which SrRuO3 is more correlated. For the larger close to the MIT phase boundary, Mott physics associated with becomes stronger, as signaled by the decrease of by a factor of [ eV in Figure 3(b)].
We now turn to two key physical quantities characterizing quasiparticles in the metallic state, namely the effective mass enhancement (directly related in the local DMFT approach to the quasiparticle weight ) and the quasiparticle scattering rate (inverse lifetime) . These are defined from the real and imaginary part of the retarded self-energy on the real-frequency axis by:
| (3) | |||||
Inferring real-axis quantities from Matsubara-frequency data in general requires analytical continuation. If, however, the low frequency properties are reasonably well described by the Fermi liquid fixed point (as is the case for the parameters we study), the low frequency limit of the real frequency self-energy may be inferred with reasonable accuracy from the data at small Matsubara frequencies, with and . In practice, we extract and by fitting a fourth-order polynomial to the first six Matsubara-axis data points for and computing the needed quantities from the fitting function.
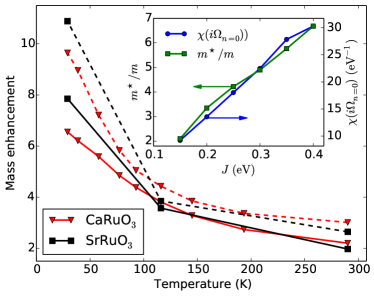
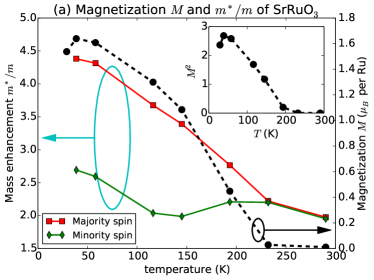
Figure 4 shows the estimated mass enhancement for the two materials at the two values of under consideration. The calculations are restricted to the paramagnetic state and show a strong temperature dependence, which is a manifestation of the low quasiparticle coherence scale associated with the formation and slow fluctuation of a local moment with (in other words, with Hund’s metal physics) Werner et al. (2008); Georges et al. (2013). As will be seen below, in the ferromagnetic state of SrRuO3 the temperature dependence is cut off because the ferromagnetic order quenches the slow spin fluctuations. To reinforce this point we show in the inset that the mass enhancement and zero Matsubara frequency impurity model spin correlation function have identical dependence. Comparison to Fig. 1 shows that the local spin fluctuations involve an energy scale that is much lower than that of the bare density of states.
In our simulations we were unable to reach temperatures low enough to observe the saturation of the mass to its limit in the paramagnetic phase. Nevertheless, we find the quasiparticles are becoming well defined at the lowest temperatures reached in our simulations. Figure 5 presents the temperature dependence of calculated for CaRuO3 at and eV with eV. Below K for eV and below K for eV the scattering rate becomes smaller than temperature, which is indicative of coherence. We expect that as the temperature is lowered further below the coherence scale the mass will saturate. From these considerations we estimate the mass enhancements to be about 7 and for the and eV, respectively.
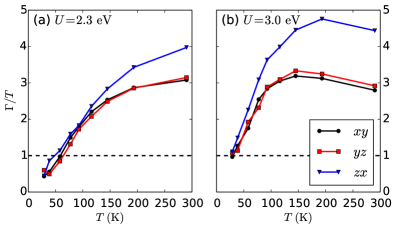
We remark that Fig. 5 implies that the quasiparticle scattering rate varies as up to K, even though the characteristic Fermi liquid signatures in physical observables (temperature independent mass/specific heat coefficient and magnetic susceptibility along with quadratic transport scattering rate) are only evident below much lower temperatures (lower than the lowest temperature accessible in our , eV calculations). This behavior qualifies CaRuO3 as a ‘hidden Fermi liquid’ Xu et al. (2013); Deng et al. (2014) in which although the temperature dependence of e.g. the resistivity deviates from above a very low temperature, the quasiparticle scattering rate remains up to much higher temperatures and the deviation from the Fermi liquid temperature dependence expected for the resistivity is attributable to a temperature dependence of the quasiparticle weight.
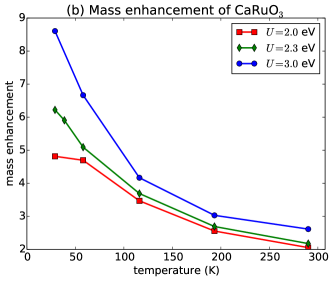
We now use the experimentally measured low temperature specific heat coefficient to help constrain the parameter values. The measured low- specific heat of CaRuO3 is mJ/molK2 Cao et al. (1997), implying a mass enhancement with respect to the DFT value. We note that the experimental value has a contribution (of unknown magnitude) from the electron-phonon interaction, so should be regarded as an upper bound on the electronic contribution to the mass enhancement. Figure 4 shows that has a marked dependence on while Fig. 6 shows that depends even more strongly on Hund’s coupling . As the interaction parameters are not likely to change significantly between the two compounds, we assume that SrRuO3 and CaRuO3 are described by the same values. Requiring that the calculated mass enhancement for CaRuO3 is close to but not higher than the measured mass, and at the same time that be such that SrRuO3 is ferromagnetic and CaRuO3 is paramagnetic allows us to locate the materials on the phase diagram.
At eV the phase diagram of Fig. 2 requires that eV while for in this range the masses resulting from our calculations are clearly above the experimental value ( at K and clearly increasing as is decreased; see also the lower panel of Fig. 8). Thus we argue that the combination of the mass and phase diagram are inconsistent with the possibility that the perovskite ruthenates are in the Mott-dominated regime.
On the other hand, our results at smaller indicate that the Hund’s metal regime can provide a good description of the basic physics. A relatively wide range of is found for which SrRuO3 is magnetic and CaRuO3 is not, while the sensitive dependence of the mass enhancement on , with masses ranging from much smaller than, to rather larger than, the measured value, means that a reasonable eV and eV (close to those found from constrained DFT and cRPA methods Pchelkina et al. (2007); Mravlje et al. (2011); Vaugier et al. (2012)) will account for the basic physics.
It is interesting to look also at the correlated DOS. We obtained the spectra at real frequencies using the maximum entropy method Jarrell and Gubernatis (1996); Comanac (2007) to continue the self-energies Wang et al. (2009) and then using the continued self-energies to construct the orbitally-resolved spectra. The results are presented in Fig. 7 (solid lines). The densities of states of the three orbitals are quite similar. Comparison of the near-Fermi-level fine structure in the DOS to that shown for the noninteracting model in Fig. 1 reveals that the peaks seen at eV and eV in the and bands of the CaRuO3 DFT DOS are renormalized differently. The negative frequency peak is pulled up much closer to the Fermi level, appearing at about eV in the correlated band structure. The positive frequency peak in the correlated band structure occurs at approximately the eV energy of the DFT band structure, thus is renormalized by a much smaller amount. The difference is a manifestation of a large particle-hole asymmetry in the self-energy, whose influence on the spectroscopy was discussed in Stricker et al. (2014). The effect is a fingerprint of Hund’s metal physics, as recently noted in Ref. Wadati et al., 2014. See also a very recent preprint Kim and Min (2015) for calculations of DOS in SrRuO3 within an approach similar to ours.
Figure 7 also presents for comparison the many-body density of states calculated for the material CaVO3 Nekrasov et al. (2005), in which the correlations are believed to arise from Mott physics (Hund’s metal physics requires a higher occupancy of the level). The spectrum of the Mott material consists of a central peak corresponding to a uniformly renormalized DFT DOS and clearly visible Hubbard satellites at and eV. In contrast the spectrum of the Hund’s material CaRuO3 lacks clear Hubbard sidebands, but as noted above does exhibit a more strongly renormalized and more highly structured quasiparticle peak. Although the Hubbard bands are more visible in the Mott material, the correlations are in an important sense weaker, with the mass enhancement of CaVO3 only about 2-3 Nekrasov et al. (2005) in contrast to the that we find for CaRuO3.
V Magnetic phase of
In this section we show that the correlated Hund’s metal picture provides an adequate description of the magnetic phase of SrRuO3 , preserving the successful description of the magnetic properties obtained from DFT calculations Maiti and Singh (2005); Etz et al. (2012) while simultaneously providing a good account of the quasiparticle mass. While a restriction of the correlated subspace to the Ru orbitals is adequate for most purposes, calculations within this scheme yield half-metals, with magnetic moments that saturate at per Ru site and with too-small values of the specific heat coefficient. We therefore treat a five-band model that includes both and -symmetry orbitals, with the states and - interactions treated in a mean field approximation. [The intra- interactions remain as specified in Eq. (2)]. Inclusion of the orbitals, which lie well above the Fermi level and play no important role in the calculation of dynamical quantities in the paramagnetic phase, acts to stabilize the magnetization at partial polarization.
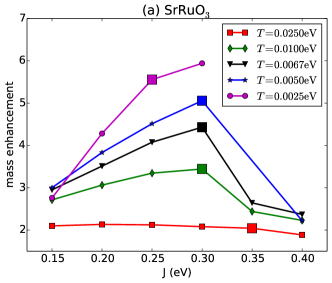
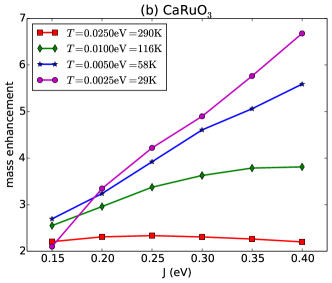
The two panels of Fig. 8 compare the mass enhancements of SrRuO3 and CaRuO3 computed within the five-band model. The lower panel shows the -dependence of the CaRuO3 mass enhancements for three values. The behavior is in agreement with the three-band computations discussed above: the mass increases as is decreased, and below a -dependent scale saturates at a -dependent value. At the eV in this figure, we see that the mass is too small at eV and extrapolates to a too-large value at eV, suggesting that a eV provides a reasonable description of the physics.
The upper panel shows the temperature dependence of the spin-resolved mass enhancement of SrRuO3 for the parameters , eV that provide a good description of CaRuO3 , along with the temperature dependence of the calculated magnetic moment. The moment saturates to a value . Experiments report values of the magnetic ranging from to per Ru site Longo et al. (1968); Kanbayasi (1976); Cao et al. (1997), with more recent experiments converging on values between and Bushmeleva et al. (2006); Cheng et al. (2013). DFT calculations Santi and Jarlborg (1997); Singh (1996); Mazin and Singh (1997); Allen et al. (1996); Grånäs et al. (2014) report magnetic moments consistent with experiment. We see that the Hund’s metal picture provides a similarly good level of agreement. The inset reveals that the magnetization has a mean-field-like temperature dependence linear in near the transition; extrapolation to indicates a Curie temperature K slightly higher than the experimental K. Fluctuation effects in a three dimensional magnet typically reduce the transition temperature by relative to the DMFT value (see, e.g. Refs. Calderón and Brey, 1998; Chattopadhyay et al., 2000) so this value also is very reasonable.
At temperatures above the magnetic phase transition the mass enhancement of SrRuO3 is very close to that of CaRuO3 . (The differences discussed above between the paramagnetic phase mass enhancements of the two materials become manifest only at low where the mass enhancement is large and very sensitive to the spin dynamics controlled by and the density of states). As is decreased below we see that the mass enhancement in SrRuO3 becomes spin dependent, taking different values for the majority and minority spin channels. The smaller value of the mass in the minority-spin channel may be understood as a phase space effect. The dominant part of the interaction is between opposite spin species, embodied in the part of the local interaction. Because we are dealing with a greater than half-filled band, the phase space available for a minority spin electron to scatter into a majority spin state is less than the phase space available for a majority-spin electron to scatter into a minority spin state. More importantly, as the amplitude of the magnetic moment increases we see that the increase in mass is cut off, so the concavity of the curve changes and the dependence of the mass saturates below K. This behavior is a natural consequence of the Hund’s metal physics, in which the large mass enhancement arises from slow fluctuations of spontaneously generated local moments whose formation and dynamics is very sensitive to and Werner et al. (2008); Georges et al. (2013). The quenching of these moments in the ordered phase then cuts off the increase of the mass enhancement. The values obtained for the majority-spin mass are in reasonable correspondence with experiment Allen et al. (1996) although the contribution of the minority spin channel to the overall specific heat requires further investigation.
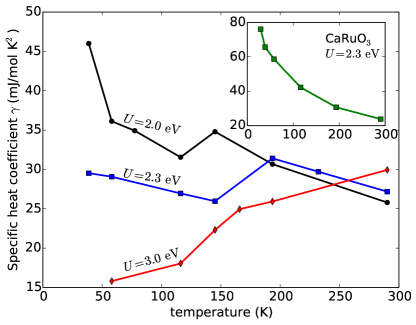
In Fig. 9, we present an estimate for the specific heat coefficient for both materials. We obtain the specific heat by using the quasiparticle approximation in the formula
| (4) |
which is obtained from the quasiparticle approximation to the free energy . Here the spin-dependent quantities and are matrices, accounting for the twelve bands (three for each of the four Ru atoms in the unit cell.) Use of the quasiparticle approximation in Eq. (4) is strictly correct only in the low- Fermi liquid regime, but is expected to be of the correct order of magnitude even at higher temperatures. In the orbital basis that minimizes the hybridization function (see Sec. II), is diagonal in site and orbital indices while the four Ru atoms are equivalent up to a rotation in orbital space. In this case, Eq. (4) simplifies to
| (5) |
where the sum is over spin and the orbitals of one particular Ru atom. Figure 9 is produced using Eq. (5) with and obtained from DMFT.
We see from Fig. 9 that the value eV selected on the basis of the phase diagram and CaRuO3 mass reproduces well the low-T experimental results ( mJ/mol K2 for SrRuO3 and mJ/mol K2 for CaRuO3 Cao et al. (1997); Allen et al. (1996)). Larger (3.0 eV) or smaller (2.0 eV) value of are inconsistent with experiment. Essential in obtaining this level of agreement is obtaining a correct estimate for the magnitude of the saturation moment. A too small moment ( eV) leaves active spin fluctuations which cause a further increase in the mass, while if the moment is too near to saturation ( eV) the is too small.
VI Conclusions
In this work, we have investigated the interplay of electronic correlations and lattice distortions in the perovskite ruthenates SrRuO3 and CaRuO3 using a density functional treatment of the basic electronic states and treating correlations via dynamical mean-field theory with a CT-HYB impurity solver Werner et al. (2006). We determined the behavior of a general class of models motivated by the physics of the ruthenates, finding that ferromagnetism depends on (1) how far materials are from Mott insulating phase and (2) positions of DOS peaks with respect to the Fermi level. The latter factor is more important for small and intermediate correlations, while the former controls the behavior at strong correlation.
Our main results are presented in the phase diagram shown in Fig. 2. The choice of eV value (far from critical value for the Mott insulating phase) and eV gives a calculated mass enhancement for CaRuO3 in reasonable agreement with experiment. The mass enhancement is a sensitive function of the distance of the material from the ferromagnetic phase boundary. Several experimental works propose that very weak disorder may induce spin-glass behavior in CaRuO3 Cao et al. (1997); Felner et al. (2000); Mukuda et al. (1999), suggesting that the material is very close to a magnetic phase boundary, consistent with our results. The same calculations predict that SrRuO3 becomes ferromagnetically ordered below a Curie temperature somewhat less than room temperature. The onset of ferromagnetism cuts off the low- increase of the mass, and the calculated ferromagnetic-state value is found to be much smaller than that of paramagnetic CaRuO3 and also in good agreement with experiment. We therefore concluded that the ruthenates are far from the Mott insulating phase and may be identified as Hund’s metals.
A test of this picture is that the predicted density-of-states for CaRuO3 is typical of a Hund’s metal: it shows only weak signatures of Hubbard bands despite the large renormalizations at low frequency; in contrast, the density of states of a material located near the Mott critical point would exhibit a much larger redistribution of weight away from the Fermi level and would display clear Hubbard sidebands. Closely related to this point is the local susceptibility shown in the inset to Fig. 4 which is very strongly enhanced relative to the band theory value, demonstrating that the large renormalizations come from strongly enhanced local spin fluctuations. A further consequence of the identification of the materials as Hund’s metals is that the reason for the occurrence of ferromagnetism in SrRuO3 and its absence in CaRuO3 is the difference in density of states of the two materials.
Our study has certain limitations. First, it employs the single-site dynamical mean field approximation. While this captures many important aspects of local energetics and material trends, it is not necessarily quantitatively accurate for dimensional materials. In particular, the DMFT theory includes dynamical effects of momentum averaged spin fluctuations but does not include all of the effect of quantum critical spin fluctuations which are important near magnetic transitions Moriya (1985). Spin fluctuations are known to have particularly important consequences in quasi-two-dimensional materials and have been extensively discussed in the context of the two-dimensional ruthenate material Sr2RuO4; their quantitative importance in is less Moriya (1985) but the actual contribution to physical properties, both in the ruthenates, and more generally in the context of DMFT, is an important open question which warrants further research.
Second, we have used the “frontier orbital” approximation in which correlations are applied to the -derived near-Fermi-surface bands. However, the good qualitative and even semiquantitative agreement between our calculations and experiment justifies this approximation a posteriori. Our results thus unambiguously indicate that the perovskite ruthenates are in the Hund’s metal class of materials, with strong correlation effects driven by the rather than the term of the interaction. This finding resolves the tension between the successful DFT account of the magnetism and the thermodynamic, transport and optical results indicating strong correlations.
Third, we have neglected spin-orbit coupling which splits the sixfold degenerate manifold into fourfold and twofold degenerate manifolds and tends to reduce bandwidths, and also can lead to spin anisotropy Koster et al. (2012) and to interesting entanglement effects e.g. on superconducting wave functions Veenstra et al. (2014). If the spin-orbit induced splitting (as renormalized by interactions) is large enough to significantly change the structure of the manifold, for example by fully separating the twofold- and fourfold-degenerate submanifolds, then the basic picture presented here would not apply. On the other hand, if the spin-orbit coupling is not too large, then the tendency of to favor high-spin states in which electrons are more or less equally distributed over orbitals will tend to suppress spin-orbit effects. The crossover as spin-orbit coupling is increased at fixed will have something of the character of a high-spin/low-spin transition and is thus expected to be abrupt. DFT calculations Haverkort et al. (2008) for related material (Sr2RuO4) yield a spin-orbit splitting of at most meV and with no significant alteration of the basic properties of the bands. This, and the fact that calculations of the kind presented here reproduce well the properties of both pseudocubic and layered ruthenates (see Refs. Mravlje et al., 2011; Stricker et al., 2014; Kim and Min, 2015) suggests that in fact spin-orbit coupling does not have a strong effect on the basic electronic properties of the ruthenates. The issue however warrants more thorough investigation.
We conclude by indicating few directions for the future work. Our calculations show an intricate interplay between lattice structure and correlation effects, mediated by the lattice-induced changes in the near-Fermi-surface density of states. Films show a different pattern of rotation and tilt than do bulk materials, and in films the rotation angles may be manipulated by strain. Calculations of the strain dependence of the mass enhancement and magnetic moment in thin films of SrRuO3 and CaRuO3 will be very interesting to perform and compare to experiment Herklotz et al. (2014); Tripathi et al. (2014) and to previous LSDA results Zayak et al. (2006, 2008). Studying theoretically the ruthenates within a wide energy window to include oxygen and bands, which are both close to the frontier bands, is an interesting subject, too. Finally, the formalism and physical picture provided here constitute a potentially useful starting point for investigations of impurity-induced magnetism in CaRuO3.
Acknowledgments
We thank A. Fujimori and H. Wadati for helpful discussions. H.T.D. acknowledges support from the Deutsche Forschungsgemeinschaft (DFG) within projects FOR 1807 and RTG 1995, as well as the allocation of computing time at Jülich Supercomputing Centre and RWTH Aachen University through JARA-HPC. J.M. acknowledges support of Slovenian research agency under program P1-0044. A.G. acknowledges a grant from the European Research Council (ERC-319286 QMAC) and support from the Swiss National Science Foundation (NCCR-MARVEL). A.J.M. acknowledges support from NSF-DMR-1308236.
Appendix A Wannier Fits
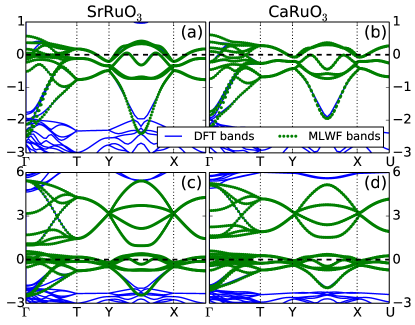
Figure 10 presents the band dispersion obtained from our density functional calculations in several high symmetry directions for SrRuO3 and CaRuO3. The energy window has to be adjusted to capture all the states belong to the subspace. For the -only subspace [Fig. 10(a) and 10(b)], an energy window from to eV is used. For the - subspace [Fig. 10(c) and 10(d)], the energy window ranges from to eV.
The frontier orbitals are seen to be well separated from other bands at higher energy, and as a result the MLWF fits are adequate over most of the relevant energy range. However, at the bottom of the bands, some overlap with the oxygen bands occurs, especially in the case of SrRuO3. The band overlap occurs near the (zone center) point of the Brillouin zone, at which orbital characters are well defined and - hybridization is minimal. We have verified for the density of states projected to atomic orbitals of SrRuO3 (not shown), the Ru character is nonzero until eV, indicating that the Wannier fitting is thus reasonable even in this region of band overlap.
As noted in the main text, if only the manifold is included, the Wannier functions produced by the wannier90 code Mostofi et al. (2008) are aligned with the local octahedral axes and the DMFT hybridization function can be constructed directly from the projection of the Kohn-Sham Hamiltonian onto the Wannier basis. If however all five orbitals are included (as in our magnetic calculations) the orbitals produced by the the wannier90 code are not properly aligned to the local symmetry axes, and must be rotated, in order to minimize the off-diagonal terms in the DMFT hybridization functions. We find that the desired rotation is the one that diagonalizes the site-local terms in the projection of the Kohn-Sham Hamiltonian onto the Wannier basis.
Our convention for the orbitals whose self-energy is shown in Fig. 5 is as follows. The structure has three lattice vectors conventionally denoted , and . The orbitals are labeled in terms of pseudocubic , , directions defined as those closest to
| (6) | |||||
| (7) | |||||
| (8) |
and Fig. 5 presents the diagonal components of the self-energy for the Ru ion at position in the system defined by the , , and lattice vectors
Appendix B Criteria for determining the electronic phases and phase boundaries
B.1 Ferromagnetic-paramagnetic phase boundary
To locate the ferromagnetic-paramagnetic phase boundary we follow our previous work Dang and Millis (2013) and compute the inverse magnetic susceptibility as with the calculated magnetization and an applied field chosen to be small enough that the curve is linear (typically eV, but can be smaller at low temperatures). We perform the calculation at several temperatures, fit the result to a straight line and determine the phase according to whether the extrapolation is positive or negative.
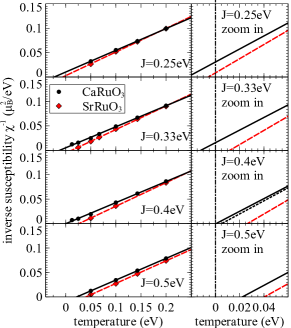
For each point on the - phase diagram, we use at least four different temperatures, typically and eV, to determine the Curie temperature (for some points close to the phase boundary, we go to lower temperatures). Within the magnetic phase the inverse susceptibility is typically linear in this range of temperature, thus is easily obtained. The phase boundary is then specified by linear interpolation between the points of lowest positive and largest negative .
Figure 11 demonstrates the approach presenting for different values at a fixed eV. We see clearly that SrRuO3 has a greater tendency to ferromagnetism than CaRuO3 , with the difference being more pronounced at higher . We note, however, within the paramagnetic phase or in the magnetic phase very close to the phase boundary, starts to bend away from the high- linear extrapolation at low temperature, as can be seen from a close examination of the for CaRuO3 for and eV. For these data we have pushed the CaRuO3 calculation to the lower temperatures and eV. The bending away from the Curie-Weiss curve is a signature of the onset of Fermi-liquid coherence and leads to uncertainty in specifying the magnetic phase boundary. For example, at eV, the linear extrapolation gives eV if the points at and eV are included (solid line), but if these two temperatures are excluded (as in most of our calculations for building the phase diagram), we would obtain eV (the dotted line in “zoom in” panel of Fig. 11). Therefore we expect the error bar for of about eV. Our - phase boundary contains similar uncertainties, but determining the precise error bars requires heavy calculations to go to ultra-low temperatures. The uncertainties arising from the onset of coherence do not affect the qualitative conclusions of this paper.
B.2 Metal-insulator phase boundary
We define whether the material is insulating or metallic according to whether or not the electron spectral function (many body density of states) vanishes at the Fermi level as . We determine from the imaginary part of the measured Matsubara Green’s function such that when . In practice, we observe at several lowest Matsubara frequencies: if it bends towards zero, the state is insulator, whereas it goes away from zero, it is metallic. By fixing and gradually increasing , the critical value is determined if the bending changes at low frequencies. (See Dang et al. (2015) for details).
In single-site dynamical mean-field theory, the metal-insulator phase boundary has a complicated structure at low , with a line of first order transitions emerging and there is second order transition at interaction values and terminating at a critical endpoint , with typically , there exists a temperature where . Above this temperature there is only a crossover from metallic to insulating state Georges et al. (1996). We start all of our calculations from a metallic initial condition and the true metal-insulator transition is at a slightly lower temperature than the we find, and the we determine is closer to than .
References
- Mott (1949) N. F. Mott, Proc. Phys. Soc. A 62, 416 (1949).
- Imada et al. (1998) M. Imada, A. Fujimori, and Y. Tokura, Rev. Mod. Phys. 70, 1039 (1998).
- Zaanen et al. (1985) J. Zaanen, G. A. Sawatzky, and J. W. Allen, Phys. Rev. Lett. 55, 418 (1985).
- Fujimori (1992) A. Fujimori, J. Phys. Chem. Solids 53, 1595 (1992).
- Mizokawa et al. (2000) T. Mizokawa, D. I. Khomskii, and G. A. Sawatzky, Phys. Rev. B 61, 11263 (2000).
- Park et al. (2012) H. Park, A. J. Millis, and C. A. Marianetti, Phys. Rev. Lett. 109, 156402 (2012).
- Johnston et al. (2014) S. Johnston, A. Mukherjee, I. Elfimov, M. Berciu, and G. A. Sawatzky, Phys. Rev. Lett. 112, 106404 (2014).
- Subedi et al. (2015) A. Subedi, O. E. Peil, and A. Georges, Phys. Rev. B 91, 075128 (2015).
- Inoue et al. (1998) I. H. Inoue, O. Goto, H. Makino, N. E. Hussey, and M. Ishikawa, Phys. Rev. B 58, 4372 (1998).
- Inoue et al. (1995) I. H. Inoue, I. Hase, Y. Aiura, A. Fujimori, Y. Haruyama, T. Maruyama, and Y. Nishihara, Phys. Rev. Lett. 74, 2539 (1995).
- Makino et al. (1998) H. Makino, I. H. Inoue, M. J. Rozenberg, I. Hase, Y. Aiura, and S. Onari, Phys. Rev. B 58, 4384 (1998).
- Arima et al. (1993) T. Arima, Y. Tokura, and J. B. Torrance, Phys. Rev. B 48, 17006 (1993).
- Pavarini et al. (2004) E. Pavarini, S. Biermann, A. Poteryaev, A. I. Lichtenstein, A. Georges, and O. K. Andersen, Phys. Rev. Lett. 92, 176403 (2004).
- Werner et al. (2009) P. Werner, E. Gull, and A. J. Millis, Phys. Rev. B 79, 115119 (2009).
- Dang et al. (2014a) H. T. Dang, A. J. Millis, and C. A. Marianetti, Phys. Rev. B 89, 161113 (2014a).
- Dang et al. (2014b) H. T. Dang, X. Ai, A. J. Millis, and C. A. Marianetti, Phys. Rev. B 90, 125114 (2014b).
- Löhneysen et al. (2007) H. Löhneysen, A. Rosch, M. Vojta, and P. Wölfle, Rev. Mod. Phys. 79, 1015 (2007).
- Haule and Kotliar (2009) K. Haule and G. Kotliar, New Journal of Physics 11, 025021 (2009).
- Werner et al. (2008) P. Werner, E. Gull, M. Troyer, and A. J. Millis, Phys. Rev. Lett. 101, 166405 (2008).
- Mravlje et al. (2011) J. Mravlje, M. Aichhorn, T. Miyake, K. Haule, G. Kotliar, and A. Georges, Phys. Rev. Lett. 106, 096401 (2011).
- de’ Medici et al. (2011) L. de’ Medici, J. Mravlje, and A. Georges, Phys. Rev. Lett. 107, 256401 (2011).
- Yin et al. (2011) Z. P. Yin, K. Haule, and G. Kotliar, Nature Materials 10, 932 (2011).
- Georges et al. (2013) A. Georges, L. d. Medici, and J. Mravlje, Annual Review of Condensed Matter Physics 4, 137 (2013).
- Bergemann et al. (2003) C. Bergemann, A. P. Mackenzie, S. R. Julian, D. Forsythe, and E. Ohmichi, Advances in Physics 52, 639 (2003).
- Chubukov and Millis (2006) A. V. Chubukov and A. J. Millis, Phys. Rev. B 74, 115119 (2006).
- Mackenzie and Maeno (2003) A. P. Mackenzie and Y. Maeno, Rev. Mod. Phys. 75, 657 (2003).
- Grigera et al. (2001) S. A. Grigera, R. S. Perry, A. J. Schofield, M. Chiao, S. R. Julian, G. G. Lonzarich, S. I. Ikeda, Y. Maeno, A. J. Millis, and A. P. Mackenzie, Science 294, 329 (2001).
- Gorelov et al. (2010) E. Gorelov, M. Karolak, T. O. Wehling, F. Lechermann, A. I. Lichtenstein, and E. Pavarini, Phys. Rev. Lett. 104, 226401 (2010).
- Bibes et al. (1999) M. Bibes, B. Martínez, J. Fontcuberta, V. Trtik, F. Benitez, C. Ferrater, F. Sánchez, and M. Varela, Phys. Rev. B 60, 9579 (1999).
- Hikita et al. (2007) Y. Hikita, Y. Kozuka, T. Susaki, H. Takagi, and H. Y. Hwang, Applied Physics Letters 90, 143507 (2007).
- He et al. (2011) C. He, X. Zhai, V. V. Mehta, F. J. Wong, and Y. Suzuki, Journal of Applied Physics 109, 07D729 (2011).
- Koster et al. (2012) G. Koster, L. Klein, W. Siemons, G. Rijnders, J. Dodge, C.-B. Eom, D. Blank, and M. Beasley, Rev. Mod. Phys. 84, 253 (2012).
- Kostic et al. (1998) P. Kostic, Y. Okada, N. C. Collins, Z. Schlesinger, J. W. Reiner, L. Klein, A. Kapitulnik, T. H. Geballe, and M. R. Beasley, Phys. Rev. Lett. 81, 2498 (1998).
- Lee et al. (2002) Y. S. Lee, J. Yu, J. S. Lee, T. W. Noh, T.-H. Gimm, H.-Y. Choi, and C. B. Eom, Phys. Rev. B 66, 041104 (2002).
- Maiti and Singh (2005) K. Maiti and R. S. Singh, Phys. Rev. B 71, 161102 (2005).
- Fujioka et al. (1997) K. Fujioka, J. Okamoto, T. Mizokawa, A. Fujimori, I. Hase, M. Abbate, H. J. Lin, C. T. Chen, Y. Takeda, and M. Takano, Phys. Rev. B 56, 6380 (1997).
- Kim et al. (2005) J. Kim, J. Chung, and S.-J. Oh, Phys. Rev. B 71, 121406 (2005).
- Dodge et al. (2000) J. S. Dodge, C. P. Weber, J. Corson, J. Orenstein, Z. Schlesinger, J. W. Reiner, and M. R. Beasley, Phys. Rev. Lett. 85, 4932 (2000).
- Schneider et al. (2014) M. Schneider, D. Geiger, S. Esser, U. S. Pracht, C. Stingl, Y. Tokiwa, V. Moshnyaga, I. Sheikin, J. Mravlje, M. Scheffler, and P. Gegenwart, Phys. Rev. Lett. 112, 206403 (2014).
- Capogna et al. (2002) L. Capogna, A. P. Mackenzie, R. S. Perry, S. A. Grigera, L. M. Galvin, P. Raychaudhuri, A. J. Schofield, C. S. Alexander, G. Cao, S. R. Julian, and Y. Maeno, Phys. Rev. Lett. 88, 076602 (2002).
- Singh (1996) D. J. Singh, Journal of Applied Physics 79, 4818 (1996).
- Mazin and Singh (1997) I. I. Mazin and D. J. Singh, Phys. Rev. B 56, 2556 (1997).
- Etz et al. (2012) C. Etz, I. V. Maznichenko, D. Böttcher, J. Henk, A. N. Yaresko, W. Hergert, I. I. Mazin, I. Mertig, and A. Ernst, Phys. Rev. B 86, 064441 (2012).
- Zayak et al. (2006) A. T. Zayak, X. Huang, J. B. Neaton, and K. M. Rabe, Phys. Rev. B 74, 094104 (2006).
- Zayak et al. (2008) A. T. Zayak, X. Huang, J. B. Neaton, and K. M. Rabe, Phys. Rev. B 77, 214410 (2008).
- Tripathi et al. (2014) S. Tripathi, R. Rana, S. Kumar, P. Pandey, R. S. Singh, and D. S. Rana, Sci. Rep. 4, 3877 (2014).
- Rondinelli et al. (2008) J. M. Rondinelli, N. M. Caffrey, S. Sanvito, and N. A. Spaldin, Phys. Rev. B 78, 155107 (2008).
- Laad et al. (2008) M. S. Laad, I. Bradarić, and F. V. Kusmartsev, Phys. Rev. Lett. 100, 096402 (2008).
- Jakobi et al. (2011) E. Jakobi, S. Kanungo, S. Sarkar, S. Schmitt, and T. Saha-Dasgupta, Phys. Rev. B 83, 041103 (2011).
- Huang and Ao (2013) L. Huang and B. Ao, Phys. Rev. B 87, 165139 (2013).
- Grånäs et al. (2014) O. Grånäs, I. Di Marco, O. Eriksson, L. Nordström, and C. Etz, Phys. Rev. B 90, 165130 (2014).
- Jones et al. (1989) C. W. Jones, P. D. Battle, P. Lightfoot, and W. T. A. Harrison, Acta Crystallographica Section C 45, 365 (1989).
- Bensch et al. (1990) W. Bensch, H. W. Schmalle, and A. Reller, Solid State Ionics 43, 171 (1990).
- Giannozzi et al. (2009) P. Giannozzi, S. Baroni, N. Bonini, M. Calandra, R. Car, C. Cavazzoni, D. Ceresoli, G. L. Chiarotti, M. Cococcioni, I. Dabo, A. Dal Corso, S. de Gironcoli, S. Fabris, G. Fratesi, R. Gebauer, U. Gerstmann, C. Gougoussis, A. Kokalj, M. Lazzeri, L. Martin-Samos, N. Marzari, F. Mauri, R. Mazzarello, S. Paolini, A. Pasquarello, L. Paulatto, C. Sbraccia, S. Scandolo, G. Sclauzero, A. P. Seitsonen, A. Smogunov, P. Umari, and R. M. Wentzcovitch, Journal of Physics: Condensed Matter 21, 395502 (19pp) (2009), http://www.quantum-espresso.org.
- (55) We used the pseudopotentials Sr.pbe-nsp-van.UPF, Ca.pbe-nsp-van.UPF, Ru.pbe-n-van.UPF and O.pbe-rrkjus.UPF from www.quantum-espresso.org.
- Marzari and Vanderbilt (1997) N. Marzari and D. Vanderbilt, Phys. Rev. B 56, 12847 (1997).
- Souza et al. (2001) I. Souza, N. Marzari, and D. Vanderbilt, Phys. Rev. B 65, 035109 (2001).
- Mostofi et al. (2008) A. A. Mostofi, J. R. Yates, Y.-S. Lee, I. Souza, D. Vanderbilt, and N. Marzari, Computer Physics Communications 178, 685 (2008).
- Held (2007) K. Held, Advances in Physics 56, 829 (2007).
- Pchelkina et al. (2007) Z. V. Pchelkina, I. A. Nekrasov, T. Pruschke, A. Sekiyama, S. Suga, V. I. Anisimov, and D. Vollhardt, Phys. Rev. B 75, 035122 (2007).
- Vaugier et al. (2012) L. Vaugier, H. Jiang, and S. Biermann, Phys. Rev. B 86, 165105 (2012).
- Georges et al. (1996) A. Georges, G. Kotliar, W. Krauth, and M. J. Rozenberg, Rev. Mod. Phys. 68, 13 (1996).
- Werner et al. (2006) P. Werner, A. Comanac, L. de’ Medici, M. Troyer, and A. J. Millis, Phys. Rev. Lett. 97, 076405 (2006).
- Parcollet et al. (2015) O. Parcollet, M. Ferrero, T. Ayral, H. Hafermann, I. Krivenko, L. Messio, and P. Seth, (2015), arXiv:1504.01952 [cond-mat.str-el] .
- Parragh et al. (2012) N. Parragh, A. Toschi, K. Held, and G. Sangiovanni, Phys. Rev. B 86, 155158 (2012).
- Gull et al. (2011) E. Gull, A. J. Millis, A. I. Lichtenstein, A. N. Rubtsov, M. Troyer, and P. Werner, Rev. Mod. Phys. 83, 349 (2011).
- Dang and Millis (2013) H. T. Dang and A. J. Millis, Phys. Rev. B 87, 155127 (2013).
- Stoner (1927) E. C. Stoner, Philosophical Magazine Series 7 3, 336 (1927).
- Allen et al. (1996) P. B. Allen, H. Berger, O. Chauvet, L. Forro, T. Jarlborg, A. Junod, B. Revaz, and G. Santi, Phys. Rev. B 53, 4393 (1996).
- Vollhardt et al. (1996) D. Vollhardt, N. Blümer, K. Held, M. Kollar, J. Schlipf, and M. Ulmke, Zeitschrift für Physik B Condensed Matter 103, 283 (1996).
- Ulmke (1998) M. Ulmke, Eur. Phys. J. B 1, 301 (1998).
- Wahle et al. (1998) J. Wahle, N. Blümer, J. Schlipf, K. Held, and D. Vollhardt, Phys. Rev. B 58, 12749 (1998).
- Held and Vollhardt (1998) K. Held and D. Vollhardt, Eur. Phys. J. B 5, 473 (1998).
- Chan et al. (2009) C.-K. Chan, P. Werner, and A. J. Millis, Phys. Rev. B 80, 235114 (2009).
- Xu et al. (2013) W. Xu, K. Haule, and G. Kotliar, Phys. Rev. Lett. 111, 036401 (2013).
- Deng et al. (2014) X. Deng, A. Sternbach, K. Haule, D. N. Basov, and G. Kotliar, Phys. Rev. Lett. 113, 246404 (2014).
- Cao et al. (1997) G. Cao, S. McCall, M. Shepard, J. E. Crow, and R. P. Guertin, Phys. Rev. B 56, 321 (1997).
- Nekrasov et al. (2005) I. A. Nekrasov, G. Keller, D. E. Kondakov, A. V. Kozhevnikov, T. Pruschke, K. Held, D. Vollhardt, and V. I. Anisimov, Phys. Rev. B 72, 155106 (2005).
- Jarrell and Gubernatis (1996) M. Jarrell and J. Gubernatis, Physics Reports 269, 133 (1996).
- Comanac (2007) A. Comanac, Dynamical mean-field theory of correlated electron systems: New algorithms and applications to local observables, Ph.D. thesis, Columbia University (2007).
- Wang et al. (2009) X. Wang, E. Gull, L. de’ Medici, M. Capone, and A. J. Millis, Physical Review B (Condensed Matter and Materials Physics) 80, 045101 (2009).
- Stricker et al. (2014) D. Stricker, J. Mravlje, C. Berthod, R. Fittipaldi, A. Vecchione, A. Georges, and D. van der Marel, Phys. Rev. Lett. 113, 087404 (2014).
- Wadati et al. (2014) H. Wadati, J. Mravlje, K. Yoshimatsu, H. Kumigashira, M. Oshima, T. Sugiyama, E. Ikenaga, A. Fujimori, A. Georges, A. Radetinac, K. S. Takahashi, M. Kawasaki, and Y. Tokura, Phys. Rev. B 90, 205131 (2014).
- Kim and Min (2015) M. Kim and B. I. Min, Phys. Rev. B 91, 205116 (2015).
- Longo et al. (1968) J. M. Longo, P. M. Raccah, and J. B. Goodenough, Journal of Applied Physics 39, 1327 (1968).
- Kanbayasi (1976) A. Kanbayasi, Journal of the Physical Society of Japan 41, 1876 (1976).
- Bushmeleva et al. (2006) S. Bushmeleva, V. Pomjakushin, E. Pomjakushina, D. Sheptyakov, and A. Balagurov, Journal of Magnetism and Magnetic Materials 305, 491 (2006).
- Cheng et al. (2013) J.-G. Cheng, J.-S. Zhou, and J. B. Goodenough, Proceedings of the National Academy of Sciences 110, 13312 (2013).
- Santi and Jarlborg (1997) G. Santi and T. Jarlborg, Journal of Physics: Condensed Matter 9, 9563 (1997).
- Calderón and Brey (1998) M. J. Calderón and L. Brey, Phys. Rev. B 58, 3286 (1998).
- Chattopadhyay et al. (2000) A. Chattopadhyay, A. J. Millis, and S. Das Sarma, Phys. Rev. B 61, 10738 (2000).
- Felner et al. (2000) I. Felner, I. Nowik, I. Bradaric, and M. Gospodinov, Phys. Rev. B 62, 11332 (2000).
- Mukuda et al. (1999) H. Mukuda, K. Ishida, Y. Kitaoka, K. Asayama, R. Kanno, and M. Takano, Phys. Rev. B 60, 12279 (1999).
- Moriya (1985) T. Moriya, Spin Fluctuations in Itinerant Electron Magnetism (Springer Series in Solid State Sciences, 1985).
- Veenstra et al. (2014) C. N. Veenstra, Z.-H. Zhu, M. Raichle, B. M. Ludbrook, A. Nicolaou, B. Slomski, G. Landolt, S. Kittaka, Y. Maeno, J. H. Dil, I. S. Elfimov, M. W. Haverkort, and A. Damascelli, Phys. Rev. Lett. 112, 127002 (2014).
- Haverkort et al. (2008) M. W. Haverkort, I. S. Elfimov, L. H. Tjeng, G. A. Sawatzky, and A. Damascelli, Phys. Rev. Lett. 101, 026406 (2008).
- Herklotz et al. (2014) A. Herklotz, M. D. Biegalski, H. M. Christen, E.-J. Guo, K. Nenkov, A. D. Rata, L. Schultz, and K. Dörr, Phil. Trans. R. Soc. A 372, 20120441 (2014).
- Dang et al. (2015) H. T. Dang, X. Y. Xu, K.-S. Chen, Z. Y. Meng, and S. Wessel, Phys. Rev. B 91, 155101 (2015).