Magnetic dichroism study on Mn1.8Co1.2Ga thin film using a combination of X-ray absorption and photoemission spectroscopy
Abstract
Using circularly polarised radiation and a combination of bulk-sensitive hard X-ray photoelectron spectroscopy and X-ray-absorption spectroscopy (XAS) we studied the electronic and magnetic structure of epitaxial Mn1.8Co1.2Ga thin films. Spin resolved Bloch spectral functions, density of states as well as charge and magnetisation densities were investigated by a first-principles analysis of full potential, fully relativistic Korringa–Kohn–Rostoker calculations of the electronic structure. The valence states were experimentally investigated by using linear dichroism in the angular distribution and comparing the results to spin-resolved densities of states. The linear dichroism in the valence band enabled a symmetry analysis of the contributing states. The spectra were in good agreement with the theoretical partial density of states. The element-specific, spin-resolved, unoccupied densities of states for Co and Mn were analysed by using XAS and X-ray magnetic circular dichroism (XMCD) at the edges. The spectra were influenced by strong correlation effects. XMCD was used to extract the site resolved magnetic moments. The experimental values of and agree very well with the calculated magnetic moments. Magnetic circular dichroism in angle-resolved photoelectron spectroscopy at the Mn and Co core level exhibited a pronounced magnetic dichroism and confirmed the localised character of the Mn valence states.
pacs:
79.60.i, 79.60.Jv, 85.75.d, 73.50.-hKeywords: Heusler thin films, Photoelectron spectroscopy, X-ray absorption spectroscopy, Magnetic circular dichroism, Localised magnetic moment, Electronic structure
1 Introduction
Beyond conventional perpendicular magnetic anisotropy (PMA) materials, tetragonal Mn-based Heusler alloys have recently opened up a new way to develop materials with high anisotropy [1, 2]. Mn3Ga has been proposed as a compensated ferrimagnet having a high spin polarisation of 88%, hard magnetic properties, and a high Curie temperature (730 K) [3, 4]. Epitaxial growth of Mn–Ga thin films with high PMA [5, 2] and multilayer devices with high tunnelling magnetoresistance (TMR) [6, 7, 8, 9] have been realised.
Recently, it was shown that partial substitution of Mn by Co in Mn3-xCoxGa changes the crystal structure from tetragonal to cubic when the Co content is increased, leading to a reduction of the saturation magnetisation [10, 11, 12]. Kubota et al. [13] investigated the composition dependence of the structural, magnetic, and transport properties of epitaxially grown Mn–Co–Ga films. The resistivity of the Mn–Co–Ga films was larger than that of pure Mn–Ga films. The Co substitution results in a reduced electron mobility because of the presence of localised electron states around the Fermi energy (intrinsic factor). Investigation of the TMR in Mn–Co–Ga/MgO/CoFeB magnetic tunnel junctions (MTJs) revealed lower TMR values (%) compared to Mn–Ga MTJs [14]. For other Heusler-based MTJ systems, the Mn content strongly influences the TMR ratio, with a record TMR ratio of 1995% being obtained for off-stoichiometric Co2MnSi Heusler-based MTJs [15]. It was predicted by first-principle calculations that spin-transport in the Mn–Ga system may be improved by chemical disorder introduced by a partial substitution of Mn by a element [16]. Realising this idea requires a detailed investigation of the electronic and magnetic structure of the Mn–Co–Ga system.
Hard X-ray photoemission spectroscopy (HAXPES) is a powerful tool for investigation of the chemical states and electronic structure of various materials [17, 18] for example multilayers [19, 20, 21, 22], strongly correlated oxides [23], or magnetic materials especially in combination with variable photon polarisation [24, 25, 26, 27]. X-ray magnetic circular dichroism (XMCD) in X-ray absorption spectroscopy (XAS) is an efficient method for studying the element-specific electronic structure of buried layers [28] using hard ( edges of materials) [29] as well as soft X-rays ( edges of materials) [30] for excitation. The -edge absorption spectra for left and right circularly polarised X-rays reflect the spin-resolved partial density of states (PDOS).
The present study reports on a detailed investigation of the electronic and magnetic structure of epitaxial Mn1.8Co1.2Ga thin films. Spin-resolved densities of states are calculated based on a first-principles analysis with fully relativistic Korringa–Kohn–Rostoker calculations and the results are compared to experiment. Linearly polarised radiation in combination with bulk-sensitive HAXPES is used to study the symmetry of the valence states. Magnetic circular dichroism (MCD) of the core states is used to explore the film’s magnetic properties. Element-specific magnetic moments are investigated by circular dichroism in XAS.
2 Experimental details
Epitaxial, 30-nm-thick thin films with nominal compositions of
Mn1.8Co1.2Ga were grown on a MgO(001) single crystalline substrate
using an ultrahigh vacuum magnetron sputtering system. A Mn–Ga target and an
elemental Co target were used for co-deposition. Thin MgO and Al layers were
deposited on top of the films to prevent their oxidation. The samples had the
following stacking order:
MgO(100) substrate / Mn1.8Co1.2Ga(30 nm) / MgO(2 nm) / Al(2 nm).
Additional details about the film growth were previously reported in
References [12, 13]. The composition of the film – as determined by
inductively coupled plasma mass spectroscopy (ICP-MS) – was
Mn : Co : Ga = 1.8 : 1.2 : 1. The nominally cubic
structure has a very small tetragonal distortion in the films. The lattice
parameters are Å and Å [13]. The compound
has 26.4 valence electrons in the primitive cell and should exhibit a
ferrimagnetic character with a total magnetic moment of 2.4 according to
the Slater–Pauling rule. The magnetic moment as measured at room temperature by
a vibrating sample magnetometer amounts to 2.57 and is slightly higher
than the expected Slater–Pauling value. The deviation between experimental and
theoretical value may be caused by the uncertainty in the mass density of the
film.
The HAXPES experiment with an excitation energy of 7.940 keV was performed at beamline BL47XU [31, 32] of SPring-8. The energy distribution of the photoemitted electrons was analysed by using a hemispherical analyser (VG-Scienta R4000-12kV) with an overall energy resolution of 150 or 250 meV. The angle between the electron spectrometer and the photon propagation was fixed at . The detection angle was set to to reach the near-normal emission geometry and to ensure that the polarisation vector of the circularly polarised photons is nearly parallel () (antiparallel for ) to the magnetisation (see Figure 1a). The thin films were magnetised ex situ along the direction of the photon beam (parallel to the surface plane) before being introduced into the UHV chamber. The polarisation of the incident photons was varied by using an in-vacuum phase retarder based on a 600-m-thick diamond crystal with (220) orientation [33]. The direct beam was linearly polarised with . By using the phase retarder, the degree of circular polarisation was set to .
The XAS and XMCD investigations were performed with the magnetic circular dichroism measurement system at beamline BL25SU [34] of SPring-8. The helicity switching of the circularly polarised radiation was performed by twin helical undulators. The absorption signal was measured in the total electron yield mode with the energy resolution set to . The samples were magnetised in an induction field of T by a water-cooled-type electromagnet. A sketch of the experimental geometry for both measurements – HAXPES and XAS – is shown in Figure 1.
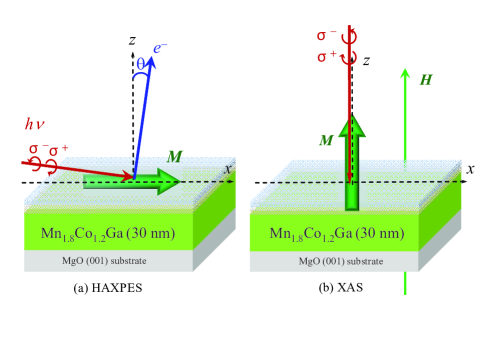
(a) HAXPES: remanently magnetised,
(b) XAS: magnetised by external field .
3 Calculation details
The electronic structure calculations for the Mn1.8Co1.2Ga alloy with random site occupation were performed by means of the full-potential, fully relativistic spin-polarised Korringa–Kohn–Rostoker (SPR-KKR) method [35] in combination with the coherent potential approximation (CPA) [36, 37]. The experimental lattice parameters were used because of the strain induced in the thin film. No remarkable differences in the results were observed when using the averaged cubic lattice parameter ( Å) or the structure with slight tetragonal distortion (see Section 2). The exchange-correlation functional was taken within the generalised gradient approximation (GGA) in the parametrisation of Perdew–Burke–Enzerhof (PBE) [38]. A -based point mesh was used for integration in space; this mesh resulted in 1469 points in the irreducible wedge of the Brillouin zone.
The non-integer 1.8 : 1.2 : 1 stoichiometry results in non-integer site occupations where some Co and Mn atoms are placed randomly in the position of the regular lattice. This needs a special treatment in the calculations. The method used here to describe the random occupation of sites is the coherent potential approximation [36, 37]. The CPA can be easily performed within the Korringa–Kohn–Rostoker Green’s function method. In the CPA, the random array of real on-site potentials is replaced by an ordered array of effective potentials and thus it describes the behaviour of an atom in a mean-field environment. The CPA is suited for any site occupation of Mn2-xCo1+xGa. Site resolved quantities – that are partial density of states, values of the magnetic moments, or numbers of electrons – have been calculated in a Wigner–Seitz cell around each site. It was assumed that all Wigner–Seitz cells have the same size. The total magnetic moment and number of valence electrons were calculated for the complete primitive cell.
The site occupation by the atoms of Mn1.8Co1.2Ga is shown in Figure 2. The symmetry of the lattice belongs to space group (216). Ga occupies the Wyckoff position . Mn4b is placed at and Co4c at . The Wyckoff position is occupied randomly by 80% Mn4d and 20% Co4d. The directions of the local magnetic moments are indicated by arrows.
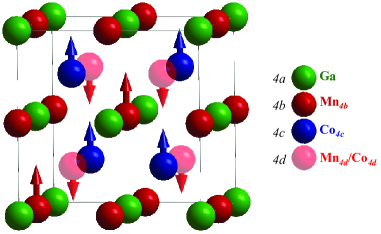
The Wyckoff positions , , and are completely occupied by Ga, Mn, and Co, respectively. contains a mixture of 80% Mn and 20% Co. It is seen that the centre Mn atom in the position is octahedrally coordinated with respect to Ga in . The Co atom in or the Mn and Co atoms in are tetrahedrally coordinated with respect to Ga.
Photoabsorption and XMCD spectra have been calculated using both many-electron and single-electron approaches. The single-particle calculations are based on the results of the electronic structure from the full-potential, fully relativistic spin-polarised KKR calculations. The core-levels themselves are strongly localized in the spherical part of the potential around the nuclei and behave like atomic states. Many electron effects are expected to appear in particular for the Mn atoms with localized electrons in the open shell. Therefore, atomic-type many-particle calculations were performed to explain some details of the Mn states in the photon absorption. The multiplet calculations were performed using de Groot’s program ctm4xas [39]. This program includes also the effects of crystal fields and charge transfer. The details of the applied method are given in References [40, 41, 42]. For the calculation of the excitation, the Slater integrals were scaled to 90% of their value from the Hartree–Fock calculations. The crystal field parameter was set to meV and a magnetisation energy of meV was used for the calculation of the magnetic dichroism. The spectra were broadened by 200 to 600 meV according to the experimental resolution and lifetime broadening, with larger values used for the ”” parts of the spectra to account for Coster-Kronig contributions.
4 Results and discussion
4.1 Electronic structure
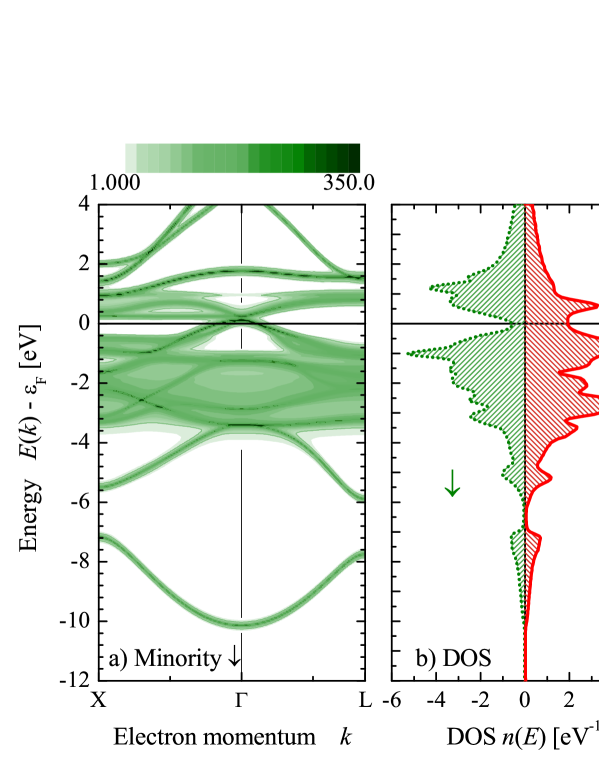
Figure 3 shows the Bloch spectral functions for majority (a) and minority (b) spin electrons together with the accompanying density of states (DOS) (b). The minority channel exhibits a crossing point at close to the Fermi energy , which results in a low density of states. The broadening of the majority band dispersion, as is seen from the Bloch spectral function (Figure 3c), is caused by the chemical disorder. This broadening reduces the number of majority electrons at . The broadening results in a low effective spin polarisation at the Fermi energy. This explains the rather low TMR values reported for the Mn3-xCoxGa system [14].
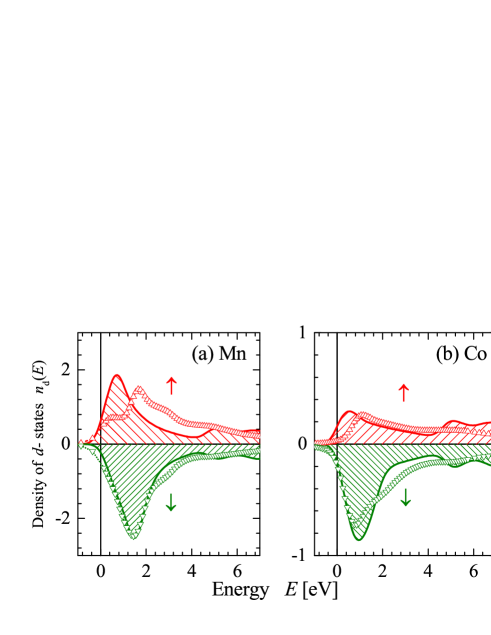
It is well known for the Heusler structure that octahedrally, main group element (here Ga) coordinated manganese atom – in this case Mn4b – exhibit highly localised electrons. To investigate the element-specific properties of Mn and Co in detail, the spin-resolved partial densities of states of Co and Mn at different sites in Mn1.8Co1.2Ga were calculated and are shown in Figure 4.
The contribution of the Co4d states (shaded area in Figure 4a) to the DOS is weak because Co occupies only 20% of the Wyckoff position . The rather uniform distribution over the whole energy range of states indicates the delocalised character of the electrons in both spin channels. The Mn4d states exhibit also a nearly uniform distribution over the occupied valence bands in both spin channels. Only the unoccupied states of the minority conduction band exhibit a clear maximum at 0.6 eV above . The minority valence band consists mainly of Co4c states, and the majority states of Co4c are smoothly distributed over the entire valence band. The case of the Mn4b states is different: They exhibit a pronounced localisation of the valence electrons in the majority channel, resulting in sharp, peaked maxima at and eV. At the same time, the localisation results in the peaked DOS at 1.2 eV in the minority conducting band. The localised Mn states generate a peculiar exchange splitting between the occupied and unoccupied states of up to 4 eV. The Bloch spectral functions shown in Figure 3 reveal that the localized Mn states are less affected by the chemical disorder scattering. Using X-ray absorption or photoemission spectroscopy allows the described behaviour of the valence states to be explored by investigating the interaction of core holes and valence electrons.
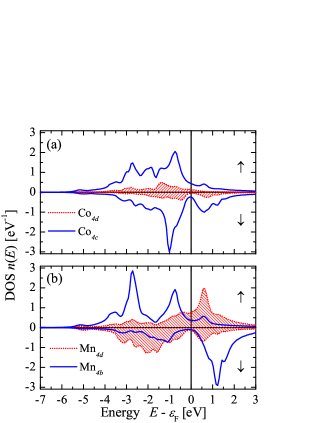
Figure 5 shows the real space distribution of the charge and magnetisation densities in different planes of the cubic structure. The values at Wyckoff position are averaged over the Mn and Co contributions in the mean field sense. Therefore, they are assigned in the Figures by mix. The charge densities ((a)…(c)) are total densities and calculated from the majority () and minority () spin densities including all core levels: . The magnetisation densities are calculated as difference of the spin densities: .
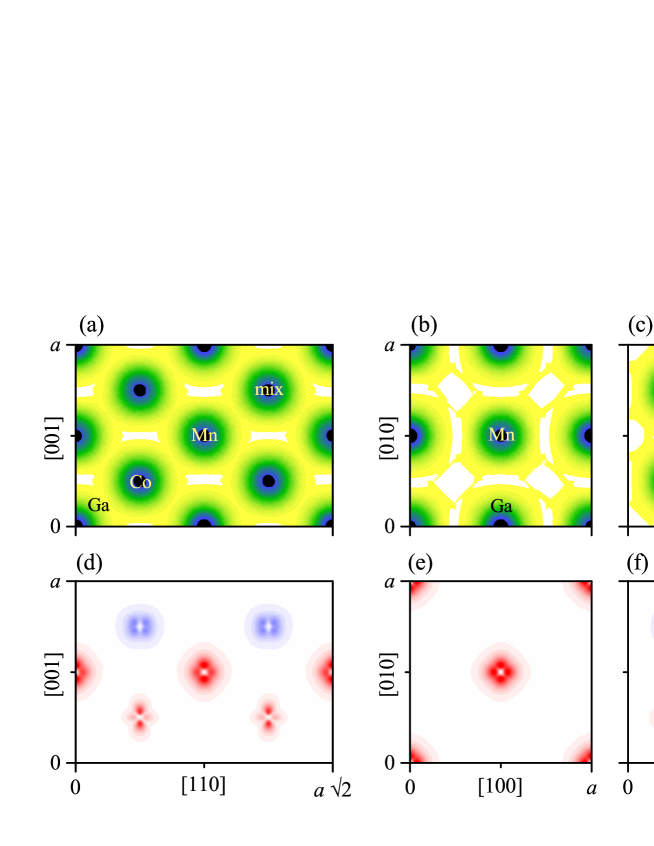
(a)…(c) are the charge densities () and (d)…(f) the magnetisation densities (). The values are given in atomic units as assigned by the colour (grey) scales. (a) and (d) are drawn in the (110) plane. The remaining densities are drawn in -type planes with different origins: in (b), (e) and in (c), (f).
As mentioned above, the charge and magnetisation densities in the Wigner–Seitz cell around the position are averaged over the occupation by Co and Mn atoms. In reality, however, there will be either a Co or a Mn atom in the position but not both at once. Figure 6 illustrates for the magnetisation density the situation where only one of the atom types occupies and compares it to the average as was shown in Figure 4(f). As expected, at is dominated by the part arising from the Mn atom that has its magnetic moment oriented with opposite sign to the total magnetic moment. The atom resolved magnetisation density reveals that the moment of Co in is oriented parallel to the total magnetic moment. The magnetisation density of the Co atom in has the same shape as that in . This behaviour is expected because such a occupation results in the regular Heusler structure with symmetry. Overall, the magnetisation densities of both types of Co atoms as well as of Mn in are aligned along directions to the second nearest neighbours. Other than the Mn atom in that has only transition metals as nearest neighbours, the Mn in exhibits a magnetisation density that is aligned in the direction of the nearest neighbour atoms that are either Mn or Ga.
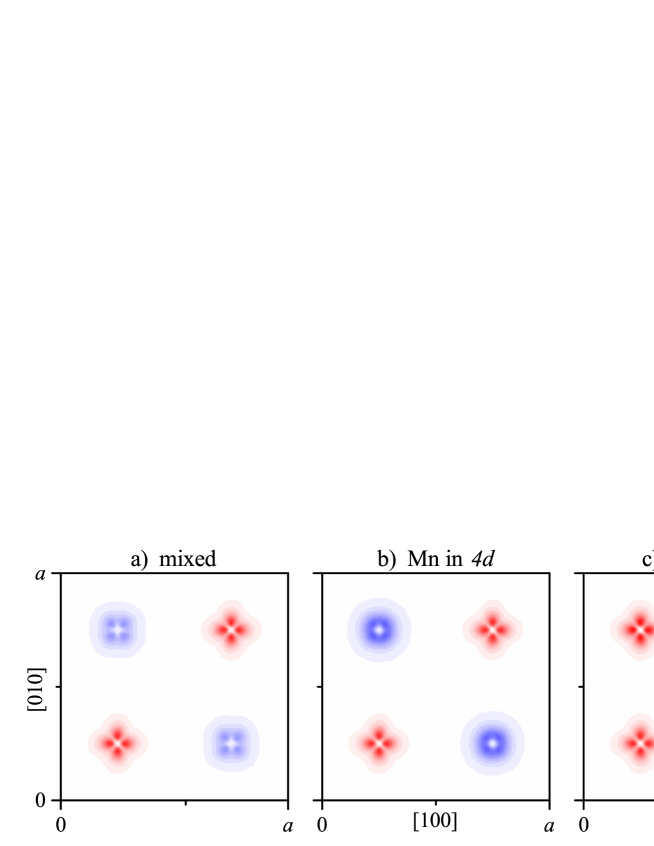
(a) shows the magnetisation density for 4d occupied by 80% Mn and 20% Co; (b) and (c) show for occupied by 100% Mn or Co, respectively.
The calculated site-resolved spin and orbital moments per atom are listed in Table 1 together with the valence electron concentration and number of electrons at the different Mn and Co atoms. The site-resolved values were calculated for a Wigner–Seitz cell around the atoms. The total magnetic moment and number of valence electrons contain also the contribution from the Ga atoms. The total magnetic moment is in the primitive cell. This value agrees well with the measured saturation magnetic moment of [13].
The magnetic moments () are given in multiples of the Bohr magneton (). and are the number of valence and electrons, respectively. Site specific values are per atom, total values are per primitive cell.
| sites | Mn4d | -2.22 | -0.027 | 6.99 | 5.60 |
|---|---|---|---|---|---|
| Mn4b | 3.04 | 0.016 | 6.88 | 5.46 | |
| Co4d | 1.04 | 0.034 | 9.13 | 7.68 | |
| Co4c | 0.98 | 0.040 | 9.27 | 7.75 | |
| average | Mn | 0.70 | -0.003 | 6.93 | 5.52 |
| Co | 0.99 | 0.039 | 9.24 | 7.74 | |
| total | Mn1.8Co1.2Ga | 2.40 | 0.043 | 26.4 |
4.2 Core-level spectroscopy
4.2.1 Magnetic circular dichroism in angle-resolved photoelectron spectroscopy:
The spectroscopy of core levels is a powerful tool for studying the exchange interaction of the core holes with the valence electrons. The excitation of a core electron into a continuum state far above the Fermi level provides important information about the core–valence interactions. Especially, the MCD in photoemission enables an element-specific investigation of the magnetic properties of bulk materials [43], thin films, and intermetallic layers. The high bulk sensitivity of HAXPES in combination with circularly polarised radiation has been introduced to study element-specific properties of magnetic materials [25]. For example, a pronounced MCD of Co and Fe states was reported for exchange-biased magnetic layers [25] as well as for Co and Mn states in remanently magnetised half-metallic feromagnetic Co2MnSi thin films [44]. In the present work, MCD–HAXPES was used to investigate the magnetic properties of Mn and Co in Mn1.8Co1.2Ga thin films.
Polarisation-dependent photoelectron spectra of the Co and Mn core-level emission are shown in Figure 7. The MCD is characterised by an asymmetry that is defined as the ratio of the difference between the intensities and and their sum, , where corresponds to and to type helicity. The asymmetry values are calculated after subtracting a Shirley-type background from the spectra.
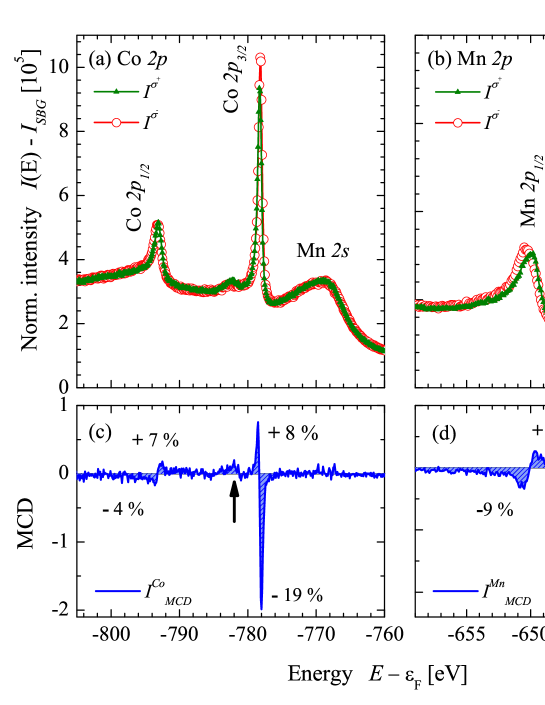
Figure 7(a) shows Co and Mn core-level spectra excited by 7.938 keV, circularly polarised photons. The Mn state at 769 eV did not exhibit a remarkable magnetic dichroism. The Co states exhibit a spin-orbit splitting in and substates with eV. The shape of the spectra is typical for metallic Co states. This proves that the films are not oxidised. A satellite arising from oxidation should appear around 10 eV below the main and peaks [45, 42]. A typical satellite often observed in materials with a face-centred cubic lattice is clearly resolved at 4.0 eV below the maximum. Its intensity is enhanced by excitation and reaches a positive asymmetry of 12%. This peak may be due to interband transitions of the photoemitted electrons into an unoccupied Co state at 4 eV above . The Co states exhibit a clear dichroism that changes its sign in the sequence . The maximum asymmetry of the dichroism (19%) is observed for the state. The sequence of signs of the dichroism is typical for a Zeeman-type exchange splitting of the states for their sublevels [46].
A similar sign sequence of the dichroism is observed for the Mn core states, as shown in Figure 7d. This confirms the parallel alignment of the magnetic moments of Mn and Co. The Mn state exhibits an additional splitting, compared to the Co state. The spin-orbit splitting of Mn is eV. One may expect a splitting of the Mn core states owing to a chemical shift because the Mn atoms occupy two different sublattices, Mn4d and Mn4b. The calculated chemical shift, however, is only about 40 meV, but this value is clearly lower than the resolution of the experiment. Thus, it cannot explain the Mn spectra. The Mn core states did not show any hint on oxidation. It was shown previously, that in MnGa thin films, Ga-O bonds are formed at the interface, which prevent the oxidation of Mn at the interface [22]. The additional splitting of the state is attributed to the core hole–valence interaction. Such a splitting is caused by the Coulomb interaction of the core hole and the localised valence electrons of the majority channel. At the state, this exchange splitting amounts to eV, which is typical for Heusler alloys [47, 48, 49]. The asymmetry values of the Mn states are higher than those of the Co states owing to the localised character of Mn states.
4.2.2 X-ray absorption spectroscopy:
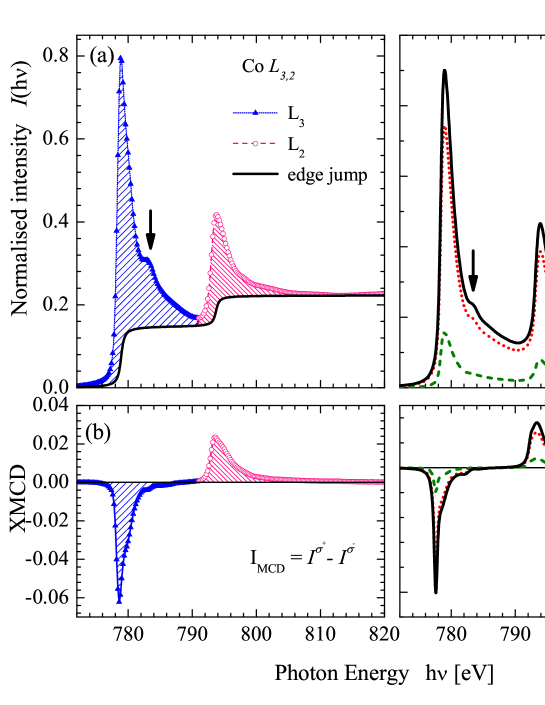
The MCD in combination with HAXPES has given information about the exchange effects of the core holes. The photoelectrons are detected at energies of unbound states far above the Fermi energy that have no direct relation to the part of the electronic structure responsible for transport properties. XAS and XMCD of Co and Mn edges were investigated and discussed in detail to investigate the exchange effect and to gain information about the unoccupied states close to . The XAS spectra were normalised to the calculated number of unoccupied states for better comparison. The details of the data analysis are described in Reference [44]. The experimental (XAS) and circular dichroism (XMCD) spectra of the Mn edges are shown in Figures 8a and 8b. They are compared to calculated spectra in single-particle mode in Figures 8c and 8d and atomic-type many-particle mode in Figures 8e and 8f.
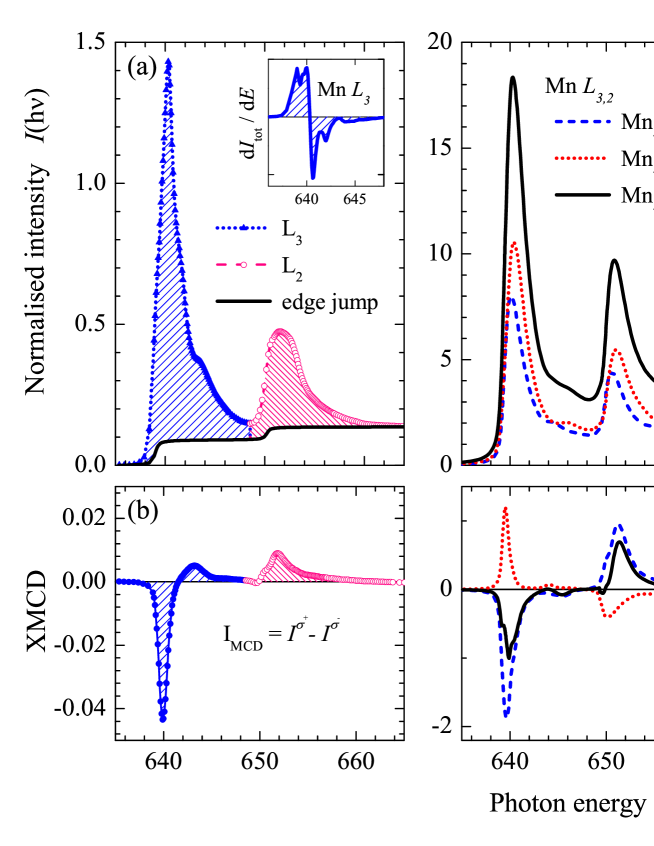
Corresponding XMCD spectra are shown in (b) and (d). (e) and (f) show the many electron calculated XAS spectra and corresponding XMCD for an initial Mn2+ state. Intensities of the experiment and many electron calculations are normalised to the number of holes, theoretical values from KKR calculations are in atomic units.
The spectra show the two white lines, corresponding to the and transitions, and reveal a high XMCD asymmetry with opposite sign. The corresponding single particle calculated XAS and XMCD spectra are shown in Figure 8c and 8d, respectively. The single particle ground state binding energies of the two Mn and Co atoms in different positions differ by 100 meV and 10 meV, respectively. This is less than the resolution of the experiment and therefore not detectable. It merely results in a broadening of the lines.
From the calculations, Mn1.8Co1.2Ga is found to be a ferrimagnet where the two Mn atoms, Mn4d and Mn4b, occupy two different sites with antiparallel spin orientation and different degrees of spin localisation (see Section 4.1). The ferrimagnetic character of Mn in Mn2.2Co0.8Ga bulk material [50] as well as in Mn2CoGa thin films [51] was previously confirmed by XAS–XMCD experiments.
At the edge a small step appears in the measured XMCD signal. The first derivative of the sum spectra is shown as an inset in Figure 8a. Two maxima are clearly resolved, which indicates the superposition of two absorption maxima with slightly different energies. Similar to the observation in the electron emission spectra, the dichroism does not vanish between the and lines hinting on a mixing of the states. This mixing process is induced by the Coulomb interaction. The influence of a -type mixing on the XAS spectra has been discussed in detail by Goering [52]. The calculated many electron XAS spectra for the Mn2+ initial state (see Figure 8e) show a similar shape as the measured ones. The satellite appears at about 3.5 eV above the maximum of the line. The calculated splitting of the line is similar to that observed in the experiment. Both effects are attributed to multiplet effects and are similar to the behaviour of the Mn states of other Heusler compounds. More details about the multiplet effects are discussed in References [49, 44].
The Co XAS and XMCD spectra are shown in Figure 9. The sign order of the XMCD spectra confirms the parallel alignment of the Co magnetic moment to the mean of the Mn moment. Both calculated and measured Co XAS spectra show, in addition to the spin-orbit splitting of 14.8 eV, a shoulder at 4 eV above the white line (indicated by arrows). This is similar to the 4 eV satellite that is observed in the photoelectron spectrum of the core level. This shoulder corresponds to a Co–Mn -band hybridisation state and was previously described as characteristic for highly ordered Heusler compounds [53, 54].
A sum-rule analysis was performed to obtain the spin and orbital magnetic moments from the XMCD data [55, 56]. Three parameters enter the sum rule analysis that are the effective degree of circular polarisation (), the number of -holes () and the spin correction factor () such that the spin magnetic moment is given by:
| (1) |
where is the uncorrected value for 100% photon polarisation. is the effective polarisation projected on the direction of magnetisation. is the angle between the photon beam and the direction of the applied magnetic field defining the magnetisation. In the present experiment, and resulting in an effective circular polarisation of 94.5%. The number of unoccupied states was assumed to be , and in accordance to the calculation of the occupied states. The values for the magnetic moments need to be corrected to account for the partial overlap of the and edges in Mn [57]. Here, the spin magnetic moment obtained by the sum rule analysis is corrected by the factors for Mn2+ and 0.874 for Co3+ as reported by Teramura et al [57]. Similar corrections were used by Chen et al. for Co (0.956) [58] and in our previous work [44]. The resulting magnetic moments, together with the calculated values are summarized in Table 2. The uncorrected average spin moment per atom is 0.468 for Mn, this value is in well agreement with the reported value of 0.47 in Mn2CoGa thin films [51]. The uncorrected average spin moment of 0.89 for Co derived from XMCD agrees well with the calculated value of 0.99 . is small for both, Co and Mn, as expected because the orbital moments in cubic structures are quenched. The total moment from XMCD is in well agreement with the moment calculated (2.44 ) or measured by VSM (2.57 ).
| ms | ml | mtot | ||
|---|---|---|---|---|
| XMCD | Mn∗ | 0.468 | 0.005 | 1.94 |
| Co∗ | 0.888 | 0.022 | ||
| Mn | 0.688 | 0.007 | 2.46 | |
| Co | 1.016 | 0.025 | ||
| calculated | Mn | 0.70 | -0.003 | 2.44 |
| Co | 0.99 | 0.04 |
4.3 Spin-resolved unoccupied density of states
The -XAS spectra are related to the unoccupied -states. Figure 10 shows the spin-resolved unoccupied Mn and Co partial densities of states derived from the edge XAS–XMCD data using the spin-resolved unoccupied PDOS function [56, 54]. The shown calculated densities of states are convoluted by a Fermi-Dirac distribution for the unoccupied states at 300 K and by a Gaussian with a width of 300 meV to simulate the experimental broadening.
The majority and minority partial densities of states shown in Figure 10 are well resolved and clearly exhibit deviations from the calculated ones. The observed maxima of the minority densities agree well with the calculations for both, Mn and Co. The Co majority PDOS exhibits a shift of 0.5 eV with respect to the maximum of the calculated majority states above . The minority PDOS of Mn shows a pronounced maximum at 1.4 eV, which is dominated by unoccupied states located at Mn4b atoms (compare Figure 4). The majority PDOS of Mn shows a characteristic double-step increase and the observed maximum exhibits an energy shift of eV. The corresponding maximum of the experimental majority PDOS of Mn appears at 1.65 eV. Besides correlation effects that will be explained below, this maximum may be effected by the multiplet effects or it may be due to spin-flip transitions [59] into the high density of minority states that appears at the same energy.
The shifts of the maxima observed for the unoccupied minority PDOSs are characteristic of Heusler alloys [54]. They are induced by electron correlation effects between localised and itinerant minority states. In particular for Co, the shift is a consequence of the itinerant bands that dominate the unoccupied majority Co states at the Fermi energy (see Figures 3 and 4). The transition energy for interaction of the core hole in the final state with localized states is lower compared to the itinerant states because the latter screen the core hole to some extent [60, 61]. This effect produces an energy shift between itinerant and localized states. The correlation energy of eV suggested in Reference [54] agrees well with the shift observed in the present work. For Mn, an energy shift of eV is determined. This is in the same order as the shift observed for other Heusler alloys [56, 62, 50, 44]. It is also induced by electron correlation effects between core hole and localised or itinerant minority states. Indeed, those states also differ for the majority electrons. The correlation energy strongly changes the minority PDOS determined from the XMCD measurements. As a consequence, the correct energy dependence of the unoccupied minority states can not be unambiguously detected with the used method.
4.4 HAXPES of the valence band
The occupied part of the electronic structure can easily be investigated by photoelectron spectroscopy. The linear dichroism in the angular distribution (LDAD) of photoelectrons is the difference between photoelectron currents ejected at a definite angle by the linearly polarised light of two mutually perpendicular polarisations [63]:
| (2) |
where is the partial photoionisation cross section and is the angular asymmetry parameter of the initial state with quantum number . For linearly polarised light, the emitted electrons are parallel () or perpendicular () to the surface normal.
The polarisation-dependent photoelectron spectra and the calculated electronic structure of Mn1.8Co1.2Ga are compared in Figure 11. The shown densities of states are convoluted by a Fermi-Dirac distribution for the occupied states at 300 K and by a Gaussian with a width of 150 meV to simulate the experimental resolution. The valence band spectra were normalised to the secondary background below the valence band (14 eV), as described in detail in [31]. The difference shows the linear dichroism. The values given in Figure 11a are the calculated asymmetries at the most pronounced maxima of the spectra (labelled A to D).
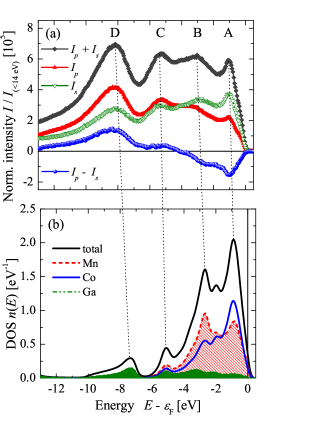
The calculated, total and partial densities of states are convoluted by a Fermi-Dirac distribution for 300 K and broadened by a Gaussian with a width of 150 meV corresponding to the experimental resolution.
The density of states exhibits three main maxima (A, B, and C) in the energy range from -7 eV to as well as the split-off band (D) with symmetry. These structures are clearly observed in the photoelectron spectra (marked by dotted lines). One observes an energy shift and broadening when moving away from . This is due to the lifetime effects of the photoexcited electrons during the photoemission process. The broadening is caused by increasing the imaginary part and the shift by the real part of the complex self-energy of the photoexcited electrons. The maximum at about -8 eV arises from the states located mainly at the Ga atoms. The characteristic Heusler hybridisation gap at around -7 eV is clearly resolved. The maximum C at about -5.3 eV corresponds to an excitation of the states. The maximum B at -2.7 eV arises mainly from the Mn majority states, as seen from the spin-resolved DOS in Figure 3b. The sharp state A at -0.95 eV comprises localised Mn4b states of the majority DOS. Such sharp states have been previously observed in the tetragonal Mn–Co–Ga system [12]. Changing the Co amounts in Mn3-xCoxGa shifts this state closer to , ending in a band Jahn–Teller effect that results in the tetragonal distortion of the crystalline structure [16]. Changing the polarisation from to causes pronounce differences to appear in the spectra. states (A and B) with small binding energies have a higher intensity for polarisation. As in other cubic Heusler compounds [26, 64, 65], the intensity of the states is suppressed by polarisation, but it does not vanish, as expected for angular asymmetry parameter [66]. This is due to the -hybridisation of the states in the cubic symmetry. The linear dichoism of the states is positive and small, reaching a value of +5% (at -5 eV). The states (maximum A) at -0.94 eV exhibit the highest linear dichroism asymmetry of 29% with negative values. Those states have an angular asymmetry parameter of .
5 Summary and conclusions
In summary, the electronic and magnetic properties of Mn1.8Co1.2Ga thin films were investigated both theoretically and experimentally. Mn1.8Co1.2Ga is found to be a ferrimagnet where the two Mn atoms, Mn4d and Mn4b, occupy two different sites with antiparallel spin orientation and different degrees of spin localisation. The electronic structure calculations of the alloy Mn1.8Co1.2Ga were performed by means of the fully relativistic spin-polarised Korringa–Kohn–Rostoker method. The chemical disorder in this alloy caused a broadening of the majority bands as shown in the Bloch spectral function, generating a reduction of majority electrons at the Fermi energy. The broadening results in a low effective spin polarisation at the Fermi energy. This explains the rather low TMR values reported for the Mn3-xCoxGa system [14]. The spin-resolved partial densities of state of Co and Mn at different sites revealed a nearly uniform distribution of Mn4d and Co states over the valence band range. The Mn4b atoms exhibit a pronounced localisation of valence electrons in the majority channel. The Bloch spectral functions reveal that the localized Mn states are less affected by the chemical disorder scattering. The calculated atom resolved magnetisation density reveals that the moment of Co in is oriented parallel to the total magnetic moment and has the same shape as that in . The magnetisation density at is dominated by the part arising from the Mn atom that has its magnetic moment oriented with opposite sign to the total magnetic moment. The valence states were further investigated by linear dichroism in the angular distribution. All states are well resolved and in agreement with the calculated electronic structure. The remarkably high linear dichroism in the valence band enables a symmetry analysis of the contributing states. Detailed magnetic properties were explored by excitation with circularly polarised X-rays. Element-specific magnetic moments and spin-resolved partial unoccupied densities of states were determined by using XAS and XMCD. A shifts of the maxima observed for the unoccupied minority states is induced by electron correlation effects between core hole and localised or itinerant minority states with different strength. XMCD was used to extract the site resolved magnetic moments. An experimental values of 2.46 agree well with the calculated magnetic moments of 2.44 or measured by VSM (2.57 ). Based on ab-initio calculations in combination with the core-level spectroscopy, it was shown that one of the two Mn moments has a more localized character, whereas the other Mn moment and the Co moment are more itinerant. The similar sign sequence of the dichroism in photoelectron spectra for the Mn and Co core states confirms the parallel alignment of the magnetic moments of Mn and Co. The splitting of the Mn state is caused by the Coulomb interaction of the core hole and the localised valence electrons of the majority channel.
A possible way to improve the spin-transport in MnGa-system could be a a partially substitution of the main group element Ga, or a off-stoichiometric composition, similar to the regular Heusler compound Co2MnSi that has shown the record tunnel magnetoresistance with a giant ratio of up to 1995% at 4.2 K with variation of the Mn content [15]. Beside the theoretical investigation, a extensive study of such system by spectroscopic methods – as shown in the present work – will be a key to understand the properties of those alloys.
References
- [1] S. Mizukami, D. Watanabe, E. P. Sajitha, H. Naganuma, M. Oogane, Y. Ando, and T. Miyazaki. IEEE Trans. Magn., 56(6):1863, 2010.
- [2] S. Mizukami, T. Kubota, F. Wu, X. Zhang, T. Miyazaki, H. Naganuma, M. Oogane, A. Sakuma, and Y. Ando. Phys. Rev. B, 85(1):014416, 2012.
- [3] B. Balke, H. G. Fecher, J. Winterlik, and C. Felser. App. Phys. Lett., 90:152504, 2007.
- [4] J. Winterlik, B. Balke, G. H. Fecher, C. Felser, M. C. M. Alves, F. Bernardi, and J. Morais. Phys. Rev. B, 77(5):054406, 2008.
- [5] F. Wu, S. Mizukami, D. Watanabe, H. Naganuma, M. Oogane, Y. Ando, and T. Miyazaki. App. Phys. Lett., 94:122503, 2009.
- [6] T. Kubota, M. Araidai, S. Mizukami, X. Zhang, Q. L. Ma, H. Naganuma, M. Oogane, Y. Ando, M. Tsukada, and T. Miyazaki. App. Phys. Lett., 99:192509, 2011.
- [7] T. Kubota, Q. L. Ma, S. Mizukami, X. Zhang, Y. Miura, H. Naganuma, M. Oogane, Y. Ando, and T. Miyazaki. Appl. Phys. Express, 5:043002, 2012.
- [8] S. Mizukami, F. Wu, A. Sakuma, J. Walowski, D. Watanabe, T. Kubota, X. Zhang, H. Naganuma, M. Oogane, Y. Ando, and T. Miyazaki. Phys. Rev. Lett., 106(11):117201, 2011.
- [9] Q. Ma, A. Sugihara, K. Suzuki, X. Zhang, S. Mizukami, and T. Miyazaki. Spin, 4:1440024, 2014.
- [10] V. Alijani, J. Winterlik, H. G. Fecher, and C. Felser. App. Phys. Lett., 99:222510, 2011.
- [11] J. Winterlik, S. Chadov, A. Gupta, V. Alijani, T. Gasi, K. Filsinger, B. Balke, G. H. Fecher, C. A. Jenkins, F. Casper, J. Kübler, G.-D. Liu, L. Gao, S. S. P. Parkin, and C. Felser. Adv. Mater., 2012.
- [12] S. Ouardi, T. Kubota, G. H. Fecher, R. Stinshoff, S. Mizukami, T. Miyazaki, E. Ikenaga, and C. Felser. Appl. Phys. Lett., 101(24):242406, 2012.
- [13] T. Kubota, S. Ouardi, S. Mizukami, G. H. Fecher, C. Felser, Y. Ando, and T. Miyazaki. J. Appl. Phys., 113:17C723, 2013.
- [14] T. Kubota, S. Mizukami, Q. L. Ma, H. Naganuma, M. Oogane, Y. Ando, and T. Miyazaki. J. Appl. Phys., 115(19):17C704, 2014.
- [15] H.-x. Liu, Y. Honda, T. Taira, K.-i. Matsuda, M. Arita, T. Uemura, and M. Yamamoto. Appl. Phys. Lett., 101:132418, 2012.
- [16] S. Chadov, J. Kiss, and C. Felser. Adv. Funct. Mater., 23:832, 2012.
- [17] K. Kobayashi. Nucl. Instr. Meth. Phys. Res. A, 547:98, 2005.
- [18] K. Kobayashi. Nucl. Instr. Meth. Phys. Res. A, 601:32, 2009.
- [19] G. H. Fecher, B. Balke, S. Ouardi, C. Felser, G. Schönhense, E. Ikenaga, J.-J. Kim, S. Ueda, and K. Kobayashi. J. Phys. D: Appl. Phys., 40:1576, 2007.
- [20] G. H. Fecher, B. Balke, A. Gloskowskii, S. Ouardi, C. Felser, T. Ishikawa, M. Yamamoto, Y. Yamashita, H. Yoshikawa, S. Ueda, and K. Kobayashi. Appl. Phys. Lett., 92:193513, 2008.
- [21] S. Ouardi, B. Balke, A. Gloskovskii, G. H. Fecher, C. Felser, G. Schönhense, T. Ishikawa, T. Uemura, M. Yamamoto, H. Sukegawa, W. Wang, K. Inomata, Y. Yamashita, H. Yoshikawa, S. Ueda, and K. Kobayashi. J Phys. D, 42:084010, 2009.
- [22] C. E. ViolBarbosa, S. Ouardi, T. Kubota, S. Mizukami, G. H. Fecher, T. Miyazaki, X. Kozina, E. Ikenaga, and C. Felser. J. Appl. Phys., 116:034508, 2014.
- [23] X. Kozina, J. Karel, S. Ouardi, S. Chadov, G. H. Fecher, C. Felser, G. Stryganyuk, B. Balke, T. Ishikawa, T. Uemura, M. Yamamoto, E. Ikenaga, S. Ueda, and K. Kobayashi. Phys. Rev. B, 89:125116, 2014.
- [24] A. Sekiyama, J. Yamaguchi, A. Higashia, M. Obara, H. Sugiyama, M. Y. Kimura, S. Suga, S. Imada, I. A. Nekrasov, M. Yabashi, K. Tamasaku, and T. Ishikawa. New Journal of Physics, 12:043045, 2010.
- [25] X. Kozina, G. H. Fecher, G. Stryganyuk, S. Ouardi, B. Balke, C. Felser, G. Schönhense, E. Ikenaga, T. Sugiyama, N. Kawamura, M. Suzuki, T. Taira, T. Uemura, M. Yamamoto, H. Sukegawa, W. Wang, K. Inomata, and K. Kobayashi. Phys. Rev. B, 84:054449, 2011.
- [26] S. Ouardi, G. H. Fecher, X. Kozina, G. Stryganyuk, B. Balke, C. Felser, E. Ikenaga, and K. Kobayashi. Phys. Rev. Lett., 107(21):036402, 2011.
- [27] A. Sekiyama, A. Higashiya, and S. Imada. J. Electron Spectrosc. Relat. Phenom., 190:201–204, 2013.
- [28] N. D. Telling, P. S. Keatley, G. van der Laan, R. J. Hicken, E. Arenholz, Y. Sakuraba, M. Oogane, Y. Ando, and T. Miyazaki. Phys. Rev. B, 74:224439, 2006.
- [29] G. Schütz, W. Wagner, W. Wilhelm, P. Kienle, R. Zeller, R. Frahm, and G. Materlik. Phys. Rev. Lett., 58:737, 1987.
- [30] C. T. Chen, F. Sette, Y. Ma, and S. Modesti. Phys. Rev. B, 42:7262, 1990.
- [31] S. Ouardi, G. H. Fecher, and C. Felser. J. Electron Spectrosc. Relat. Phenom., 190:249, 2013.
- [32] E. Ikenaga, M. Kobata, H. Matsuda, T. Sugiyama, H. Daimon, and K. Kobayashi. J. Electron Spectrosc. Relat. Phenom., 190:180, 2013.
- [33] M. Suzuki, N. Kawamura, M. Mizukami, A. Urata, H. Maruyama, S. Goto, and T. Ishikawa. Jpn. J. Appl. Phys., 37:L1488, 1998.
- [34] T. Nakamura, T. Muro, F. Z. Guo, T. Matsushita, T. Wakita, T. Hirono, Y. Takeuchi, and K. Kobayashi. J. Electron Spectrosc. and Relat. Phenom., 144-147:1035, 2005.
- [35] H. Ebert, D. Ködderitzsch, and Minar. Rep. Prog. Phys, 74:096501, 2011.
- [36] B. Gyorffy. Phys. Rev. B, 5:2382, 1972.
- [37] W. H. Butler. Phys. Rev. B, 31:3260, 1985.
- [38] J. P. Perdew, K. Burke, and M. Ernzerhof. Phys. Rev. Lett., 77:3865, 1996.
- [39] E. Stavitski and F. M. F. de Groot. Micron, 41:687, 2010.
- [40] R. D. Cowan. The Theory of Atomic Structure and Spectra. California Press, Berkeley, 1981.
- [41] F. M. F. de Groot. Coordin. Chem. Rev., 249:31, 2005.
- [42] F. de Groot and A. Kotani. Core Level Spectroscopy of Solids. CRC Press, Taylor and Francis Group, Boca Raton, London, New York, 2008.
- [43] G. van der Laan, S. S. Dhesi, and E. Dudzik. Phys. Rev. B, 61:12277, 2000.
- [44] G. H. Fecher, D. Ebke, S. Ouardi, S. Agrestini, C. Y. Kuo, N. Hollmann, Z. Hu, A. Gloskovskii, F. Yakhou, N. B. Brookes, and C. Felser. SPIN, 4:1440017, 2014.
- [45] A. Chainan, T. Yokoya, Y. Takata, K. Tamasaku, M. Taguchi, T. Shimojima, N. Kamakura, K. Horiba, S. Tsuda, S. Shin, D. Miwa, Y. Nishino, T. Ishikawa, M. Yabashi, K. Kobayashi, H. Namatame, M. Taniguchi, K. Takada, T. Sasaki, H. Sakurai, and E. Takayama-Muromachi. Nucl. Instr. Meth. Phys. Res. A, 547:163–168, 2005.
- [46] J. G. Menchero. Phys. Rev. B, 57:993, 1998.
- [47] Y.M. Yarmoshenko, M.I. Katsnelson, E.I. Shreder, E.Z. Kurmaev, A. Slebarski, S. Plogmann, T. Schlathölter, J. Braun, and M. Neumann. Eur. Phys. J. B, 2(1):1, 1998.
- [48] S. Plogmann, T. Schlathoelter, J. Braun, M. Neumann, Y. M. Yarmoshenko, M. V. Yablonskikh, E. I. Shreder, E. Z. Kurmaev, A. Wrona, and A. Slebarski. Phys. Rev. B, 60:6428, 1999.
- [49] S. Ouardi, G. H. Fecher, B. Balke, A. Beleanu, X. Kozina, G. Stryganyuk, C. Felser, W. Kloss, H. Schrader, F. Bernardi, J. Morais, E. Ikenaga, Y. Yamashita, S. Ueda, and K. Kobayashi. Phys. Rev. B, 84:155122, 2011.
- [50] P. Klaer, B. Balke, V. Alijani, J. Winterlik, G. H. Fecher, C. Felser, and H. J. Elmers. Phys. Rev. B, 84:144413, 2011.
- [51] M. Meinert, J.-M. Schmalhorst, C. Klewe, G. Reiss, E. Arenholz, T. Böhnert, and K. Nielsch. Phys. Rev. B, 84(13):132405, 2011.
- [52] E. Goering. Philosophical Magazine, 85:2895, 2005.
- [53] M. Kallmayer, H. J. Elmers, B. Balke, S. Wurmehl, F. Emmerling, G. H. Fecher, and C. Felser. J. Phys. D: Appl. Phys., 39:786 – 792, 2006.
- [54] M. Kallmayer, P. Klaer, H. Schneider, E. A. Jorge, C. Herbort, G. Jakob, M. Jourdan, and H. J. Elmers. Phys. Rev. B, 80:020406(R), 2009.
- [55] J. Stöhr. J. Electron Spectrosc. Relat. Phenom., 75:253, 1995.
- [56] P. Klaer, M. Kallmayer, C. G. F. Blum, T. Graf, J. Barth, B. Balke, G. H. Fecher, C. Felser, and H. J. Elmers. Phys. Rev.B, 80:144405, 2009.
- [57] Y. Teramura, A. Tanaka, and T. Jo. J. Phys. Soc. Jpn., 65(4):1053, 1996.
- [58] C. T. Chen, Y. U. Idzerda, H.-J. Lin, N. V. Smith, G. Meigs, E. Chaban, G. H. Ho, E. Pellegrin, and F. Settle. Phys. Rev. Lett., 75:152, 1995.
- [59] D. Steil, S. Alebrand, T. Roth, M. Kraus, T. Kubota, M. Oogane, Y. Ando, H. C. Schneider, M. Aeschlimann, , and M. Cinchetti. Phys. Rev. Lett., 105:217202, 2010.
- [60] A. Bianconi. Phys. Rev. B, 26:2741, 1982.
- [61] P. J. W. Weijs, M. T. Czyzyk, J. F. van Acker, W. Speier, J. B. Goedkoop, H. van Leuken, H. J. M. Hendrix, R. A. de Groot, G. van der Laan, K. H. J. Buschow, G. Wiech, and J. C. Fuggle. Phys. Rev. B, 41:11899, 1990.
- [62] P. Klaer, T. Bos, M. Kallmayer, C. G. F. Blum, T. Graf, J. Barth, B. Balke, G. H. Fecher, C. Felser, and H. J. Elmers. Phys. Rev. B, 82:104410, 2010.
- [63] N. A. Cherepkov and G. Schönhense. Europhys. Lett., 24:79, 1993.
- [64] X. Kozina, T. Jäger, S. Ouardi, A. Gloskovskii, G. Stryganyuk, G. Jakob, T. Sugiyama, E. Ikenaga, G. H. Fecher, and C. Felser. Appl. Phys. Lett., 99:221908, 2011.
- [65] R. Shan, S. Ouardi, G. H. Fecher, L. Gao, A. Kellock, A. Gloskovskii, C. E. ViolBarbosa, E. Ikenaga, C. Felser, and S. S. P. Parkin. Appl. Phys. Lett., 101:212102, 2012.
- [66] M. B. Trzhaskovoskaya, V. I. Nefedov, and V. G. Yarzhemsky. Atom Data Nucl. Data, 77:97, 2001.