Cubic H3S around 200 GPa: an atomic hydrogen superconductor stabilized by sulfur
Abstract
The multiple scattering-based theory of Gaspari and Gyorffy for the electron-ion matrix element in close packed metals is applied to H3S, which has been predicted by Duan et al. and Bernstein et al to be the stable phase at this stoichiometry around 190 GPa, thus is the leading candidate to be the phase observed to superconduct at 190K by Drozdov, Eremets, and Troyan. The nearly perfect separation of vibrational modes into those of S and of H character provides a simplification that enables identification of contributions of the two atoms separately. The picture that arises is basically that of superconducting atomic H stabilized by strong covalent mixing with S and character. The reported isotope shift is much larger than the theoretical one, suggesting there is large anharmonicity in the H vibrations. Given the relative unimportance of sulfur, hydrides of lighter atoms at similarly high pressures may also lead to high temperature superconductivity.
I Background
The report by Drozdov, Eremets, and TroyanDrozdov (DET) of superconductivity up to Tc=190 K in H2S compressed to the 200 GPa regime has reignited excitement in the possibility of achieving room temperature superconductivity. This report builds on previous success of pressure enhancement of Tc in a variety of types of materials: from 134K to 164K in the cuprate Hg2223,Hg2223 ; Hg2223v2 from zero to 20-25 K in the simple metals Li, Ca, and Y,[sch1, ; Li1, ; Li2, ; DAPli, ; calcium, ; yttrium, ; CaY, ] and from zero to 14K in the insulator silicon.silicon An anticipated major factor is the increase in the phonon energy scale with compression, since it sets the temperature scale for Tc, as pointed out early onashcroft and reviewed more recentlyashcroft2 by Ashcroft in predicting possible room temperature superconductivity in metallic hydrogen.
The newly reported high values of Tc appear to confirm theoretical predictions that predated the experiment. Applying particle swarm crystal structure search techniques founded on density functional theory, Li et al. predictedLi candidate stable crystal structures of H2S up to 220 GPa. These predictions were followed by linear response calculations of the phonon spectrum , electron-phonon matrix elements, and finally the Eliashberg spectral function , from which Tc can be calculated, depending only mildly on the presumed value of the retarded Coulomb repulsion = 0.10-0.13. For pressures of 140-180 GPa, they obtained an electron-phonon coupling strength =1.0-1.2, an Allen-Dynes characteristic frequencyalldyn 1000K, and Tc of 40K at 140 GPa and peaking at 80 K at 160 GPa. While 80K is well short of the reported Tc=190K, the result is convincing that very high Tc is predicted in H2S at high pressure.
The sister stoichiometry H3S has been explored in very similar fashion by Duan et al.Duan Predicting structures to more than 200 GPa, their linear response results for H3S led to very large calculated values of electron-phonon coupling strength =2.0-2.2, frequency scales 1300K, and values of Tc up to 200K. In the calculations of Li et al. and Duan et al., the high values of are expected from the anticipated increase of force constants as volume is decreased. The large values of , a factor of two or more over most other very good superconductors (including MgB2), imply that the electronic matrix elements are substantially larger than in nearly all known conventional superconductors.
In this report we use Gaspari-Gyorffy (GG) theoryGG to provide insight into why electron-ion matrix elements vary, and evidently increase strongly, with pressure. Such understanding is necessary not only to interpret the results described above, but also to provide essential clues how to increase matrix elements, and , at lower or possibly ambient pressure. Interestingly, shortly after the formulation of this theory, two of the present authors applied it to predict Tc250K in metallic hydrogen at a few Mbar pressure.hydrogen
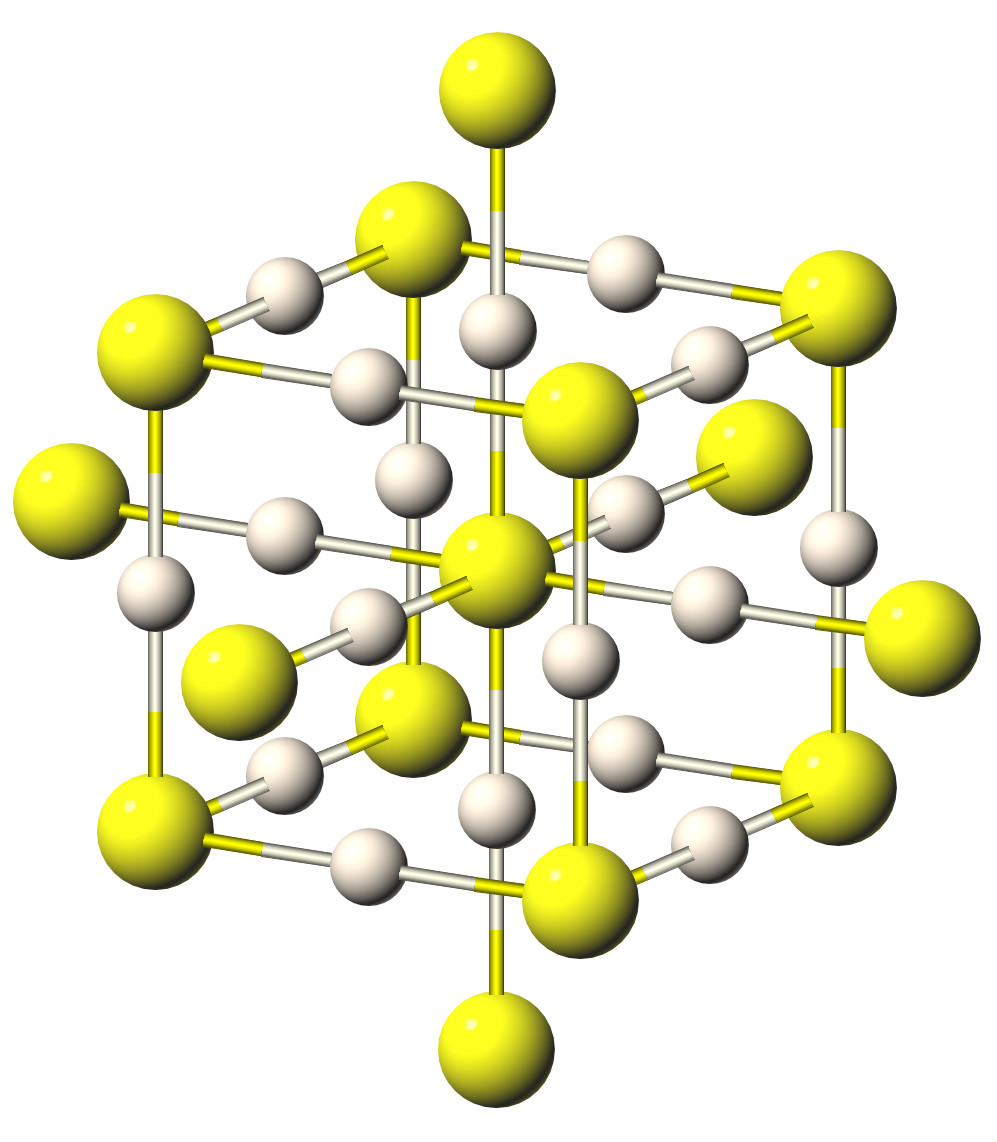
GG theoryGG builds on the earlier observation of HopfieldHopfield that electron scattering off (moving) ions has strong local character. First, metallic screening means the Thomas-Fermi screening length is short, of the order of 1 Å, and very weakly dependent on carrier density (more correctly, the Fermi level density of states [DOS] N(EF)). GG employed a multiple scattering Green’s function formalism that facilitated three simplifications. The first is that the potential is spherical (very good approximation) and is negligible beyond the atomic sphere; the second is that the linear change in potential of a displaced ion can be approximated by a rigid shift of the atomic potential. Thirdly, the direction dependence of the wavefunction coefficients is averaged out, thereby neglecting any special influence of Fermi surface shape. The H3S Fermi surfacebernstein is large and multisheeted, minimizing the likelihood of Fermi surface effects. It is possible that these approximations may improve with reduction in volume, in any case these approximations should not degrade as the system become denser. The bands shown by Duan et al.Duan and Bernstein et al.bernstein for the structure of H3S that we discuss show much free electron, spherical character in the lower 75% of the occupied bands, though less so around the Fermi energy where S - H hybridization produces structure in the DOS.
II Theory and Results
The coupling strength , and the frequency weighting spectrum normalized to unity, are given in Eliashberg theorySSW by
| (1) |
where is the Eliashberg electron-phonon spectral function that governs many superconducting properties. The calculations by Li et al. for H2S and Duan et al. for H3S demonstrate that the lower range of phonon frequencies (the acoustic modes) have negligible H character, while the optic modes above the gap at 20-25 THz have negligible S character, making it an ideal platform for applying the GG expression to the atoms separately.
Thus , where the latter arise from the integral over the low frequency S modes, the former from the nine higher frequency H branches. In this case the GG expression, given originally for an elemental solid, can be applied to the S and H spheres separately.klein76 Each atomic () coupling constant is given by the integral over the appropriate frequency region, leading to
| (2) |
The averaged matrix elements obtained from GG theory are discussed below.
The separation of mode character also allows a simple estimate of the total frequency moments that enter the Allen-Dynes (AD) equation for Tc, through the weight function
| (3) |
where the partial functions, defined analogously to that of AD (Eq. 1) are separately normalized to unity.
Both H2S and H3S having been shownLi ; Duan to have strong electron-phonon coupling at high pressure. Bernstein et al.bernstein have provided convincing evidence that H2S is unstable to decomposition into bcc H3S and sulfur, and that competing stoichiometries are unlikely. This result confirms the suggestion of DET, who reported sulfur formation in their samples. Because of this evidence on the most likely superconducting phase, we focus on H3S with its simple structure based in two interlaced ReO3 structure sublattices. From of Duan et al., we simplify with a constant (constant for each atom species ) with frequency ranges (in kelvin) of [430,820] for S and [1250,2500] for H. Results are insensitive to these limits, depending mostly on the mean frequencies and the separation of into S and H contributions. The resulting frequency moments , and and associated data, for insight into separate S and H contribution, for use in the AD equation,alldyn and to compare with results below from GG theory, are presented in Table 1.
With =0.15, Tc=234 K results; the difference from the value quoted by Duan et al. might be due to neglect of the strong coupling factor =1.13 factor in the AD equation, which amounts to a 26 K increase, or partially to our constant modeling. Neglecting the contribution from the S modes, is decreased from 2.2 to 1.5 but increases from 1500 K to 1770 K, and Tc decreases by only 19 K to 215 K. The sulfur contribution to Tc is 8%; H3S is basically an atomic hydrogen high temperature superconductor. Bernstein et al. also suggested that S vibrations are not essential for the high Tc. The H isotope effect can also be obtained. is unaffected by masses; is a function of the force constants alone, so frequencies, specifically decrease as the square root of the mass. The resulting critical temperature is reduced to 170 K, slightly more than 234 K/ because the small S contribution remains unchanged. The experimental value of DETDrozdov is 90 K; the most likely cause of this discrepancy is strong anharmonicity of the H optic modes.
The second moment frequency at 200 GPa of S is =615 K, while that of H is =1840 K, thus with the atomic masses of 32 and 1 a.m.u respectively, the denominator is 32/9 =3.5 larger for S. The consequence is that a given contribution to is 3.5310 times more effective in increasing than the same contribution to (though in practice there is no clear method of effecting such a tradeoff).
| S | H | H3S | ||
| 595 | 1770 | 1500 | ||
| 605 | 1800 | 1530 | ||
| 615 | 1840 | 1560 | ||
| (eV/Å2) | 9.3 | 2.6 | – | |
| (eV/Å2) | 4.7 | 1.48 | – | |
| 0.5 | 1.7/3 | 2.2 |
In terms of the phase shifts for the -th atom for orbital channel , the square electron-ion matrix element averaged over the Fermi surface can be written in the simple formGG as
| (4) |
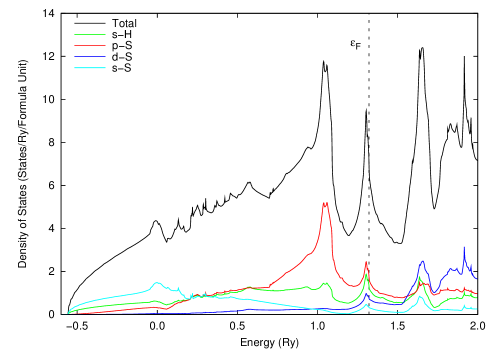
where is the ratio of the -th partial DOS to , the single scatterer DOS, for the given atomic potential in a homogeneous system. is independent of N(EF) since it can equally well be expressedwep in terms of the fractions which usually do not reflect the van Hove singularities of either one. The calculated DOS at 210 GPa is shown in Fig. 2. The Fermi level falls at a sharp and narrow peak; calculations at other volumes indicate this is a persistent occurrence. will tend to be maximized in the cases where “neighboring” channels have a large difference in phase shifts but ratios that are as large as possible. From the GG expression, for each atom , and the latter factor involves the factor and products of PDOS ratios . can be expressed in terms of the ionic force constants, independent of , (which we return to below) so that any isotope effect different from will arise from factors beyond (primarily anharmonicity).
The calculations have been carried out with two all-electron linearized augmented plane wave (LAPW) codes, one developed at NRL,nrllapw and also ELK.elk The sphere radii were 1.8 a.u. and 1.0 a.u. for S and H respectively, except for the smallest volume where the S radius was reduced because the sum of the radii must be no more than /2.
The band structureDuan ; bernstein consists of four nearly filled bands, leaving some holes at and electrons around N. In addition, a fifth broad band is roughly half filled. The DOS is noteworthy: free electron like over 20 eV of the valence band before strong structure arises in a 7 eV range centered at EF, which lies very close (slightly above) the strong and sharp peak in the DOS. This peak at EF persists for all pressures from P=0 to 300 GPa and even above, almost as if EF were pinned at this peak, while other features of the DOS evolve.
Table 2 shows the Fermi level values of total and angular momentum components of the electronic densities of states across a wide range of volumes. Even though H3S may not be stable at lower pressures, we provide results for the large range P=0-210 GPa to observe the effect of interatomic distance on the electronic structure and coupling. While the total N(EF) shows a weak non-monotonic variation, the -components have a stronger lattice constant(pressure) dependence. As expected the sulfur -like states are the dominant component but a strong participation of character especially at high pressures is present, hybridizing with the also strong and nearly constant H contribution.
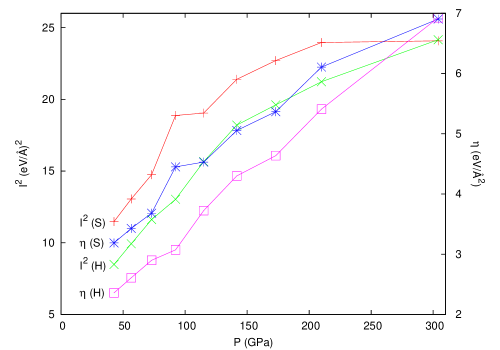
Now we discuss the electronic factor . It should be kept in mind that the relative importance for Tc of H versus S modes is not simply , but more like which is a factor of ten greater for 3H than for S). For hydrogen, which dominates the contribution to Tc only the channel is relevant at all pressures. The phase shift factor decreases with pressure. Fig. 3 illustrates the factor of two increase in from P=100 GPa to 300 GPa. This dramatic increase results from an even larger increase in the PDOS product , reflecting transfer of character to character. In the spherical harmonic expansion of the atomic wavefunctions this ‘’ character represent the expansion of tails of the orbitals on neighboring atoms that gives rise to the increased H-S hybridization under pressure.
| (a.u.) | N(EF) | S-s | S-p | S-d | H-s/atom |
|---|---|---|---|---|---|
| 5.6 | 6.93 | 0.325 | 1.74 | 0.751 | 0.435 |
| 5.8 | 6.43 | 0.286 | 1.53 | 0.605 | 0.405 |
| 6.0 | 6.47 | 0.274 | 1.46 | 0.528 | 0.415 |
| 6.2 | 6.42 | 0.253 | 1.18 | 0.528 | 0.462 |
| 6.4 | 6.79 | 0.259 | 1.36 | 0.417 | 0.455 |
| 6.6 | 7.15 | 0.255 | 1.38 | 0.375 | 0.482 |
| 6.8 | 7.56 | 0.254 | 1.42 | 0.339 | 0.513 |
| a (a.u.) | P (GPa) | S | S I | S | S I | S | S I | H | H I |
|---|---|---|---|---|---|---|---|---|---|
| 5.6 | 210 | 0.68 | 2.66 | 5.12 | 20.1 | 0.31 | 1.21 | 1.80 | 7.06 |
| 5.8 | 142 | 0.39 | 1.65 | 4.45 | 18.9 | 0.21 | 0.89 | 1.43 | 6.06 |
| 6.0 | 92 | 0.24 | 1.00 | 4.14 | 17.4 | 0.15 | 0.63 | 1.24 | 5.21 |
| 6.2 | 57 | 0.19 | 0.78 | 4.13 | 17.5 | 0.13 | 0.57 | 1.02 | 4.34 |
| 6.4 | 31 | 0.08 | 0.33 | 3.52 | 14.1 | 0.08 | 0.31 | 0.96 | 3.87 |
| 6.6 | 13 | 0.05 | 0.18 | 3.37 | 12.7 | 0.06 | 0.21 | 0.87 | 3.31 |
| 6.8 | 0 | 0.02 | 0.09 | 3.12 | 11.2 | 0.04 | 0.14 | 0.79 | 2.83 |
As noted above from our analysis of the results of Duan et al., the sulfur contribution is less important. As for H, the increase in occurs in spite of a decrease in the factor, by 30% from P=100 to P=300 GPa. Over this pressure range, the PDOS ratio product increases by 75%, giving a net increase by more than 50%. In addition, the S and even channels begin to contribute, reaching 20% of the total of at 300 GPa. Thus the increase is a composite effect of increase of both and character of S, which is reflected also in the growing phase shifts of these channels. These transfers of atomic character under pressure are consistent with general expectations of the evolution of atomic character under reduction of volume. Interpolating to 200 GPa to obtain =5.84 eV/Å2, =1.71 eV/Å2 (which must be multiplied by three), and using the frequency moments from Table 1, we obtain =2.6, thus T depending somewhat on the chosen value of =0.10-0.13. This value is very consistent with the value of Tc (above) obtained from our modeling of the Duan data. Though the numbers might vary for other low-Z hydrides (HnP, HnB, …) the lack of any special role of S in these results suggests there should also be a strong increase in Tc with pressure in other low-Z element hydrides.
A question of great interest is whether Tc increases further at higher pressure. The data presented in Table 3 provides the pressure dependence of the important quantities entering and . This data demonstrates that the strongest contributions arise for sulfur from the channel and for hydrogen from the channel. Note that for H one should multiply by three to account for the three H atoms in the unit cell.
Since dominates the sulfur contribution, we can focus on the H contribution alone. The total pressure derivative contains several contributions
| (5) | |||||
where is the strong coupling correction and is the exponential term in the Allen-Dynes equation. The pressure variation of the denominator is challenging to approximate without full calculations of the spectrum and . We have modeled the variation of the H spectrum by assuming the three 3-fold point optic modes are representative. The lower two of these modes are IR-active involving H-S bond stretch and bond bending modes, the hardest frequency is a silent mode with quadrupolar H motion with respect to S.
From calculations of these frequencies in the 240-270 GPa range using the ELK code we calculate a positive but modest pressure increase 1.910-3 GPa-1. From Fig. 3 we obtain =3.510-3 GPa-1, thus decreases with pressure approximately as -0.310-3/GPa. However, to our precision this is indistinguishable from zero, so the pressure derivative in Eq. 5 reduces to the first term, the frequency derivative. The resulting prediction is a small increase =0.4 K/GPa. This result disagrees in sign with Duan et al., who quoted a smaller (in magnitude) negative value of =-0.12 K/GPa from direct calculation, however both numbers are small compared to the large value of Tc itself, so there is no significant disagreement.
III Conclusions
The report by Drozdov, Eremets, and Troyan of Tc up to 190 K in HnS samples has breathed new life into the 50 year old expectation of high Tc in atomic H systems. Both Li et al. and Duan et al. had found that Eliashberg theory and linear response results for electron-phonon coupling account for Tc in the 80-200 K range for H2S and H3S at high pressure, and the analysis of Bernstein et al make H3S the primary candidate to be this record-high temperature superconductor. In this paper we have established that the coupling of H vibrations increases strongly for pressures up to and even beyond 210 GPa, and that 90+% of the coupling arises from H vibrations in this hydride that is stabilized by hybridizationbernstein with S. This picture is analogous to the finding of the essential contribution of H in the superconductor PdH at ambient pressure,PdH and the broader picture of Ashcroftashcroft of superconducting elemental H at high pressure. The theoretical isotope shift of Tc based on the harmonic approximation is not in agreement with the experimental result, suggesting substantial H anharmonicity will be necessary to understand before the picture is complete. Our picture, which relies on coupling across the large Fermi surface, is at odds with the hole superconductivity picture of Hirsch and Marsiglio.hirsch
Acknowledgments.
The authors acknowledge many insightful conversations on the theory and application of GG theory with the late B. L. Györffy, to whom we dedicate this paper. We acknowledge discussions with A. S. Botana, F. Gygi, and I. I. Mazin. M.J.M. was supported by the Office of Naval Research through the US Naval Research Laboratory’s basic research program. W.E.P. was supported by NSF award DMR-1207622-0. D.A.P. was supported by grant N00173-11-1-G002 from the U.S. Naval Research Laboratory.
References
- (1) A. P. Drozdov, M. I. Eremets, and I. A. Troyan, arXiv:1412.0460.
- (2) A. Schilling. M. Cantoni, J. D. Guo, and H. R. Ott, Nature 363, 6424 (1993).
- (3) C. W. Chu, L. Gao, F. Chen, Z. J. Huang, R. L. Meng, and Y. Y. Xue, Nature 365, 323 (1993).
- (4) References to the experimental literature are given by J. S. Schilling, Physica C 460-462, 182 (2007) and M. Debessai, J. J. Hamlin, and J. S. Schilling, Phys. Rev. B 78, 064519 (2008).
- (5) D. Kasinathan, J. Kuneš, A. Lazicki, H. Rosner, C. S. Yoo, R. T. Scalettar, and W. E. Pickett, Phys. Rev. Lett. 96, 047004 (2006).
- (6) D. Kasinathan, K. Koepernik, J. Kunes, H. Rosner, and W. E. Pickett, Physica C 460-462, 133-6 (2007).
- (7) L. Shi and D. A. Papaconstantopoulos, Phys. Rev. B 73, 184516 (2006).
- (8) Z. P. Yin, F. Gygi, and W. E. Pickett, Phys. Rev. B 80, 184515 (2009).
- (9) Z. P. Yin, S. Y. Savrasov, and W. E. Pickett, Phys. Rev. B 74, 094519 (2006).
- (10) S. Lei, D. A. Papaconstantopoulos, and M. J. Mehl, Phys. Rev. B 75, 024512 (2007).
- (11) N. Buckel and J. Wittig, Phys. Lett. 17, 187 (1965).
- (12) N. W. Ashcroft, Phys. Rev. Lett. 21, 1748 (1968).
- (13) N. W. Ashcroft, Phys. Rev. Lett. 92, 187002 (2004).
- (14) Y. Li et al., J. Chem. Phys. 140, 174712 (2014).
- (15) P. B. Allen and R. C. Dynes, Phys. Rev. B 12, 905 (1975).
- (16) D. Duan et al., Sci. Rep. 4, 6968 (2014).
- (17) G. D. Gaspari and B. L. Györffy, Phys. Rev. Lett. 28, 801 (1972).
- (18) D. A. Papaconstantopoulos and B. M. Klein, Ferroelectrics 16, 307 (1977); D. A. Papaconstantopoulos et al., Phys. Rev. B 15 4221 (1977).
- (19) J. J. Hopfield, Phys. Rev. 186, 443 (1969).
- (20) N. Bernstein, C. S. Hellberg, M. D. Johannes, I. I. Mazin, and M. J. Mehl, Phys. Rev. B 91, 060511(R) (2015).
- (21) D. J. Scalapino, J. R. Schrieffer, and J. W. Wilkins, Phys. Rev. 148, 263 (1966).
- (22) B. M. Klein and D. A. Papaconstantopoulos, J. Phys. F: Metal Phys. 6, 1135 (1976).
- (23) W. E. Pickett, Physica B+C 111B, 1 (1981).
- (24) The NRL LAPW code, originally developed by H. Krakauer and D. J. Singh, was used with Hedin-Lundqvist exchange-correlation. DOS results were generated from 285 k points in the irreducible Brillouin zone with the tetrahedron method. Total energies were fit to the Birch equation to obtain the P(V) equation of state.
- (25) http://elk.sourceforge.net
- (26) D. A. Papaconstantopoulos and B. M. Klein, Phys. Rev. Lett. 35, 110 (1975); B. M. Klein et al., Phys. Rev. Lett 39, 574 (1977); D. A. Papaconstantopoulos, B. M. Klein, E. N. Economou and L. L. Boyer Phys. Rev. B 17, 141 (1978).
- (27) J. E. Hirsch and F. Marsiglio, arXiv:1412.6251.