University of Jyvaskyla, Department of Mathematical Information Technology, P.O. Box 35, FI-40014 University of Jyvaskyla, Finland 22email: fedor.chernogorov[at]magister.fi, fedor.chernogorov[at]jyu.fi 33institutetext: S. Chernov, K. Brigatti and Tapani Ristaniemi 44institutetext: University of Jyvaskyla, Department of Mathematical Information Technology, P.O. Box 35, FI-40014 University of Jyvaskyla, Finland 44email: sergey.a.chernov[at]jyu.fi, kimmobrigatti[at]gmail.com, tapani.e.ristaniemi[at]jyu.fi
- 2G
- Generation
- 3G
- Generation
- 3GPP
- Generation Partnership Programme
- 4G
- Generation
- 5G
- Generation
- AA
- Anomaly Analysis
- AGNES
- AGglomerative NESting
- A-GNSS
- Assisted-Global Navigation Satellite System
- ANR
- Automatic Neighbor Relations
- AUC
- Area under Curve
- BCR
- Blocked Call Rate
- BER
- Bit Error Rate
- BIRCH
- Balanced Iterative Reducing and Clustering Using Hierarchies
- BLER
- Block Error Rate
- BS
- Base Station
- CBLOF
- Cluster-Based Local Outlier Factor
- CBR
- Case-Based Reasoning
- CCSR
- Call Completion Success Rate
- CLIQUE
- CLustering In QUEst
- CM
- Configuration Management
- COC
- Cell Outage Compensation
- COD
- Cell Outage Detection
- COMMUNE
- COgnitive network ManageMent under UNcErtainty
- CPICH
- Common Pilot Channel
- CQI
- Channel Quality Indicator
- C-RNTI
- Cell Radio Network Temporary Identifier
- CSI
- Channel State Indicator
- CSSR
- Call Setup Success Rate
- DBSCAN
- Density-based spatial clustering of applications with noise
- DCR
- Drop Call Ratio
- DIANA
- DIvisive ANAlysis
- DL
- Downlink
- DM
- Diffusion Maps
- DRX
- Discontinuous Reception
- eNB
- E-UTRAN NodeB
- EPS
- Evolved Packet System
- E-UTRAN
- Evolved Universal Terrestrial Radio Access Network
- FDD
- Frequency Division Duplexing
- FER
- Frame Error Rate
- FM
- Fault Management
- FPR
- False Positive Rate
- FRF
- Frequency Reuse Factor
- GSM
- Global System for Mobile Communications
- HARQ
- Hybrid Adaptive Repeat and reQuest
- HDP
- Hierarchical Dirichlet Process
- HLR
- Home Location Register
- HO
- Handover
- HOF
- Handover Failure
- HSPA
- High Speed Packet Access
- HSS
- Home Subscriber Server
- HW
- Hardware
- ID
- Identification
- ISCP
- Interference Signal Code Power
- ITU
- International Telecommunication Union
- KDD
- Knowledge Discovery in Databases
- KM
- Knowledge Mining
- K-NN
- K-Nearest Neighbors
- KPI
- Key Performance Indicator
- KQI
- Key Quality Indicator
- LOF
- Local Oulier Factor
- LTE
- Long Term Evolution
- LTE-A
- Long Term Evolution Advanced
- MAC
- Medium Access Control
- MCA
- Minor Component Analysis
- MDT
- Minimization of Drive Tests
- MLN
- Markov Logic Networks
- MME
- Mobility Management Entity
- MOS
- Mean Opinion Score
- MRO
- Mobility Robustness Optimization
- NE
- Network Element
- NGMN
- Next Generation Mobile Networks
- NM
- Network Management
- ns-3
- Network Simulator 3
- OAM
- Operations, Administration, and Maintenance
- OFD
- Operational Fault Detection
- OFDM
- Orthogonal Frequency-Division Multiplexing
- OPTICS
- Ordering points to identify the clustering structure
- OSS
- Operations Support System
- PCA
- Principal Component Analysis
- PCI
- Physical Cell Identity
- PESQ
- Perceptual Evaluation of Speech Quality
- PGW
- Packet Gateway
- PHR
- Power Headroom
- PI
- Performance Indicator
- PM
- Performance Monitoring
- PRACH
- Physical Random Access Channel
- QoE
- Quality of Experience
- QoS
- Quality of Service
- QPM
- Quality and Performance Management
- RA
- Recovery Analysis
- RACH
- Random Access Channel
- RAN
- Radio Access Network
- RAT
- Radio Access Technology
- RCEF
- RRC Connection Establishment Failure
- RF
- Radio Frequency
- RLF
- Radio Link Failure
- RNC
- Radio Network Controller
- ROC
- Receiver Operating Characteristic
- RRC
- Radio Resource Control
- RRM
- Radio Resource Management
- RSCP
- Received Signal Code Power
- RSRP
- Reference Signal Received Power
- RSRQ
- Reference Signal Received Quality
- RSSI
- Received Signal Strength Indicator
- SC
- Sleeping Cell
- SDCCH
- Stand-alone Dedicated Control Channel
- SGSN
- Serving GPRS Support Node
- SGW
- Serving Gateway
- SINR
- Signal to Interference plus Noise Ratio
- SIR
- Signal to Interference Ratio
- SOCRATES
- Self-Optimisation and self-ConfiguRATion in wirelEss networkS
- SOM
- Self-Organizing Maps
- SON
- Self-Organizing Network
- SORTE
- Second ORder sTatistic of the Eigenvalues
- SQM
- Service Quality Management
- STING
- STatistical INformation Grid
- SVD
- Singular Value Decomposition
- SVM
- Support Vector Machine
- SW
- Software
- TCE
- TRACE Collection Entity
- TNR
- True Negative Rate
- TTT
- Time to Trigger
- UE
- User Equipment
- UL
- Uplink
- UMTS
- Universal Mobile Telecommunications System
- UTRA
- Universal Terrestrial Radio Access
- UTRAN
- Universal Terrestrial Radio Access
- WCDMA
- Wideband Code Division Multiple Access
- WiFi
- Wireless Fidelity
Sequence-based Detection of Sleeping Cell Failures in Mobile Networks
Abstract
This article presents an automatic malfunction detection framework based on data mining approach to analysis of network event sequences. The considered environment is Long Term Evolution (LTE) for Universal Mobile Telecommunications System (UMTS) with sleeping cell caused by random access channel failure. Sleeping cell problem means unavailability of network service without triggered alarm. The proposed detection framework uses N-gram analysis for identification of abnormal behavior in sequences of network events. These events are collected with Minimization of Drive Tests (MDT) functionality standardized in LTE. Further processing applies dimensionality reduction, anomaly detection with K-Nearest Neighbors (K-NN), cross-validation, post-processing techniques and efficiency evaluation. Different anomaly detection approaches proposed in this paper are compared against each other with both classic data mining metrics, such as F-score and Receiver Operating Characteristic (ROC) curves, and a newly proposed heuristic approach. Achieved results demonstrate that the suggested method can be used in modern performance monitoring systems for reliable, timely and automatic detection of random access channel sleeping cells.
Keywords:
Data miningsleeping cell problem anomaly detection performance monitoring self-healing LTE networks1 Introduction
Modern cellular mobile networks are becoming increasingly diverse and complex, due to coexistence of multiple Radio Access Technologys, and their corresponding releases. Additionally, small cells are actively deployed to complement the macro layer coverage, and this trend will only grow. In the future this situation is going to evolve towards even higher complexity, as in 5G networks there will be much more end-user devices, served by different technologies, and connected to cells of different types. New applications and user behavior patterns are daily coming into play. In such environment network performance and robustness are becoming critical values for mobile operators. In order to achieve these goals, efficient flow of Quality and Performance Management (QPM) Hämälainen et al (2012), which is a sequence of fault detection, diagnosis and healing, should be developed and applied in the network in addition to other optimization functions.
Concept of Self-Organizing Network (SON) Networks (2008a, b) has been proposed to automate and optimize the most tedious manual tasks in mobile networks, including QPM. Automation is the key idea in SON and it has been proposed for self-configuration, self-optimization and self-healing in LTE and UMTS networks 3rd Generation Partnership Project (2009a); Hämälainen et al (2012); Scully et al (2008). In traditional systems detection, diagnosis and recovery of network failures is mostly manual task, and it is heavily based on pre-defined thresholds, aggregation and averaging of large amounts of performance data – so called Key Performance Indicators. Self-healing Ramiro and Hamied (2012), 3rd Generation Partnership Project (2014) automates the functions of QPM process to improve reliability of network operation. Though, self-healing is still among the least studied functions of SON at the moment, and the developed solutions and use cases require improvement prior to application in the real networks. This is especially important for non-trivial network failures such as sleeping cell problem Cheung et al (2006a, 2005); Hämälainen et al (2012). This is a special term used to denote a breakdown, which causes partial or complete degradation of network performance, and which is hard to detect with conventional QPM within reasonable time. Thus, in the research and standardization community automatic fault detection and diagnosis functions, enhanced with the most recent advancements in data analysis, are seen as the future of self-healing. Thus, development of improved self-healing functions for detection of sleeping cell problems, through application of anomaly detection techniques is of high importance nowadays. This article presents a novel framework based on N-gram analysis of MDT event sequences for detection of random access channel sleeping cells.
The rest of this paper is organized as follows. Section 2 describes common practices of quality and performance management in mobile networks, including MDT functionality, and advanced methods based on knowledge mining algorithms. Section 3 defines the concept of sleeping cell and its possible root cause failures. In Section 4 simulation environment, assumptions and random access channel problem are presented. Also Section 4 describes the generated and analyzed performance MDT data. Section 5 concentrates on the suggested sleeping cell detection knowledge mining framework. It includes overview of the applied anomaly detection methods: K-NN anomaly outlier scores, N-gram, minor component analyses, post-processing and data mining performance evaluation techniques. Section 6 is devoted to the actual research results. Data structures at different stages of analysis are shown, and efficiency of different post-processing methods is compared. In Section 7 the concluding remarks regarding the findings of the presented research are given.
2 Quality and Performance Management in Cellular Mobile Networks
Performance management in wireless networks includes three main components: data collection, analysis and results interpretation. Data gathering can be done either by aggregation of cell-level statistics - collection of KPIs, or collection of detailed performance data with drive tests. The main weaknesses in analysis of KPIs are that a lot of statistics is left out at the aggregation stage, due to averaging over time, element and because fixed threshold values are applied. Even thought drive test campaigns provide far more elaborate information regarding network performance, they are expensive to carry out and do not cover overall area of network operation. Root cause analysis is done manually in majority of cases, and because of that there is a room for more intelligent approaches to detection and diagnosis of network failures, e.g. with data mining and anomaly detection techniques. This would provide possibility to automate performance monitoring task furthermore.
2.1 Minimization of Drive Tests
Yet another way to improve network QPM is to collect a detailed performance database. This is enabled with MDT functionality standardized in Generation Partnership Programme (3GPP) 3rd Generation Partnership Project (2009b). MDT is designed for automatic collection and reporting of user measurements, where possible complemented with location information. Collected data is then reported to the serving cell, which in turn sends it to MDT server Hapsari et al (2012a). Thus, large amount of network and user performance is available for analysis. This is where the power of data mining and anomaly detection can be applied.
Specification describes several use cases for MDT: improvement of network coverage, capacity, mobility robustness and end user quality of service Hämälainen et al (2012). According to the standard, MDT measurements and reporting can be done both in idle and connected Radio Resource Control (RRC) modes. In logged MDT, User Equipment (UE) stores measurements in memory, and reporting is done at the next transition from idle to connected state. In immediate MDT, measurements are reported as soon as they are done through existing connection. In turn, there are two measurement modes in immediate MDT: periodic and event-triggered Hapsari et al (2012a). Periodic measurements are very useful for initial network deployment coverage and capacity verification as they provide detailed map of network performance, say in terms of signal propagation or throughput. The main disadvantage of periodic measurements is that they consume a lot of network and user resources. In contrast, event-triggered approach provides less information regarding the network status, but can be very efficient for mobility robustness and resource savings. In our study, immediate event-triggered MDT is used for collection of performance database. Table 1 presents the list of network events which triggered MDT measurements and reporting.
| PL PROBLEM - Physical Layer Problem 3rd Generation Partnership Project (2011). |
| RLF - Radio Link Failure Sesia et al (2011). |
| RLF REESTAB. - Connection reestablishment after RLF. |
| A2 RSRP ENTER - RSRP goes under A2 enter threshold. |
| A2 RSRP LEAVE - RSRP goes over A2 leave threshold. |
| A2 RSRQ ENTER - RSRQ goes over A2 enter threshold. |
| A3 RSRP - A3 event, according to 3GPP specification. |
| HO COMMAND - handover command received Sesia et al (2011). |
| HO COMPLETE - handover complete received Sesia et al (2011). |
2.1.1 Location Estimation in MDT
One of the important features of MDT is collection of geo-location information at the measurement time moments. Whenever UE location is provided in MDT report there are several ways to associated it with particular cell, such as: serving cell ID, dominance maps and a new approach based on target cell ID information.
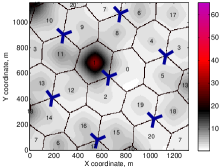
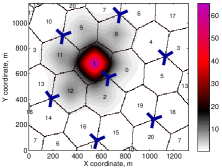
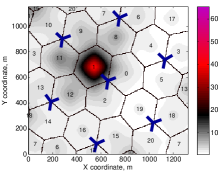
Serving cell ID is available with MDT event-triggered report, even for early releases of LTE. However, in case of coverage hole or problems with new connection establishment, this approach can lead to mistakes in UE location association, because the faulty cell would never become serving in the worst case scenario. This limits the usage of serving cell method for sleeping cell detection. To overcome the problem presented above, a dominance maps method can be used. This is a map, which demonstrates the E-UTRAN NodeB (eNB)111 Evolved Universal Terrestrial Radio Access Network (E-UTRAN) with dominating, i.e. strongest radio signal in each point of the network, see Fig. 1. Creation of dominance map requires information about path loss and slow fading.
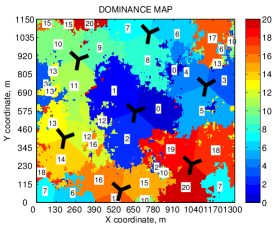
The main advantage of dominance maps is that mapping of cell ID to location coordinate of UE MDT measurement is very precise, and this results in higher accuracy of sleeping cell detection. The downside dominance maps approach is that it requires a lot of detailed input measurement information. Though, MDT functionality is one of the ways to create such maps fast and relatively simple. Additionally, more accurate user location information is going to be available with deployment of newer releases of mobile networks Commission (2011).
The last method for cell ID and UE report location association uses target cell ID feature. The main advantage of this approach is that it does not require serving cell ID, user geo-positioning location or knowledge about network dominance areas. This eases the requirements for MDT data collection in amount of details regarding user location. The problem of mapping on the basis of target cell ID, is that it might be useful for detection of only particular types of network problem, such random access Sleeping Cell (SC). Efficiency of this method for detection of other malfunctions is subject for further verification.
The key aspects which should be taken into account when selecting a location association method are accuracy and amount of information to create mapping between cell and user location.
2.2 Advanced data analysis approaches in QPM
Studies in advanced data analysis for QPM can be divided to several groups. In certain studies, the data reported by the users is used for the analysis. For instance, in Mueller et al (2008) authors suggest a method for detection of sleeping cells, caused by transmitted signal strength problem, on the basis of neighbor cell list information. Application of non-trivial pre- processing and different classification algorithms allowed to achieve relatively good accuracy in detection of cell hardware faults. However, the proposed anomaly detection system is prone to have relatively high false rate. In Turkka et al (2011) a method based on analysis of TRACE-based user data with diffusion maps is presented. More extensive application of diffusion maps for network performance monitoring can also be found in Kassis (2010).
Even though, user level statistics is more detailed, still majority of studies devoted to improvement of QPM rely on cell-level data. The first proposals of sleeping cell detection automation using statistical methods of network monitoring are presented in Cheung et al (2005, 2006a). Preparation of normal cell load profile and evaluation of the deviation in observed cell behavior is suggested as a way for identification of problematic cells. The idea of statistical approach has been further studied in Novaczki and Szilagyi (2011), Szilagyi and Novaczki (2012), Novaczki (2013), where a profile-based system for fault detection and diagnosis is proposed. Bayesian networks have also been applied for diagnosis and root cause probability estimation, given certain KPIs Khanafer et al (2008); Barco et al (2008, 2009, 2010). The complications here are preparation of correct probability model and appropriate KPI threshold parameters. More advanced data mining methods are applied to analysis of cell-level performance statistics, and novel ensemble methods of classification algorithms is proposed Ciocarlie et al (2013, 2014c). In Ciocarlie et al (2014a, b) application of classification and clustering methods for detection and diagnosis of strangely behaving network regions is presented. Some studies also consider neural network algorithms for detection of malfunctions Raivio et al (2003); Laiho et al (2005).
The largest drawback of processing cell level data is that collection of appropriate statistical base takes substantial amount of time, and can vary from days to months. This increases reaction time in case of outages and does not completely solve the problems of operators in optimization of their QPM. In order to overcome weaknesses of analysis based on cell KPIs, our studies are concentrated at the analysis of the user-level data, collected with immediate MDT functionality Hapsari et al (2012b); Johansson et al (2012). In the early works cell outage detection caused by signal strength problems (antenna gain failure) is studied Chernogorov (2010); Chernogorov et al (2011); Turkka et al (2012). This area matches the 3GPP use case called “cell outage detection” 3rd Generation Partnership Project (2014). Identification of the cell, in malfunction condition is done by means of analysis of numerical properties of multidimensional dataset. Each data point represents either periodic or event-triggered user measurement. Such methods as diffusion maps dimensionality reduction algorithm, k-means clustering and k-nearest neighbor classification methods are applied.
To increase robustness of the proposed solutions in MDT data analysis and make the developed detection system suitable for application in real networks, a more sophisticated experimental setup is considered. Sleeping cell caused by malfunction of random access channel, discussed in Section 3, does not produce coverage holes from perspective of radio signal, but still makes service unavailable to the subscribers. This problem is considered to be one of the most complex for mobile network operators, as detection of such failures may take days or even weeks, and negatively affects user experience Hämälainen et al (2012). To make fault detection framework more flexible and independent from user behavior, such as variable mobility and traffic variation, analysis of numerical characteristics of MDT data is substituted with processing of network event sequences with N-gram method. Network events can include different mobility or signaling related nature, such as A2, A3 or handover complete message Holma and Toskala (2011). Initial results in this area are presented in Chernogorov et al (2013).
3 Sleeping Cell Problem
Sleeping cell is a special kind of cell service degradation. It means malfunction resulting in network performance decrease, invisible for a network operator, but affecting user Quality of Experience (QoE). On one hand, detection of sleeping cell problem with traditional monitoring systems is complicated, as in many cases KPI thresholds do not indicate the problem. On the other hand fault identification can be very sluggish, as creation of cell behavior profile requires long time, as it is discussed in the previous section. Regular, less sophisticated types of failures usually produce cell level alarms to performance monitoring system of mobile network operator. In contrast, for sleeping cells degradation occurs seamlessly and no direct notification is given to the service provider.
In general, any cell can be called degraded in case if it is not 100% functional, i.e. its services are suffering in terms of quality, what in turn affects user experience. There are 3 distinguished extents of cell performance degradation Classification of sleeping cells, depending on the extent of performance degradation from the lightest, to the most severe Cheung et al (2005),Cheung et al (2006b): impared or deteriorated - smallest negative impact on the provided service, crippled - characterized by a severely decreased capacity, and catatonic - kind of outage which leads to complete absence of service in the faulty area, such cell does not carry any traffic.
Degradation can be caused by malfunction of different hardware or software components of the network. Depending on the failure type, different extent of performance degradation can be induced. In this study the considered sleeping cell problem is caused by Random Access Channel (RACH) failure. This kind of problem can appear due to RACH misconfiguration, excessive load or software/firmware problem at the eNB side Amirijoo et al (2009), Yilmaz et al (2011). RACH malfunction leads to inability of the affected cell to serve any new users, while earlier connected UEs still get served, as pilot signals are transmitted. This problem can be classified to crippled sleeping cell type, and with time it tends to become catatonic. In many cases RACH problem becomes visible for the operator only after a long observation time or even due to user complains. For this reason, it is very important to timely detect such cells and apply recovery actions.
3.0.1 Random Access Sleeping Cell
Malfunction of RACH can lead to
severe problems in network operation as it is used for connection
establishment in the beginning of a call, during handover to another
cell, connection re-establishment after handover failure or Radio Link Failure (RLF)
Sesia et al (2011). Malfunction of random access in cell with ID 1, is caused by erroneous behavior of T304 timer 3rd Generation Partnership Project (2011), which expires before random access procedure is finished. Thus, whenever UE tries to initiate random access to cell 1, this attempt fails. Malfunction area covers around 5 % of the overall network.
4 Experimental Setup
4.1 Simulation environment
Experimental environment is dynamic system level simulator of LTE network, designed according to 3GPP Releases 8, 9, 10 and partly 11. Throughput, spectral efficiency and mobility-related behavior of this simulator is validated against results from other simulators of several companies in 3GPP s36 (2012); Kolehmainen (2007); Kela (2007). Step resolution of the simulator is one Orthogonal Frequency-Division Multiplexing (OFDM) symbol. Methodology for mapping link level SINR to the system level is presented in Brueninghaus et al (2005). Simulation scenario is an improved 3GPP macro case 1 3rd Generation Partnership Project (2010) with wrap-around layout, 21 cells (7 base stations with 3-sector antennas), and inter-site distance of 500 meters. Modeling of propagation and radio link conditions includes slow and fast fading. Users are spread randomly around the network, so that on average there are 15 dynamically moving UEs per cell. The main configuration parameters of the simulated network are shown in Table 2.
| Parameter | Value | Parameter | Value |
|---|---|---|---|
| Cellular layout | Macro 21 Wrap-around | Number of cells | 21 |
| UEs per cell | 17 | Inter-Site Distance | 500 m |
| Link direction | Downlink | RRC IDLE mode | Disabled |
| User distribution in the network | Uniform | Maximum BS TX power | 46 dBm |
| Initial cell selection criterion | Strongest RSRP value | Handover margin (A3 margin) | 3 dB |
| Handover time to trigger | 256 ms | Hybrid Adaptive Repeat and reQuest (HARQ) | Enabled |
| Slow fading standard deviation | 8 dB | Slow fading resolution | 5 m |
| Simulation length | 572 s ( 9.5 min) | Simulation resolution | 1 time step = 71.43 |
| Network synchronicity mode | Asynchronous | Max number of UEs/cell | 20 |
| UE velocity | 30 km/h | Duration of calls | |
| Traffic model | Constant Bit Rate 320 kbps | Normal and Reference cases | Simulation without sleeping cell |
| Problematic case | Simulation with RACH problem in cell 1 | ||
| A2 RSRP Threshold | -110 | A2 RSRP Hysteresis | 3 |
| A2 RSRQ Threshold | -10 | A2 RSRQ Hysteresis | 2 |
4.2 Generated Performance Data
Generated performance data includes dominance map information and MDT log, which contains the following fields:
- •
-
•
UE ID. This is also categorical data;
-
•
UE location coordinates [m]. It is numerical, spatial data;
-
•
Serving and target cell ID – spatial, categorical data.
It is important to know the type of the analyzed data to construct efficient knowledge mining framework Chandola et al (2009); Han and Kamber (2006).
Simulations done for this study cover three types of network behavior: “normal” – network operation without random access sleeping cell; “problematic” – network with RACH failure in cell 1; “reference” – no sleeping cell, but different slow and fast fading maps, i.e. if compared to “normal” case, propagation-wise it is a different network. The latter case is used for validation purposes. All three of these cases have different mobility random seeds, i.e. call start locations and UE traveling paths are not the same. Each of the cases are represented with 6 data chunks. The training and testing phases of sleeping cell detection are done with pairs of MDT logs by means of K-fold approach Han and Kamber (2006). For example, “normal”-“problematic”, or “normal”-“reference” cases are considered. Thus, in total there are 72 unique combinations of analyzed MDT log pairs, which is rather statistically reliable data base.
5 Sleeping Cell Detection Framework
The core of the presented study is sleeping cell detection framework based on knowledge mining, Fig. 2. Both training and testing phases are done in accordance to the process of Knowledge Discovery in Databases (KDD), which includes the following steps Fayyad et al (1996), Han and Kamber (2006): data cleaning, integration from different sources, feature selection and extraction, transformation, pattern recognition, pattern evaluation and knowledge presentation. The constructed data analysis framework for sleeping cell detection is semi-supervised, because unlabeled error-free data is used for training of the data mining algorithms.
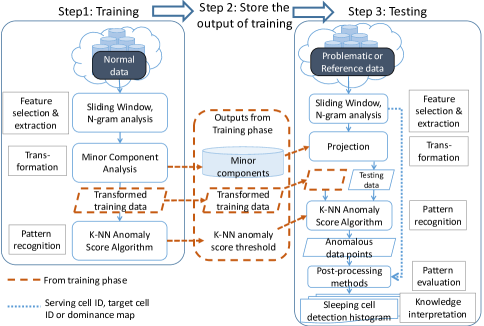
In testing phase problematic data is analyzed to detect abnormal behavior. Reference data is used for testing in order to verify how much the designed framework is prone to make false alarms.
5.1 Feature Selection and Extraction
Feature selection and extraction is the first step of sleeping cell detection. At this stage, input data is prepared for further analysis. Pre-processing is needed as reported UEs MDT event sequences have variable lengths, depending on the user call duration, velocity, traffic distribution and network layout.
5.1.1 Sliding Window Pre-processing
Sliding window approach Rabin (2010) allows to divide calls to sub-calls of constant length, an by that to unify input data. There are two parameters in sliding window algorithm: window size and step . After transformation, one sequence of events (a call) is represented by several overlapping (in case if ) sequences of equal sizes, except for the last sub-call, which is the remainder from modulo .
In the presented results overlapping sliding window size is 15, and the step is 10 events. Such setup allows to maintain the context of the data after processing Kassis (2010). The number of calls and sub-calls for all three data sets are shown in Table 3.
| Amount / Dataset | Normal | Problem | Reference |
|---|---|---|---|
| Calls (all) | 2530 | 1940 | 2540 |
| Sub-calls (all) | 7230 | 7134 | 7201 |
| Normal sub-calls | 6869 | 5932 | 6821 |
| Abnormal sub-calls | 361 | 1202 | 380 |
5.1.2 N-Gram Analysis
When input user-specific MDT log entries are standardized with sliding window method, the data is transformed from sequential to numeric format. It is done with N-gram analysis method , widely used e.g. for natural language processing and text analysis applications such as speech recognition, parsing, spelling, etc. Brown et al (1992); Nagao et al (1994); Cavnar and Trenkle (1994); Haidar and O’Shaughnessy (2012); Islam and Inkpen (2009). In addition, N-gram is applied for whole-genome protein sequences Ganapathiraju et al (2002) and for computer virus detection Choi et al (2011); David (2009).
N-gram is a sub-sequence of N overlapping items or units from a given original sequence. The items can be characters, letters, words or anything else. The idea of the method is to count how many times each sub-sequence occurs. This is the transformation from sequential to numerical space.
Here is an example of N-gram analysis application for two words: ‘performance’ and ‘performer’, , and a single unit is a character. The resulting frequency matrix after -gram processing is shown in Table 4.
| Analyzed word | pe | er | rf | or | rm | ma | me | an | nc | ce |
|---|---|---|---|---|---|---|---|---|---|---|
| performance | 1 | 1 | 1 | 1 | 1 | 1 | 0 | 1 | 1 | 1 |
| performer | 1 | 2 | 1 | 1 | 1 | 0 | 1 | 0 | 0 | 0 |
5.2 Dimensionality Reduction with Minor Component Analysis
Dimensionality reduction is applied to convert high- dimensional data to a smaller set of derived variables. In the presented study Minor Component Analysis (MCA) method is applied Luo et al (1997). This algorithm has been selected selected on the basis of comparison with other dimensionality reduction methods such as Principal Component Analysis (PCA) Jolliffe (2002) and diffusion maps Coifman and Lafon (2006). MCA extracts components of covariance matrix of the input data set and uses minor components (eigenvectors with the smallest eigenvalues of covariance matrix). 6 minor components are used as a basis of the embedded space. This number is defined by means of Second ORder sTatistic of the Eigenvalues (SORTE) method He et al (2009, 2010).
5.3 Pattern Recognition: K-NN Anomaly Score Ourlier Detection
In order to extract abnormal instances from the testing dataset K-NN anomaly outlier score algorithm is applied. In contrast with K-NN classification, method is not supervised, but semi- supervised, as the training data does not contain any abnormal labels. In general, there are two approaches concerning the implementation of this algorithm; anomaly score assigned to each point is either the sum of distances to k nearest neighbors Angiulli and Pizzuti (2002) or distance to k-th neighbor Ramaswamy et al (2000). The first method is employed in the presented sleeping cell detection framework, as it is more statistically robust. Thus, the algorithm assigns an anomaly score to every sample in the analyzed data based on the sum of distances to k nearest neighbors in the embedded space. Euclidean metric is applied as similarity measure. Points with the largest anomaly scores are called outliers. Separation to normal and abnormal classes is defined by threshold parameter , equal to percentile of anomaly scores in the training data.
Configuration parameters of data analysis algorithms in the presented sleeping cell detection framework are summarized in Table 5.
| Parameter | Value |
|---|---|
| Number of chunks in K-fold method per dataset | 6 |
| Sliding window size | 15 |
| Sliding window step | 10 |
| in N-gram algorithm | 2 |
| Number of nearest neighbors () in K-NN algorithm | 35 |
| Number of minor components | 6 |
5.4 Pattern Evaluation
The main goal of pattern evaluation is conversion of output information from K-NN anomaly score algorithm to knowledge about location of the network malfunction, i.e. RACH sleeping cell. This is achieved with post-processing of the anomalous data samples through analysis of their correspondence to particular network elements, such as UEs and cells. 4 post-processing methods are developed for this purpose. The essence of these methods, discussed throughout this section, is reflected in their names. The first part describes which geo-location information is used for mapping data samples to cells, e.g. dominance map information, target or serving cell ID. The second part denotes what is used as feature space for post-processing. It can be either “sub-calls”, when rows of the dataset are used as features or “2-gram”, when individual event pair combinations, i.e. columns of the dataset are used as features. The last, third part of the method name describes is analysis considers the difference between training and testing data (“deviation” keyword), or whether only information about testing set is used to build sleeping cell detection histogram.
Output from the post-processing methods described above is a set of values - sleeping cell scores, which correspond to each cell in the analyzed network. High value of this score means higher abnormality, and hence probability of failure. To achieve clearer indication of problematic cell presence, additional non-linear transformation is applied. It is called amplification, as it allows to emphasize problematic areas in the sleeping cell histogram. Sleeping cell score of each cell is divided by the sum of SC scores of all non-neighboring cells. Sleeping cell scores, received after post-processing and amplification are then normalized by the cumulative SC score of all cells in the network. Normalization is necessary to get rid of dependency on the size of the dataset, i.e. number of calls and users.
5.5 Knowledge Interpretation and Presentation
The final step of the data analysis framework is visualization of the fault detection results. It is done with construction of a sleeping cell detection histogram and network heat map. However, sleeping cell histogram does not show how cells are related to each other: are they neighbors or not, and which area of the network is causing problems. Heat map method shows more anomalous network regions with darker and larger spots, while normally operating regions are in light grey color. The main benefit of network heat map is that mobile network topology and neighbor relations between cells are illustrated.
5.5.1 Performance Evaluation
To apply data mining performance evaluation metrics labels of data points must be know. Cell is labeled as abnormal if its SC score deviates more than 3 (standard deviation of sleeping cell scores) from the mean SC of score in the network. Mean value and standard deviation of the sleeping cell scores are calculated altogether from 72 runs produced by K-fold method for “normal”-“problematic”, and “normal”-“reference” dataset pairs. Availability of the labels and the outcomes of different post-processing methods enables application of such data mining performance metrics as accuracy, precision, recall, F-score, True Negative Rate (TNR) and False Positive Rate (FPR) Guillet and Hamilton (2007). On the basis of these scores ROC curves are plotted.
In addition to the conventional performance evaluation metrics described above, a heuristic method is applied to complement the analysis. This approach measures how far is the achieved performance from the a priori known ideal solution. Performance of the sleeping cell detection algorithm can be described by a point in the space “sleeping cell magnitude”-“cumulative standard deviation”. “Sleeping cell magnitude” is the highest sleeping cell score, and a sum of all sleeping cell scores is “cumulative standard deviation”. This plane contains two points of interest: in case of malfunctioning network, the ideal sleeping cell detection algorithm would have coordinate . In case of error-free network, the ideal performance is point . Thus, the smaller the Euclidean distance between the achieved and ideal sleeping cell histograms, the better the performance of the sleeping cell detection algorithm.
6 Results of Sleeping Cell Detection
This section presents the results of sleeping cell detection for different post-processing algorithms. In addition, the data at different stages of the detection process is illustrated. Then performance metrics are used to compare effectiveness of the developed SC identification algorithms.
6.1 Pre-processing and K-NN Anomaly Score Calculations
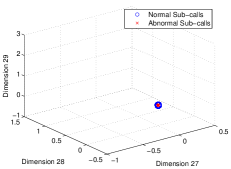
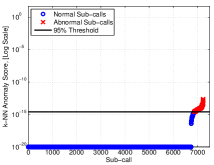
After pre-processing with sliding window and N-gram methods, and transformation with MCA, training MDT data is processed with K-NN anomaly score algorithm. As it is discussed in section 5.3, the anomaly score threshold, used for separation of data points to normal and abnormal classes, is selected to be percentile of outlier score in training data. Shape of normal training dataset in the embedded space is shown in Fig. 3a, and sorted anomaly outlier scores are presented in Fig. 3b. It can be seen that data points are very compact in the embedded space, and because of that there is no big difference in the anomaly score values.
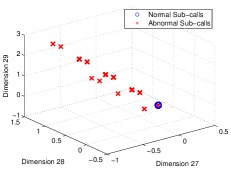
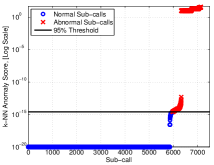
The main goals of analyzing testing dataset are to find anomalies, detect sleeping cell, and keep the false alarm rate as low as possible. At the testing phase either problematic or reference data are analyzed. After the same pre-processing stages as for training, the testing data is represented in the embedded space. When testing data is problematic dataset some of the samples are significantly further away from the main dense group of points, Fig. 4. These abnormal points are labeled as outliers, and the corresponding anomaly scores for these samples are much higher, as it can seen from Fig. 4b. On the other hand, some of the points with relatively low anomaly score are above the abnormality threshold. This means that there is still certain percentage of false alarms, i.e. some “good” points are treated as “bad”. The extent of negative effect caused by false alarms is discussed further in Section 6.4. Though, there is no opposite behavior referred to as “miss-detection” - none of the anomalous points are treated as normal.
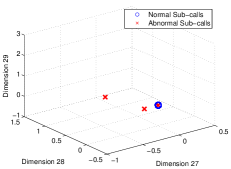
Validation of the data mining framework is done by using error-free reference dataset as testing data. No real anomalies are present in the network behavior. Reference testing data in the embedded space and corresponding anomaly outlier scores are shown in Fig. 5. Only few points can be treated as outliers, and in general the shapes of normal (Fig. 3a) and reference (Fig. 5a) datasets in the embedded space are very similar. Anomaly outlier scores of the reference testing data is low for all points, except 2 outliers.

6.2 Application of Post-Processing Methods for Sleeping Cell Detection
After training and testing phases certain sub-calls are marked as anomalies. The next step is conversion of this information to knowledge about location of malfunctioning cell or cells, and this is done through post-processing described in Section 5.4.
6.2.1 Detection based on Dominance Cell Sub-Call Deviation
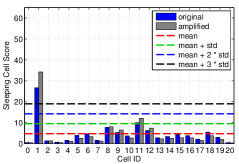
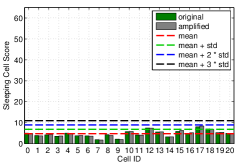
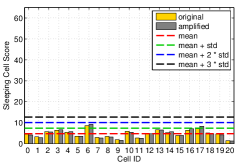
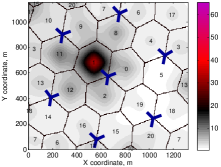
In our earlier study Chernogorov et al (2013) post-processing based on dominance cells and call deviation for sleeping cell detection is presented. One problem of using calls as samples is that, in case if the duration of the analyzed user call is long, the corresponding number of visited cells is large, especially for fast UEs. Hence, even if certain call is classified as abnormal, it is very hard to say which cell has anomalous behavior. To overcome this problem, analysis is done for sub-calls, derived with sliding window method, see Section 5.1.1. Majority of sub-calls contain the same number of network events, and the length of the analyzed sequence is short enough to identify the exact cell, with problematic behavior. Deviation measures the difference between training and testing data, and it is used to sleeping cell detection histogram, presented in Fig. 6a. From this figure, it can be seen that abnormal sub-calls are encountered more frequently in the area of dominance of cell 1, which has the highest deviation. One can see that there are 2 types of bars - colorful (in this case blue) and grey. The second variant implies additional post-processing step - amplification, described in Section 5.4. In addition to cell 1, its neighboring cells 8, 9, 11 and 12 also have increased deviation values, as it can be seen from the network heat map in Fig. 6c.
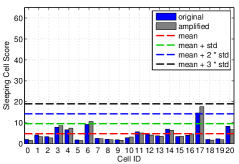
6.2.2 Detection based on Dominance Cell 2-Gram Deviation
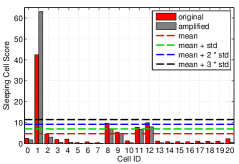
In this method problematic network regions are found through comparison of occurrence frequencies, normalized by the total number of users, in training and testing datasets. In case there is a big increase or decrease, the cell associated with these changes is marked as abnormal. From sleeping cell detection histogram in Fig. 7a it can be that cell 1 has a clear difference in number of 2-gram occurrences in testing data, if compared to training data. This happens because handovers toward this cell fail. Due to this fact 2-gram sequence with events related to handovers become imbalanced in testing data if compared to training data. For instance, 2-grams like Handover (HO) Command - HO Complete and HO Complete - A2 RSRP ENTER, become very rare. On the other hand, 2- gram HO Command - A2 RSRP ENTER, which can be treated as indication of non-successful handovers, in opposite becomes very popular in testing data, while in training data it does not exist at all. Among the neighbors of problematic cell 1, only cell 11 has slightly increased sleeping cell score.
6.2.3 Detection based on Dominance Cell 2-Gram Symmetry Deviation
This post-processing method analyzes the symmetry imbalance of network events 2-grams. Information about number of 2-gram directed to the cell, and from the cell is extracted from the training. In case if in the testing data the balance (number of 2-grams, which start in this cell, )Thus, only 2-grams, which occur at cell borders, i.e. in the dominance area of 2 cells, are considered. It means that if in the training data, the number of handovers from Cell A to Cell B, and from Cell B to Cell A, is roughly the same, this cell has balanced 2-gram it can concluded that symmetry of this particular 2-gram is skewed. disturbed comparing to the training data. Most common types of 2-grams which are analyzed with this method are related to handovers, e.g. A3 - HO COMMAND sequences.
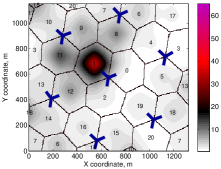
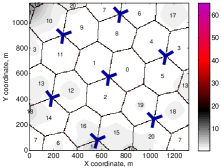
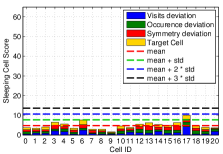
From Fig. 8 it can be seen that Dominance Cell 2-Gram Symmetry Deviation finds sleeping cell 1, while its neighboring cells 8, 9, 11 and 12 have suspiciously high sleeping cell score, if compared to other cells in the network.
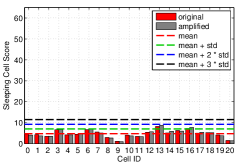
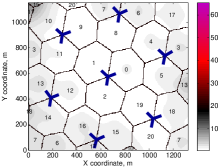
Comparison of symmetry analysis method with two previously described post-processing approaches shows that this method is very efficient in detecting sleeping cell and its neighbors. At the same time stability, i.e. false alarm rate, of this method is also very good, as it can be seen from Fig. 8b.
6.2.4 Detection based on Target Cell Sub-Calls
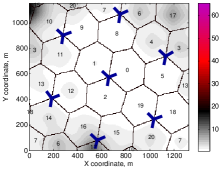
As it is discussed in Section 5.4, deviation between training and testing data is not calculated in this method. Extensive location information, like dominance map information, is not required for sleeping cell detection with target cell sub-call method. The sleeping cell detection histogram, presented in Fig. 9, is constructed by counting all unique target cell IDs for each anomalous sub-call. It can be clearly seen that cell 1 is successfully detected. Neighboring cells 8, 9, 11 and 12 also contain indication of malfunction in this area, as it can be noticed from heat map, shown in Fig. 9b.
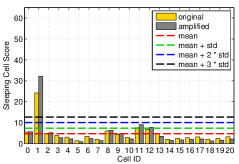
For this method, the SC score of cell 1 is slightly lower than for the post-processing methods, based on dominance cell deviation. Another shortcoming is that target cell sub-call method is more prone to trigger false alarms. This can be seen from the results when reference data is used as testing, Fig. 9b. Sleeping cell score of cell 6 is reaching threshold of mean plus 2 standard deviations. For cells 16 and 17 SC scores are also quite high, as it can also be noticed from Fig. 9d. On the other hand, target cell sub-call method is much simpler, and requires significantly less information about user event occurrence location.
6.3 Combined Method of Sleeping Cell Detection
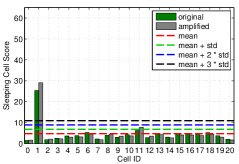
The idea of this method is to create a cumulative sleeping cell detection histogram based on the results from all 4 post-processing methods described above. The resulting amplified SC histogram is shown in Fig. 10. Cell 1 has sleeping cell score well over threshold. Neighboring cells 8, 9, 11, 12 also have increased sleeping cell scores comparing to other cells.
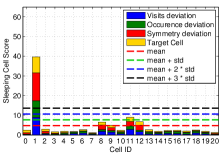

Reference data used as testing also demonstrates stability of the combined approach – no false alarms are triggered. Though, it can be seen that usage of target cell sub-call method introduces some noise. It is important to note that post-processing methods are applied with equal weights. However, it is possible to emphasize more accurate method by increasing its weight, and penalize the unreliable, by reducing its weight. Though, selection of optimal weights is a matter of a separate study and is not discussed in this article.
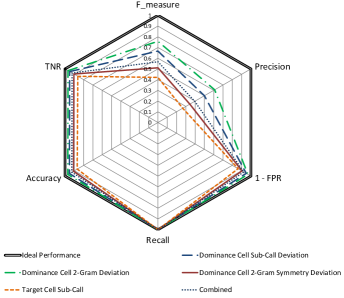
6.4 Comparison of Algorithms and Performance Evaluation
The post-processing methods discussed above have their own advantages and disadvantages. Traditional data mining metrics, discussed in Section 5.5.1, are applied for quantitative comparison of sleeping cell detection methods, Fig. 11a. Ideal performance is presented with the solid double black line, and corresponds to the maximum area of the hexagon. Formally, according to the values of the metrics, Dominance Cell 2-gram Deviation and Dominance Cell Sub-call Deviation methods, demonstrate better performance than other post-processing techniques. However, high false positive rate for Dominance Cell 2-gram Symmetry Deviation and Target Cell Sub-call methods does not necessarily mean that these methods are worse. The reason is that neighboring cells of cell 1 exceed the 3 threshold. This happens because adjacent cells are not completely independent, and are affected by malfunction in one of the neighbors. Thus, Dominance Cell 2-gram Symmetry Deviation and Target Cell Sub-call methods can be treated as more sensitive than the others. The observed behavior emphasizes that amplification should be complemented by some other ways to to take network topology into account. However this is a subject for further study.
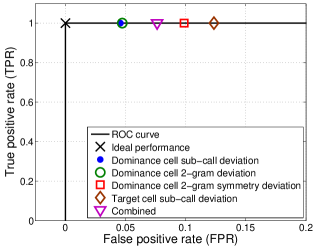
ROC curve of of the designed sleeping cell detection algorithm is presented in Fig. 11b. The proposed framework is able to create such a projection of the MDT data, that in the new space normal data and anomalous data points are fully separable and do not overlap. Hence, the suggested data mining framework for sleeping cell detection is successful, and for reduction of false alarm rate it is necessary to invent a better separation rule, than 3 deviation from mean SC score.
Another method for comparison of post-processing algorithms is a heuristic approach described in Section 5.5.1. According to this method, more accurate post-processing algorithm is the one, which has the smallest distance to the ideal solution point for either problematic or error-free case. Cumulative distances for different algorithms in non-amplified and amplified cases are presented in Fig. 12a and Fig. 12b correspondingly.
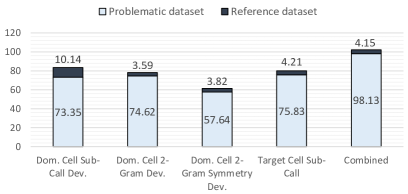
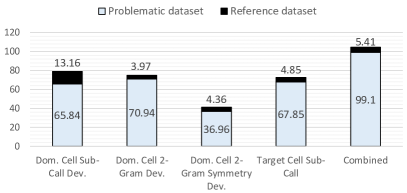
It can be seen that Dominance Cell 2-Gram Symmetry Deviation method has the smallest distance from the ideal detection case. Thus, from perspective of the heuristic performance evaluation approach this method outperforms other post-processing methods.
7 Conclusions
This article presents a novel sleeping cell detection framework based on knowledge mining paradigm. MDT reports are used for the detection of a random access channel malfunction in one of the network cells. Experimental setup implements a simulated LTE network, used to generate a diverse statistics base with several thousands of user calls and tens of thousands of MDT samples. Investigated type of sleeping cell problem is rather complex, and detection of this problem has never been studied before.
The designed knowledge mining framework is semi-supervised and has centralized architecture from perspective of self-organizing networks. The heart of the developed detection framework is the analysis of sequences with N-gram method in the series of user event-triggered measurement MDT reports. Data pre-processing with sliding window transformation method allows to make the statistics base more reliable through standardization of the input event sequences. 2-gram analysis is used to convert sequential data to numeric format in the new feature space. To simplify analysis of the data in the new space, dimensionality reduction with minor component analysis method is applied. K-NN anomaly score detection algorithm is used to find the outliers in the data and using this information, anomalous data points are converted with post-processing to the knowledge about location of the problematic regions in the network. Comparison of different location mapping post-processing methods is done, additionally, so called amplification is used to take into account neighbor relations between cells and network topology, for improvement of sleeping cell detection performance.
Results demonstrate, that the suggested framework allows for efficient detection of the random access sleeping cell problem in the network. Evaluation shows that post-processing method named Dominance Cell 2-Gram Symmetry Deviation demonstrates the best combination of performance results. Amplification also proves to be the very efficient approach for improvement of the detection quality. Results of this work lay grounds and suggest exact methods for building advanced performance monitoring systems in modern mobile networks. One of the possible directions in this area is extensive usage of data mining techniques in general, and anomaly detection in particular. New systems of network maintenance would allow to address growing complexity and heterogeneity of modern mobile networks, and especially Generation (5G).
Future work in this field includes validation of the developed system in more complex scenarios, detection of several or different types of malfunctions, and substitution of semi-supervised approach with unsupervised. The ultimate goal is to achieve accurate and timely detection of different sleeping cell types in highly dynamic mobile network environments. Obviously, low level of false alarms must be supported, and at the same time significant increase of computational complexity should be avoided.
Acknowledgments
Authors would like to thank colleagues from Magister Solutions, Nokia and University of Jyväskylä for collaboration, their valuable feedback regarding this research, and peer reviews. Work on this study has been partly funded by MIPCOM project, Graduate School in Electronics, Telecommunications and Automation (GETA), and Doctoral Program in Computing and Mathematical Sciences (COMAS).
References
- s36 (2012) (2012) Technical Report 3rd Generation Partnership Project; Technical Specification Group Radio Access Network; Evolved Universal Terrestrial Radio Access (E-UTRA); Mobility enhancements in heterogeneous networks (Release 11). 3GPP TR 36.839 V11.1.0
- Amirijoo et al (2009) Amirijoo M, Frenger P, Gunnarsson F, Moe J, Zetterberg K (2009) On self-optimization of the random access procedure in 3g long term evolution. In: Integrated Network Management-Workshops, 2009. IM ’09. IFIP/IEEE International Symposium on, pp 177–184
- Angiulli and Pizzuti (2002) Angiulli F, Pizzuti C (2002) Fast outlier detection in high dimensional spaces. In: Proceedings of the 6th European Conference on Principles of Data Mining and Knowledge Discovery, Springer-Verlag, London, UK, UK, PKDD ’02, pp 15–26
- Barco et al (2008) Barco R, Lazaro P, Diez L, Wille V (2008) Continuous versus discrete model in autodiagnosis systems for wireless networks. Mobile Computing, IEEE Transactions on 7(6):673–681, DOI 10.1109/TMC.2008.23
- Barco et al (2009) Barco R, Lazaro P, Wille V, Diez L, Patel S (2009) Knowledge acquisition for diagnosis model in wireless networks. Expert Systems with Applications 36(3, Part 1):4745 – 4752
- Barco et al (2010) Barco R, Wille V, Diez L, Toril M (2010) Learning of model parameters for fault diagnosis in wireless networks. Wireless Networks 16(1):255–271, DOI 10.1007/s11276-008-0128-z
- Brown et al (1992) Brown PF, deSouza PV, Mercer RL, Pietra VJD, Lai JC (1992) Class-based n-gram models of natural language. Computational Linguistics 18:467–479
- Brueninghaus et al (2005) Brueninghaus K, Astely D, Salzer T, Visuri S, Alexiou A, Karger S, Seraji GA (2005) Link performance models for system level simulations of broadband radio access systems. In: IEEE 16th International Symposium on Personal, Indoor and Mobile Radio Communications, 2005. PIMRC 2005., vol 4, pp 2306 –2311 Vol. 4, DOI 10.1109/PIMRC.2005.1651855
- Cavnar and Trenkle (1994) Cavnar WB, Trenkle JM (1994) N-gram-based text categorization. In: In Proceedings of SDAIR-94, 3rd Annual Symposium on Document Analysis and Information Retrieval, pp 161–175
- Chandola et al (2009) Chandola V, Banerjee A, Kumar V (2009) Anomaly detection: A survey. ACM Comput Surv 41(3):15:1–15:58
- Chernogorov (2010) Chernogorov F (2010) Detection of sleeping cells in long term evolution mobile networks. Master’s thesis, University of Jyväskylä, Finland
- Chernogorov et al (2011) Chernogorov F, Turkka J, Ristaniemi T, Averbuch A (2011) Detection of sleeping cells in LTE networks using diffusion maps. In: Vehicular Technology Conference (VTC Spring), 2011 IEEE 73rd, pp 1–5
- Chernogorov et al (2013) Chernogorov F, Brigatti K, Ristaniemi T, Chernov S (2013) N-gram analysis for sleeping cell detection in lte networks. In: Proceedings of the 38th International Conference on Acoustics, Speech, and Signal Processing (ICASSP)
- Cheung et al (2005) Cheung B, Kumar GN, Rao SA (2005) Statistical algorithms in fault detection and prediction: Toward a healthier network. Bell Labs Technical Journal 9(4):171–185
- Cheung et al (2006a) Cheung B, Fishkin SG, Kumar GN, Rao SA (2006a) Method of monitoring wireless network performance. Tech. rep., Los Angeles, CA, uS Patent 2006/0063521 A1, CN1753541A, EP1638253A1
- Cheung et al (2006b) Cheung B, Fishkin SG, Kumar GN, Rao SA (2006b) Method of monitoring wireless network performance. US Patent 2006/0063521 A1, CN1753541A, EP1638253A1
- Choi et al (2011) Choi J, Kim H, Choi C, Kim P (2011) Efficient malicious code detection using n-gram analysis and svm. In: Barolli L, Xhafa F, Takizawa M (eds) NBiS, IEEE Computer Society, pp 618–621
- Ciocarlie et al (2013) Ciocarlie G, Lindqvist U, Novaczki S, Sanneck H (2013) Detecting anomalies in cellular networks using an ensemble method. In: Network and Service Management (CNSM), 2013 9th International Conference on, pp 171–174, DOI 10.1109/CNSM.2013.6727831
- Ciocarlie et al (2014a) Ciocarlie G, Cheng CC, Connolly C, Lindqvist U, Nitz K, Novaczki S, Sanneck H, Naseer-ul Islam M (2014a) Anomaly detection and diagnosis for automatic radio network verification. In: 6th International Conference on Mobile Networks and Management, MONAMI 2014
- Ciocarlie et al (2014b) Ciocarlie G, Cheng CC, Connolly C, Lindqvist U, Novaczki S, Sanneck H, Naseer-ul Islam M (2014b) Managing scope changes for cellular network-level anomaly detection. In: Wireless Communications Systems (ISWCS), 2014 11th International Symposium on, pp 375–379, DOI 10.1109/ISWCS.2014.6933381
- Ciocarlie et al (2014c) Ciocarlie G, Lindqvist U, Nitz K, Novaczki S, Sanneck H (2014c) On the feasibility of deploying cell anomaly detection in operational cellular networks. In: Network Operations and Management Symposium (NOMS), 2014 IEEE, pp 1–6, DOI 10.1109/NOMS.2014.6838305
- Coifman and Lafon (2006) Coifman RR, Lafon S (2006) Diffusion maps. Applied and Computational Harmonic Analysis 21(1):5 – 30
- Commission (2011) Commission FC (2011) Small Entity Compliance Guide: Wireless E911 Location Accuracy Requirements. Federal Communications Commission: Report and Order FCC 10-176 PS Docket No 07-114 p 3
- David (2009) David G (2009) Anomaly detection and classification via diffusion processes in hyper-networks. PhD thesis, Tel-Aviv University, Tel-Aviv, Israel
- Fayyad et al (1996) Fayyad U, Piatetsky-Shapiro G, Smyth P, Widener T (1996) The kdd process for extracting useful knowledge from volumes of data. Communications of the ACM 39:27–34
- Ganapathiraju et al (2002) Ganapathiraju M, Weisser D, Rosenfeld R, Carbonell J, Reddy R, Klein-Seetharaman J (2002) Comparative n-gram analysis of whole-genome protein sequences. In: Proceedings of the second international conference on Human Language Technology Research, Morgan Kaufmann Publishers Inc., San Francisco, CA, USA, HLT ’02, pp 76–81
- 3rd Generation Partnership Project (2009a) 3rd Generation Partnership Project (2009a) Evolved universal terrestrial radio access network (e-utran); self-configuring and self-optimizing network (son) use cases and solutions (release 9). Tech. Rep. TR 36.902, 3GPP
- 3rd Generation Partnership Project (2009b) 3rd Generation Partnership Project (2009b) Technical specification group radio access network; study on minimization of drive-tests in next generation networks (release 9). Tech. Rep. TR 36.805, 3GPP
- 3rd Generation Partnership Project (2010) 3rd Generation Partnership Project (2010) 3gpp; tsg radio access network; further advancements for e-utra physical layer aspects (release 9). Tech. Rep. TR 36.814, 3GPP
- 3rd Generation Partnership Project (2011) 3rd Generation Partnership Project (2011) Technical specification group radio access network; evolved universal terrestrial radio access (e-utra); radio resource control (rrc); protocol specification (release 10). Tech. Rep. TS 36.331, 3GPP
- 3rd Generation Partnership Project (2014) 3rd Generation Partnership Project (2014) Self-organizing networks (son); self-healing concepts and requirements (release 12). Tech. rep., 3GPP TS 32.541 V12.0.0
- Guillet and Hamilton (2007) Guillet F, Hamilton HJ (eds) (2007) Quality Measures in Data Mining, Studies in Computational Intelligence, vol 43. Springer
- Haidar and O’Shaughnessy (2012) Haidar M, O’Shaughnessy D (2012) Topic n-gram count language model adaptation for speech recognition. In: Spoken Language Technology Workshop (SLT), 2012 IEEE, pp 165–169, DOI 10.1109/SLT.2012.6424216
- Hämälainen et al (2012) Hämälainen S, Sanneck H, Sartori C (2012) LTE Self-Organising Networks (SON): Network Management Automation for Operational Efficiency, 1st edn. Wiley Publishing
- Han and Kamber (2006) Han J, Kamber M (2006) Data Mining: Concepts and Techniques, Second edition, vol 54. Morgan Kaufmann
- Hapsari et al (2012a) Hapsari W, Umesh A, Iwamura M, Tomala M, Gyula B, Sebire B (2012a) Minimization of drive tests solution in 3gpp. Communications Magazine, IEEE 50(6):28–36
- Hapsari et al (2012b) Hapsari W, Umesh A, Iwamura M, Tomala M, Gyula B, Sebire B (2012b) Minimization of drive tests solution in 3GPP. Communications Magazine, IEEE 50(6):28–36
- He et al (2009) He Z, Cichocki A, Xie S (2009) Efficient method for tucker3 model selection. Electronics Letters 45:805
- He et al (2010) He Z, Cichocki A, Xie S, Choi K (2010) Detecting the number of clusters in n-way probabilistic clustering. IEEE Trans Pattern Anal Mach Intell 32(11):2006–2021
- Holma and Toskala (2011) Holma H, Toskala A (2011) LTE for UMTS: Evolution to LTE-Advanced, 2nd edn. Wiley Publishing
- Islam and Inkpen (2009) Islam A, Inkpen D (2009) Real-word spelling correction using Google Web 1t n-gram with backoff. In: Natural Language Processing and Knowledge Engineering, 2009. NLP-KE 2009. International Conference on, pp 1 –8, DOI 10.1109/NLPKE.2009.5313823
- Johansson et al (2012) Johansson J, Hapsari W, Kelley S, Bodog G (2012) Minimization of drive tests in 3gpp release 11. Communications Magazine, IEEE 50(11):36–43
- Jolliffe (2002) Jolliffe I (2002) Principal Component Analysis. Springer Series in Statistics, Springer
- Kassis (2010) Kassis E (2010) Anomaly-based error detection in base station data. Master’s thesis, Tel-Aviv University, Israel
- Kela (2007) Kela P (2007) Downlink channel quality indication for evolved universal terrestrial radio access network. Master’s thesis, University of Jyväskylä, Finland
- Khanafer et al (2008) Khanafer R, Solana B, Triola J, Barco R, Moltsen L, Altman Z, Lazaro P (2008) Automated diagnosis for umts networks using bayesian network approach. Vehicular Technology, IEEE Transactions on 57(4):2451–2461, DOI 10.1109/TVT.2007.912610
- Kolehmainen (2007) Kolehmainen N (2007) Downlink packet scheduling performance in evolved universal terrestrial radio access network. Master’s thesis, University of Jyväskylä, Finland
- Laiho et al (2005) Laiho J, Raivio K, Lehtimaki P, Hatonen K, Simula O (2005) Advanced analysis methods for 3g cellular networks. Wireless Communications, IEEE Transactions on 4(3):930–942, DOI 10.1109/TWC.2005.847088
- Luo et al (1997) Luo FL, Unbehauen R, Cichocki A (1997) A minor component analysis algorithm. Neural Networks 10(2):291–297
- Mueller et al (2008) Mueller CM, Kaschub M, Blankenhorn C, Wanke S (2008) A cell outage detection algorithm using neighbor cell list reports. In: Hummel K, Sterbenz J (eds) Self-Organizing Systems, Lecture Notes in Computer Science, vol 5343, Springer Berlin Heidelberg, pp 218–229
- Nagao et al (1994) Nagao, Makoto, Mori, Shinsuke (1994) A new method of n-gram statistics for large number of n and automatic extraction of words and phrases from large text data of japanese. In: Proceedings of the 15th conference on Computational linguistics - Volume 1, Association for Computational Linguistics, Stroudsburg, PA, USA, COLING ’94, pp 611–615
- Networks (2008a) Networks NGM (2008a) Recommendation on SON and O&M Requirements. Tech. rep., NGMN, URL "http://www.ngmn.org/"
- Networks (2008b) Networks NGM (2008b) Use Cases related to Self Organising Network, overall description. Tech. rep., NGMN, URL "http://www.ngmn.org/"
- Novaczki (2013) Novaczki S (2013) An improved anomaly detection and diagnosis framework for mobile network operators. In: Design of Reliable Communication Networks (DRCN), 2013 9th International Conference on the, pp 234–241
- Novaczki and Szilagyi (2011) Novaczki S, Szilagyi P (2011) Radio channel degradation detection and diagnosis based on statistical analysis. In: Vehicular Technology Conference (VTC Spring), 2011 IEEE 73rd, pp 1–2
- Rabin (2010) Rabin N (2010) Data mining dynamically evolving systems via diffusion methodologies. PhD thesis, Tel-Aviv University, Tel-Aviv, Israel
- Raivio et al (2003) Raivio K, Simula O, Laiho J, Lehtimaki P (2003) Analysis of mobile radio access network using the self-organizing map. In: Integrated Network Management, 2003. IFIP/IEEE Eighth International Symposium on, pp 439–451, DOI 10.1109/INM.2003.1194197
- Ramaswamy et al (2000) Ramaswamy S, Rastogi R, Shim K (2000) Efficient algorithms for mining outliers from large data sets. SIGMOD Rec 29(2):427–438
- Ramiro and Hamied (2012) Ramiro J, Hamied K (2012) Self-Organizing Networks (SON): Self-Planning, Self-Optimization and Self-Healing for GSM, UMTS and LTE, 1st edn. Wiley Publishing
- Scully et al (2008) Scully N, et al (2008) D2.1: Use cases for self-organising networks. URL http://www.fp7-socrates.eu
- Sesia et al (2011) Sesia S, Baker M, Toufik I (2011) LTE - The UMTS Long Term Evolution: From Theory to Practice. John Wiley & Sons
- Szilagyi and Novaczki (2012) Szilagyi P, Novaczki S (2012) An automatic detection and diagnosis framework for mobile communication systems. IEEE Transactions on Network and Service Management 9(2):184–197
- Turkka et al (2011) Turkka J, Ristaniemi T, David G, Averbuch A (2011) Anomaly detection framework for tracing problems in radio networks. In: The 10th International Conference on Networks, ICN 2011
- Turkka et al (2012) Turkka J, Chernogorov F, Brigatti K, Ristaniemi T, Lempiäinen J (2012) An approach for network outage detection from drive-testing databases. Journal of Computer Networks and Communications
- Yilmaz et al (2011) Yilmaz ONC, Hämälainen J, Hämälainen S (2011) Self-optimization of random access channel in 3rd generation partnership project long term evolution. Wirel Commun Mob Comput 11(12):1507–1517