-
Anomaly of the Internal Friction in the Helium Crystals Grown in the Burstlike Growth Mode
Abstract
The internal friction in the crystals grown in two modes, namely, slow and anomalously fast (burst-like growth) modes, is measured in the temperature range 0.49-0.75 K at a frequency of about 75 kHz. An additional contribution to the damping decrement and softening of the dynamic modulus are detected, and their relaxation to equilibrium values at a time constant of about 3 ms is observed. Possible origins of this effect are discussed.
pacs:
67.90.+z, 67.80.-sI INTRODUCTION
Below the second roughening temperature , the helium crystals having appeared in a metastable superfluid grow in two qualitatively different modes depending on initial supersaturation T1 ; T2 . Until the deviation from equilibrium is rather low, the crystal face growth rate is low and determined by the well-known mechanisms, namely, growth on screw dislocations and Frank-Read sources T3 . However, the growth rate increases jumpwise above a certain critical supersaturation , which depends on temperature T4 , and a crystal grows completely in T5 . This effect is characterized by a time lag between the nucleation of a crystal and a jumplike increase in its growth rate T6 . The crystal grows at an ordinary rate in a rather long time, which also depends on the initial supersaturation and reaches , and its growth then accelerates. At low temperatures, the growth rate increases by a factor of . To date, the conditions under which the second growth scenario (burst-like growth) occurs have been determined T4 , the burstlike growth rates have been measured T2 ; T6 , and the return to the normal state with the low growth rates typical of equilibrium crystals has been studied T7 .
However, the entire set of experimental data did not provide an unambiguous answer to the question of whether this phenomenon is the transition of a surface into a new rapidly growing state or is caused by a change in the volume properties of a crystal T2 . Since the face growth kinetics changes, it is reasonable to assume that the effect is caused by a surface phase transition or the appearance of a qualitatively new intense growth source. As follows from filming the crystal growth at the stage of burstlike growth T5 , the anisotropy of kinetic faceting is low, which means simultaneous acceleration of the growth kinetics of all faces (including various orientations). This also means that the preparation for the beginning of burstlike growth should take the same time. Thus, the new growth mechanism should have a low sensitivity to the surface parameters such as the roughening temperature, the surface energy, and the interplanar spacings.
The difficulties in searching for such a mechanism led to assumption that the growth kinetic is accelerated due to a change in the internal state of the crystal. Only one experiment related to the volume parameters has been performed to date: researchers tried to detect a thermal effect during the formation of a rapidly growing state. At temperatures above 0.4 K, no specific features were revealed during a transition into the burstlike growth phase against the background of temperature oscillations accompanying crystal growth. These results only give the upper estimate of the volume transition energy T8 .
A change in the internal state of the crystal can affect its kinetic properties, such as thermal conductivity and internal friction. The intrinsic dissipation losses of an equilibrium crystal during vibrations at a frequency of 15-80 kHz are very high T9 ; T10 . The maximum damping decrement of helium is 0.5. The temperature dependences of the dynamic modulus and the decrement and the effect of 3He impurities, plastic deformation, and annealing on internal friction suggest that the dissipation mechanism has a dislocational nature T10 . Since the internal friction is determined by the sample volume, we can expect that the volume changes resulting in burstlike growth will affect the internal friction parameters of the crystal. Then, the return to the normal state with slow growth kinetics should be accompanied by the attenuation of the addition to the decrement in time.
The purpose of this work is to measure the internal friction at a frequency of about 75 kHz after crystal growth in the normal and anomalously fast (burstlike) growth modes. Preliminary results are published in T11 .
II EXPERIMENTAL
At the initial time, the liquid in a container was under the pressure exceeding the phase equilibrium pressure by . The value of was limited by spontaneous nucleation of a crystal on the wall, so that the maximum supersaturation was 5-12 mbar in various experiments. Before the onset of growth, the pumping of a quartz resonator was switched off and the amplitude of its vibrations began to decrease. Then, a high voltage pulse was applied to a needle located so that the formed crystal touched a quartz oscillator. The additional electrostatic pressure stimulated the formation of a nucleation center for a solid phase T6 , and the metastable liquid began to solidify. The crystals grown by this technique have a dislocation concentration of [3]. Crystal growth was filmed with a video camera. The switching-off signal from the generator was used to start the recording of quartz vibration amplitude and the readings of a capacitance pressure sensor at a step of . The total recording time was 130 ms. The frequency and factor of the composite system were determined from 1-ms recording segments of vibration amplitude relaxation. The details of the optical technique were described in T6 ; T12 .
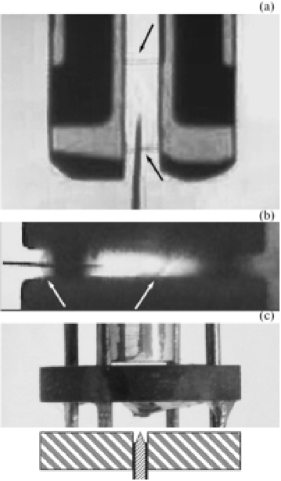
Figure 1 shows the quartz resonators used in experiments and the position of needles. The quartz fork had a resonance frequency of 31909.2 Hz and an intrinsic damping decrement in superfluid helium (Fig.1a). Cylindrical quartz 3.4 mm in diameter and 28 mm in length with a fundamental torsional vibration mode in helium was excited at a frequency of 74 551.9 Hz (Figs.1b,1c). The Q factor of free vibrations was . The quartz vibration amplitude was chosen so that the maximum shear strain of a helium crystal did not exceed . This resonator was used earlier to study the internal friction in crystalline helium T9 ; T10 .
The helium single crystal having grown in the gap during torsional vibrations undergoes complex deformation, so that its torsional rigidity is determined by all elasticity tensor components. To process the experimental data, we use a simplified model: a helium crystal is considered as an isotropic medium. The crystal is assumed to have the shape of a disk with its axis coinciding with the axis of torsional vibrations. In this approximation, the equation describing the vibrations of the quartz-helium crystal system has the form
| (1) |
where is the quartz crystal length and and are the quartz end face area and the helium crystal area, respectively. Helium crystal area in contact with the end face after the end of growth was estimated from crystal volume by the relationship
| (2) |
where is the inner container volume, is the liquid helium density, is the difference between the solid and liquid helium densities, is the compressibility factor of liquid helium, and is the gap size. Wavevectors and of the torsional vibrations of quartz and helium are described by the conventional relations
| (3) |
where and are the torsional vibration velocities of quartz and the helium crystal, respectively; is the system vibration frequency; is the complex dynamic shear modulus of helium; and is the solid helium density. The imaginary part of the frequency was determined from the experimental values of the frequency and damping decrement of the system, and the complex frequency was then substituted into Eq.(1). By solving the equation, we found the real and imaginary parts of the dynamic modulus of helium. The decrement of the medium was determined using the well-known relation . Using the simplifications described above, this processing give results averaged over all elastic constants of the helium crystal.
In earlier internal friction experiments T9 ; T10 , we used a relation deduced from energy considerations to find . Under the conditions and , the decrement of the medium is calculated by the formula
| (4) |
where is the vibration frequency of free-standing quartz and is the coefficient that takes into account the inertia of the helium crystal. This coefficient is for the given geometry and a gap of 0.4 mm. The decrements calculated by Eq.(4) and Eqs.(1) and (2) agree with each other to within 10%.
The growth and the size oscillations of rapidly growing crystals end in 0.5-3 ms depending on temperature T5 . Then, the crystal volume increases due to the flow from an external system, and this increase is only 2% in 20 ms. Therefore, the contact area is assumed to be constant in approximately 2 ms and can be calculated by Eq.(2). When calculating the modulus and the decrement of slowly growing crystals, we took into account the change in their volume determined from the time dependence of the pressure decrement in the container. Contact area increased in time. Note that the estimation of by Eq.(2) gives a high error at the beginning of growth, when the crystal size is small or comparable with the gap size.
III EXPERIMENTAL RESULTS
III.1 Experiments with the Quartz Fork
In the experiments with the fork, spontaneous nucleation of the crystal on the container walls limited the starting supersaturation, which was at most 5 mbar. During crystal growth, the system frequency increased from 32 to 60 kHz. As follows from Eq.(3), the factor of the system was mainly determined by the crystal with a decrement of 0.1-0.5. As a result, the vibrations of the fork-crystal system decay in 1-2 ms. In this time, the anomalous state has no time to form at such a low supersaturation T6 . These experiments did not lead to the desired results.
III.2 Experiments with Cylindrical Quartz
In contrast to the experiments with the fork, the shift of the quartz-helium system frequency and the decay of quartz are low. Free vibrations of the system last the time that is sufficient for the anomalous state to form and the evolution of its internal friction to be studied during 130 ms. In the first series of experiments, a needle was placed from one side and its tip was near the axis of quartz vibrations (Fig.1b). Experiments were carried out at temperatures of 0.49, 0.54, 0.59, 0.62, 0.65, 0.69, and 0.75 K to an initial supersaturation of 10 mbar. The scatter of the temperatures inside each group of measurements was 0.002 K. The gap between the end face of quartz and the metallic base was 0.4 mm. In the second series of experiments, a needle was located from below along the axis of torsional vibrations (Fig.1c). Experiments were performed at a temperature of 0.512 K, and the gap in this case was 0.18 mm. The position of the needle ensured the location of a crystal that corresponds better to the simplified model of calculating the crystal parameters.
The averaged shear modulus calculated from the volume compressibility and the Poisson ratio () is dyn/cm2. The experimental values fall in the range dyn/cm2. This difference in the results is related to the crystal anisotropy and the simplified approach to determining the shear modulus. In Eq.(1), we did not take into account the presence of a rigid needle and the shift of the crystal from the axis of quartz vibrations. The last factor can be taken into account by introducing a coefficient, which depends on the ratio of the crystal radius to the shift, into Eq.(1). This coefficient is unity for a zero shift. When the shift of the crystal is not taken into account, its torsional rigidity is underestimated and, hence, the shear modulus calculated by Eq.(1) is overestimated. The same effect is caused by a needle located from one side. This note belongs to the elastic modulus rather than to its time dependence, since the crystal size and shape change insignificantly in the measurement time. The decrement of a helium crystal calculated by Eq.(1) or Eq.(4) has a weak sensitivity to the shift. A numerical simulation showed that the shift of the crystal from the vibration axis even by its radius changes the decrement calculated by Eq.(4) by at most 10%.
III.3 Slow Crystal Growth
Figure 2 shows the changes in the pressure in the container and the frequency and decrement of the quartz-crystal system at T = 0.75 K and an initial supersaturation of 2.7 mbar. During crystal growth, the pressure in the container decreases in approximately 50 ms. The crystal radius calculated in approximation (2) increases and then, after a time of ms, changes weakly. The frequency and decrement of the quartz-crystal system increase monotonically. The results of calculating the decrement and the shear modulus of a helium crystal are also depicted in Fig.2.
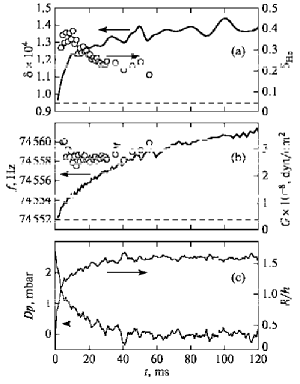
It is seen that the shear modulus falls in the range dyn/cm2 during crystal growth. Allowing for the simplifications and the scatter of the experimental results, we assume that the shear modulus remains unchanged. The calculated decrement of a helium crystal changes weakly during crystal growth (Fig.2a). The absolute value of the decrement (0.2-0.3) agrees with the measurement results in T10 .
Thus, the slow crystal growth is characterized by a constant shear modulus and an unchanged, or weakly changed, decrement, which is close to the decrement of the crystals grown and annealed near the melting curve T10 . The growth from a metastable liquid weakly affected the internal friction of helium crystals.
III.4 Burstlike Crystal Growth
In the range of burstlike growth, the pressure detected by the pressure sensor decreases sharply after the nucleation of a crystal and exhibits a jumplike increase in the growth kinetics of all crystal faces. The decrement and frequency of the quartz-helium system were determined from recording free vibrations after completed crystal growth.
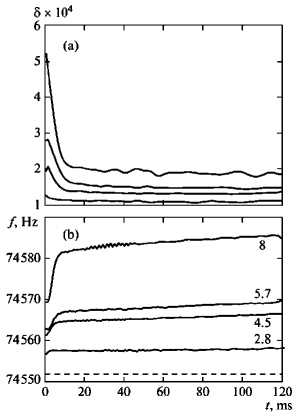
Figure 3 shows the time dependences of these parameters. The following two regions are clearly distinguished in these curves. After the end of crystal growth, the decrement of the system begins to decrease simultaneously with an increase in the averaged dynamic shear modulus. In approximately 20 ms, relaxation is completed and a further slow increase in the frequency and the shear modulus is observed. The second region is related to crystal growth due to a liquid flow along a capillary from the external system. The slopes of the dependences in this region are proportional to initial supersaturation , and the calculated shear modulus and the damping decrement of the crystal are constant within the limits of experimental error. The values of in this region change from crystal to crystal and fall in the range 0.05-0.25. For example, for the curves presented in Fig. 3, these values are 0.074 (2.8), 0.1 (4.5), 0.13 (5.7), and 0.11 (8); in parentheses, we give the values of [mbar]. Such a scatter was observed earlier in annealed samples grown at a constant pressure and a constant temperature gradient, and it is likely to be related to different defect distributions in a sample T10 . A nonuniform dislocation distribution in a crystal was detected earlier during slow growth, where the kinetics is controlled by defects (screw dislocations, Frank-Read sources T3 .), from the deviation of a crystal shape from a regular hexagonal prism. The results obtained at the final stage of crystal growth agree with the well-known data.
An excess decrement and a decrease in the dynamic modulus are only observed in the crystals grown in the burstlike growth mode. Figure 4 shows the evolution of the decrement and the shear modulus of a helium crystal normalized by their steady values at ms.
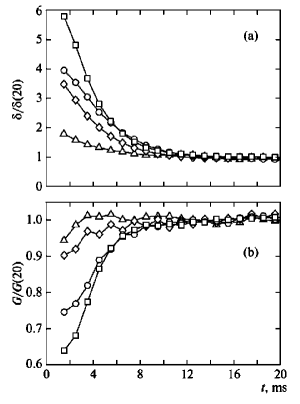
As is seen from Figs.3 and 4, the relaxation contribution increases with the initial supersaturation. The relaxation curves are well described by the exponential relationship
| (5) |
The dependences of parameters and on are presented in Fig.5. The increase in the relaxation contribution is illustrated by an increase in amplitude with the initial supersaturation. Parameter vanishes at the supersaturation that corresponds to the boundary supersaturation separating the regions of normal and anomalous growth, T4 .
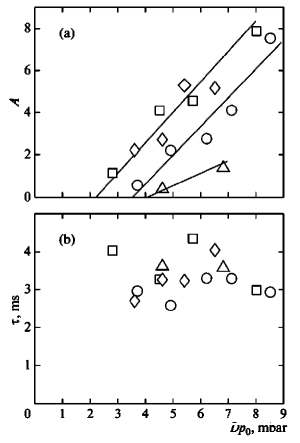
The relaxation time falling in the range 2.5-4.5 ms depends on neither temperature nor the initial supersaturation within the scatter of the experimental results.
Thus, the crystals grown in the burstlike growth mode exhibit an excess decrement and a decrease in the dynamic shear modulus, which relax in time, in the temperature and supersaturation ranges under study. The effect is low or zero at the boundary between anomalous and normal growth and increases with the distance from it. This addition decreases at a time constant of 3 ms.
IV DISCUSSION OF RESULTS
The measured decay is caused by dissipation both inside the crystal and at its surface. It is known from the experimental data that high face kinetics after crystal growth lasts at least 3 ms and that the return to the normal slow kinetics occurs in 50-100 ms T7 . The elastic stresses at the crystal boundary change the chemical potential of the solid phase and initiate interface motion. A similar effect was studied in TWE . As a result, melting takes place and crystal faces grow at a double frequency, since the addition to the chemical potential is quadratic in stress. In turn, the surface-assisted dissipation consists of two parts. The first part is caused by the surface growth kinetics, is determined by kinetic growth coefficient , and is lower than . Oscillating growth is accompanied by liquid flows, which induce sound emission at a double frequency. The second contribution is also low, less than . The sum of both contributions is much lower than the decrement of helium detected in experiments, which is at least 0.07. Thus, the additional decay is related to volume processes.
The internal friction measured in experiments is determined by the sum of all dissipation processes occurring in the crystal. The possible sources of the effect under study are as follows. The additional decay can be caused by the appearance of a new relaxation process. The time behavior of decaying agrees qualitatively with the change in the face growth kinetics after the end of growth. Therefore, the jumplike state of the crystal is assumed to manifest itself in both the appearance of an additional decay process and the acceleration of face growth.
The second possibility consists in the effect of the changed state of the crystal on the oscillation of dislocation segments, which are considered to be responsible for the high damping decrement in crystalline helium. In the Granato-Lücke model of dislocational internal friction GL , the frequency and temperature dependences of internal friction in the case of damped oscillation of dislocation segments are expressed by the formula
| (6) |
where is the damping constant, is the average dislocation segment length, is the dislocation concentration, is the orientation factor, and is the parameter that takes into account the length distribution of dislocation segments. For a distribution, we have = 1; for a network of random intersections, . In terms of this model, a decrease in the decrement with a simultaneous increase in the dynamic modulus occurs when time increases, i.e., when the damping constant determined by the phonon gas viscosity increases. Whence, it follows that the dislocation motion in the crystal grown in the burstlike growth mode is retarded by phonons to a lesser extent as compared to that in an equilibrium crystal.
The last conclusion holds true if the geometric configuration of a dislocation network remains unchanged after the end of growth. However, as is known from earlier experiments on internal friction T10 , even slow growth of helium crystals can lead to time variations of the decrement and the dynamic elastic modulus of a crystal. It is necessary to perform long-term annealing of a helium crystal near the melting curve and to provide a slow temperature change during measurements to obtain reproducible results. Taking this fact into account, we assume that burstlike crystal growth creates a nonequilibrium network of dislocations and it begins to relax after the end of growth, which is reflected on the values of the decrement and the dynamic modulus. For a network of dislocations with self-intersections, we have ; therefore, it weakly changes upon annealing and the time evolution is related to an increase in the average dislocation segment length during rapid annealing, according to Eq.(6). This assumption is in conflict with the results of burstlike growth experiments on the crystals that have no Frank-Read sources and screw dislocations RH1 ; RH2 . In these experiments, a crystal face had no growth sources after the end of burstlike growth; that is, the burstlike growth mode did not generate defects. Even multiple repetition of the process did not degrade the surface.
In conclusion, note that the excess decaying and the modulus defect, which relax in time, are only observed in the crystals grown in the burstlike growth mode. It is impossible to find the source of the anomaly using the data obtained. The effect can be explained by both a change in the internal state of the crystal, which manifests itself in either the appearance of a new relaxation channel or an action on dislocation drag, and annealing of a nonequilibrium network of dislocations, which appears during burstlike growth. The question of whether burstlike growth can generate a nonequilibrium network of dislocations remains open.
V ACKNOWLEDGMENTS
I thank A.F. Andreev for the possibility of performing this work at the Kapitza Institute for Physical Problems; V.V. Zav yalov for his support; V.S. Kruglov and V.A. Sharykin (Russian State Scientific Center Kurchatov Institute) for their assistance; and S.N. Burmistrov and L.B. Dubovskii for useful discussions.
References
- (1) V. L. Tsymbalenko, Phys. Lett. A 211, 177 (1996).
- (2) V. L. Tsymbalenko,J. Low Temp. Phys. 138, 795 (2005).
- (3) V. L. Tsymbalenko, Low Temp. Phys. 21, 120 (1995).
- (4) V. L. Tsymbalenko, J. Low Temp. Phys. 121, 53 (2000).
- (5) V. L. Tsymbalenko, Phys. Lett. A 274, 223 (2000).
- (6) V. L. Tsymbalenko, J. Exp. Theor. Phys. 92, 1024 (2001).
- (7) V. L. Tsymbalenko, J. Exp. Theor. Phys. 99, 1214 (2004).
- (8) V. L. Tsymbalenko, J. Exp. Theor. Phys. 103, 869 (2006).
- (9) V. L. Tsymbalenko, Sov. Phys. JETP 47, 787 (1978).
- (10) V. L. Tsymbalenko, Sov. Phys. JETP 60, 537 (1984).
- (11) V. L. Tsymbalenko, Phys. Lett. A 378, 2325 (2014).
- (12) V. L. Tsymbalenko, Instrum. Exp. Tech. 40, 585 (1997).
- (13) M. Thiel, A. Willibald, P. Evers, A. Levchenko, P. Leiderer, and S. Balibar, Europhys. Lett. 20, 707 (1992).
- (14) A. V. Granato and K. Lücke, in Physical Acoustics: Principles and Methods, Ed. by W. P. Mason (Elsevier, Amsterdam, The Netherlands, 1966), Vol. 4, Part A.
- (15) J. P. Ruutu, P J. Hakonen, A. V. Babkin, A. Ya. Parshin, J. P. Penttila, J. P. Saramaki, and G. Tvalashvili, Phys.Rev. Lett. 76, 4187 (1996).
- (16) J. P. Ruutu, P J. Hakonen, A. V. Babkin, A. Ya. Parshin, and G. Tvalashvili,, J. Low Temp. Phys. 112, 117 (1998).