Investigating the nature of the Fried Egg nebula:
Through CO mm-line and optical spectroscopy, we investigate the properties of the Fried Egg nebula IRAS 17163–3907, which has recently been proposed to be one of the rare members of the yellow hypergiant class. The CO J=2–1 and J=3–2 emission arises from a region within 20 of the star and is clearly associated with the circumstellar material. The CO lines show a multi-component asymmetrical profile, and an unexpected velocity gradient is resolved in the east-west direction, suggesting a bipolar outflow. This is in contrast with the apparent symmetry of the dust envelope as observed in the infrared. The optical spectrum of IRAS 17163–3907 between 5100 and 9000 Å was compared with that of the archetypal yellow hypergiant IRC+10420 and was found to be very similar. These results build on previous evidence that IRAS 17163–3907 is a yellow hypergiant.
Key Words.:
circumstellar matter – stars: AGB and post-AGB – stars: mass-loss – stars: individual: IRAS 17163–39071 Introduction
Yellow hypergiants (YHGs) are a class of massive evolved stars. The YHG phase is thought to be short lived, and examples of such stars are rare, with only about a dozen known in our galaxy (Oudmaijer et al., 2009). However, YHG stars are characterised by intense mass-loss and can greatly impact the chemical enrichment of the interstellar medium, both with their massive winds and with their ultimate explosions as core-collapse supernovae.
According to de Jager (1998), the defining characteristics of YHGs are a Ia+ luminosity class, based on visible spectra, with H emission in one or more broad components and absorption lines that are broader than those of Ia supergiants of a similar spectral type. The H emission is a signature of an extended atmosphere and mass loss, while the comparatively broad absorption lines signify large-scale photospheric motions such as pulsation.
These empirical characteristics have a physical interpretation, placing the YHGs in a blueward evolutionary loop on the Hertzsprung-Russell diagram after the red supergiant phase. Only stars with initial masses between 20 and 40 M⊙ can take this path, and the timescale of the YHG phase is of the order of 100-1000 years, accounting for the rarity of this type of star. A YHG may subsequently evolve through a phase as a luminous blue variable, and finally become a Wolf-Rayet star (Oudmaijer et al., 2009).
Among the most well-studied YHGs are HD 179821 (also known as IRAS 19114+0002 or AFGL 2343) and IRC+10420, both of which have prominent infrared excesses and dusty circumstellar envelopes, the latter having suffered a major ejection within the last 600 years (Humphreys et al., 1997, 2002; Oudmaijer et al., 1996). Very few YHG stars show resolved envelopes (de Jager, 1998), and studies of their mass-loss are limited (e.g. Castro-Carrizo et al., 2007; Dinh-V.-Trung et al., 2009).
This paper focuses on the source IRAS 17163–3907 (also known as Hen 3-1379, and hereafter referred to as IRAS 17163). It was discovered by Henize (1976) and was first classified as a post-AGB star by Le Bertre et al. (1989). Using interstellar K I absorption in the optical spectrum, Lagadec et al. (2011b) placed a lower limit of 3.6 kpc on the distance to the star. An upper limit of 4.7 kpc was derived from the maximum visual extinction implied by diffuse interstallar band absorptions. Consequently, IRAS 17163 is at a distance four times larger than the distance of 1 kpc estimated by Le Bertre et al. (1989). The revised luminosity of 5105 L⊙, along with its position on a temperature-luminosity diagram close to the brightest YHGs like IRC+10420, means that IRAS 17163 is almost certainly a member of the yellow hypergiant class.
Despite being one of the brightest objects in the mid-IR sky, IRAS 17163 has so far been the subject of limited investigations. Mid-IR images of IRAS 17163 were obtained by Lagadec et al. (2011a;b) using the VLT-VISIR instrument. Two concentric spherical dusty shells were resolved within 2.5 of the central star, with a warm (200 K) dust mass of 0.04 M⊙. The presence of two shells suggests an episodic enhancement of the mass-loss rate on timescales of a few hundred years. IRAS 17163 was also imaged with Herschel (Hutsemékers et al., 2013), revealing a symmetric dust shell 25 in radius around the star. The mass of cool (60 K) dust in this shell is inferred to be as high as 0.17 M⊙, implying a huge (although poorly constrained because of the unknown gas/dust ratio) circumstellar gas mass. However, dust imaging lacks kinematic information, preventing us from studying the mass loss and its timescale in more detail. In this paper, we present the first observations of CO rotational lines around IRAS 17163 and an optical spectrum of the star between 5100 and 9000 Å.
2 Observations
2.1 APEX observations
IRAS 17163 was observed with the Atacama Pathfinder EXperiment (APEX) telescope111This publication is based on data acquired with the Atacama Pathfinder Experiment (APEX). APEX is a collaboration between the Max-Planck-Institut fur Radioastronomie, the European Southern Observatory, and the Onsala Space Observatory. on April 9–12, 2014. A 100100 on-the-fly map in the CO J=2–1 and J=3–2 transitions was performed, centred on the star at R.A. 17:19:49.33, Dec. –39:10:37.9 (J2000). The data were taken with a scan spacing of 9 in CO 2–1 (main beam size 27) and 6 in CO 3–2 (beam size 18).
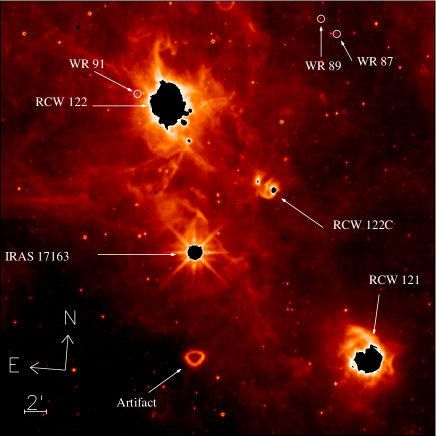
The direction of IRAS 17163 lies close to the complex star-forming regions RCW 121 and RCW 122 (see Fig. 1), which show bright CO emission at velocities between –40 and 0 km s-1, extended over a region of several square arcminutes (Arnal et al., 2008). We adopted an on/off position-switching calibration scheme, carefully selecting an off-position free from CO emission, 20 south-east of the source.
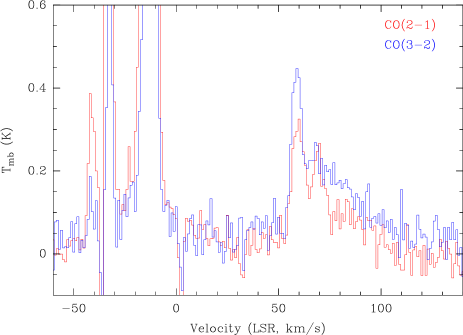
The data were reduced within the standard single-dish data reduction package CLASS222http://www.iram.fr/IRAMFR/GILDAS. The spectra have a total velocity coverage of 5720 and 3810 km s-1 in CO 2–1 and 3–2, respectively. There are no line detections in either spectrum outside the velocity interval –40 to +110 km s-1.
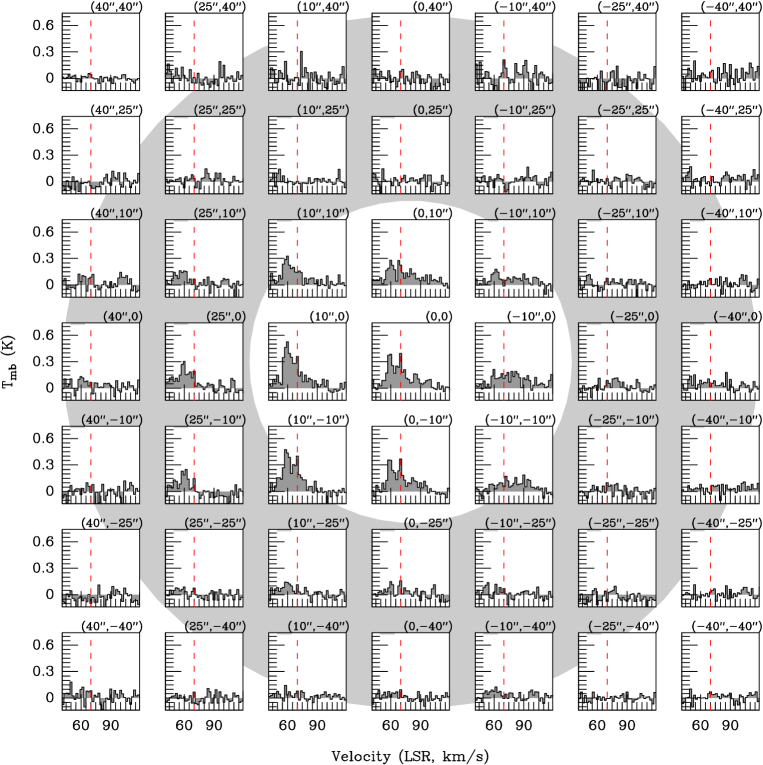
The components between –40 and 0 km s-1 correspond to CO emission from the RCW 121 and RCW 122 complexes (Arnal et al., 2008). An additional emission feature is seen between =50–110 km s-1 (Fig. 2). In contrast to the widespread CO features in the velocity range –40 to 0 km s-1, this component is confined to within 20 of IRAS 17163 (Fig. 3, 4) and is clearly associated with the circumstellar envelope. The CO radial velocity, 70 km s-1, is also completely incompatible with galactic rotation at any distance towards IRAS 17163.
2.2 Optical spectrum from Mercator
IRAS 17163 was observed on August 10, 2009, with the fibre-fed spectrograph HERMES (Raskin et al., 2011) attached to the 1.2-meter Mercator telescope at Roque de los Muchachos observatory, Spain. The fibre has an aperture of 2.5 on the sky. Four exposures of 20 minutes each were taken in concatenation, and the data were reduced with the dedicated pipeline. The resulting flat-fielded, merged, and wavelength-calibrated spectrum was normalized by the continuum level and is presented in Appendix B. Note that the spectrum was not corrected for telluric features. The spectral resolution is 4 km s-1 and the signal-to-noise ratio ranges between 5–100 depending on the wavelength, with lower values in the blue due to the severe reddening of the star.
3 Results
3.1 CO emission
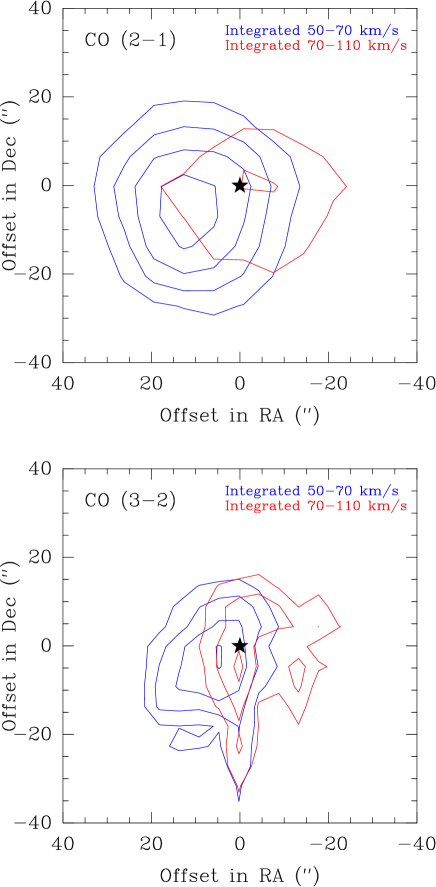
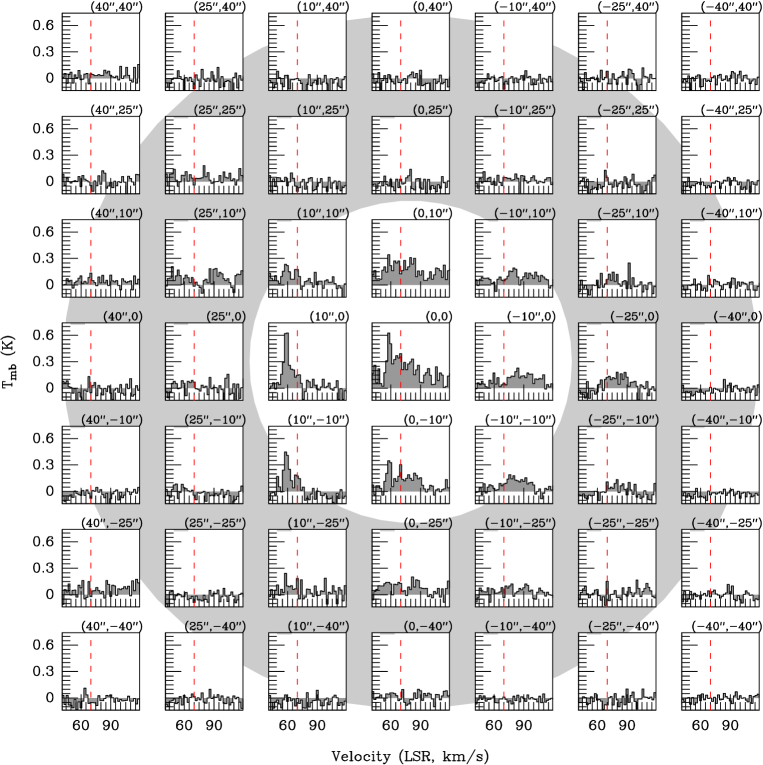
The CO J=2–1 and J=3–2 emission lines are broad (60 km s-1) and asymmetrical, with peaks between =50–70 km s-1 and a fainter plateau between 70–110 km s-1 (Fig. 2). Integrating over these blue (50–70 km s-1) and red (70–110 km s-1) emission components shows that the CO emission is concentrated within 20 of the star and that there is a clear spatial separation between the two components (Fig. 3). In CO 2–1 the blue and red components’ emission peaks are offset from the star by 14 and 4, respectively, giving a spatial separation of 18, in a mainly east-west direction. This velocity gradient is resolved within the APEX beam and suggests an asymmetrical outflow with a velocity of 30 km s-1. The velocity gradient is less apparent in CO 3–2, partly because the red component has a low signal-to-noise ratio. In addition, the CO 3–2 emission is generally concentrated closer to the star, with the blue and red components’ emission peaks offset from the star by 6 east and 5 south, respectively. This may be because the gas closer to the star is warmer and hence brighter in CO 3–2 than 2–1. The CO (3–2)/(2–1) peak intensity ratio is 1.4 at the star, and decreases to 1.2 at (+10,0).
Previous infrared observations have found a warm dust mass of 0.04 M⊙ in shells within 2.5 of the star (Lagadec et al., 2011b), and a cooler dust ring peaking 25 from the star (extending in radius from 18 to 40), with a dust mass of 0.17 M⊙ (Hutsemékers et al., 2013). This large amount of dust implies a significant gas mass, especially in the 25 ring, but the CO observations show little emission in this area (Fig. 4). The CO emission is found mainly within 20 of the star, which is most likely due to the CO farther away being photodissociated by the interstellar UV radiation field. The asymmetry of the CO emission contrasts with the apparent symmetry of the dust rings at both 2.5 and 25 from the star. However, we note that a slight asymmetry can be seen in the Hutsemékers et al. (2013) dust image, along the same direction as the CO velocity gradient.
The asymmetry of the CO line profile and the velocity gradient mean we cannot model the mass loss as a spherically symmetric wind. This precludes us from reliably estimating the mass-loss rate. However, catalogues of AGB and post-AGB stars indicate that a CO envelope of 20 would require a large sustained mass-loss rate of around 10-5 M⊙ yr-1 (Loup et al., 1993). This is in the range of expected mass-loss rates for YHGs.
To give a rough estimate of the circumstellar gas mass, we consider that if the integrated CO line intensity (5.85 K km/s) were that of a gravitationally bound spherical interstellar cloud of 20 radius at a distance of 4 kpc, then the application of a standard CO/H2 conversion factor of 2 cm-2/(K km s-1) would imply a gas mass 6 M⊙. By coincidence, this is similar to the 7 M⊙ mass of the 25 dust ring derived by Hutsemékers et al. (2013), who assumed a gas-to-dust mass ratio of 40.
3.2 Optical spectroscopy
The optical spectrum of IRAS 17163 is rich in lines, mainly in emission, but also some in absorption. Of the identified lines, the largest number correspond to Fe II, Cr II, and Ca II in emission and N I and H I in absorption. Interstellar absorption lines of K I and diffuse interstellar bands (DIBs) have velocities corresponding to the CO emission from the surrounding star-forming regions (see Fig. 5).
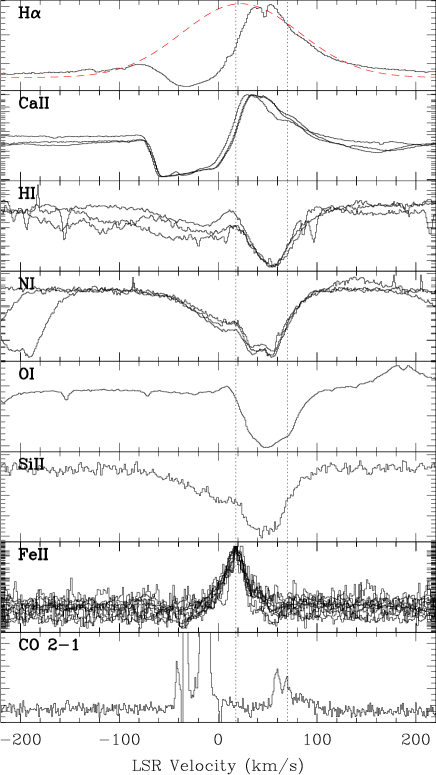
The brightest line, H (at 6563 Å), has a P-Cygni profile with a FWHM of 140 km s-1 (see Fig. 6) and broad wings extending out to a width of 2400 km s-1. A P-Cygni line profile is indicative of a substantial outflow of material, and the broad H wings may be due to scattering by free electrons, as suggested by Humphreys et al. (2002) for IRC+10420. Three Ca II lines (at 8498, 8542, and 8662 Å) also show P-Cygni profiles, with line widths similar to that of H . A relatively large number (50) of lines remains unidentified in the spectrum.
The central velocities of various lines range from +10 to +43 km s-1 (see Fig. 6), but both H and the narrow (FWHM=25 km s-1) Fe II lines are centred on a velocity of +18 km s-1. Given their excitation, the Fe II lines most likely arise near the stellar photosphere and are indicative of the stellar velocity. However, their velocity is blueshifted by about 50 km s-1 relative to the velocity of the CO emission. Possible explanations for this are discussed in Sect. 4.1.
The absolute magnitude () of IRAS 17163 can be estimated from the equivalent width () of the O I (7774) triplet, which has been shown to be a good indicator of for stars with spectral types A to G (Arellano Ferro et al. 2003, and references therein). We measure (O I (7774))=3.140.01 Å, which is just outside the range of the (O I)– calibration by Arellano Ferro et al. (2003). Nevertheless, a straight extrapolation suggests an close to –10, comparable with the values similarly derived for the two YHGs IRC+10420 and HD 179821 (Oudmaijer et al., 2009).

4 Discussion
4.1 Velocity discrepancy
IRAS 17163 shows broad CO emission, centred around 70 km s-1, with a velocity gradient across the circumstellar envelope. We hence take this to be the systemic velocity of the star. The star also shows multiple optical Fe II lines, centred on a velocity of 18 km s-1. This should also be indicative of the systemic velocity, yet it is blueshifted by 50 km s-1.
A velocity discrepancy between CO and optical line velocities is also found in the archetypal YHG IRC+10420, although it is smaller. In this object, the optical emission lines are blueshifted by 1525 km s-1 compared with the CO systemic velocity at +75 km s-1. However, the optical lines still fall within the CO velocity range. In the YHG HD 179821, the CO and optical lines coincide at +100 km s-1.
There are several possible explanations for the large velocity discrepancy in IRAS 17163. First is photospheric pulsations: yellow hypergiant stars are characterised by large-scale photospheric variability. The YHG Cas has shown radial velocity variations of up to 35 km s-1 associated with outburst activity, on a timescale of 100 days (Lobel et al., 2003). Furthermore, models show that YHG pulsational variability can be up to 100 km s-1 (Fadeyev, 2011). As we only have one epoch of optical observations of IRAS 17163, we cannot constrain its photospheric variability, so it is possible that our optical spectrum was taken near the peak of a pulsational cycle when the photospheric lines were blueshifted by 50 km s-1.
Another possibility is a close binary companion. In this case, the CO emission would indicate the systemic velocity of the binary system, while the Fe II lines arise only from our YHG. IRAS 17163 would need to have an orbital velocity of at least 50 km s-1 to explain the velocity discrepancy between the CO and Fe II lines. For example, the LBV binary MWC 314 has an orbital speed of 100 km s-1 (Lobel et al., 2013). The binary hypothesis also requires that the companion be relatively optically faint as there is no indication of lines at a very different velocity in the optical spectrum. The companion would have to be 100 (the highest signal-to-noise ratio in the spectrum) times less luminous than IRAS 17163, i.e., 5103 L⊙. For a main sequence companion, this rules out only the heaviest (greater than 10 M⊙) stars.
In summary, the radial velocity of the Fe II optical lines is compatible with the systemic velocity derived from the CO observations. We note that a systemic velocity of 70 km s-1 means that the star has a very high peculiar velocity, redshifted by about 100 km s-1 compared with galactic rotation at 4 kpc (Reid et al., 2009). However, about 20% of massive stars in the Milky Way are runaways (e.g. Mason et al., 1998), so this is not implausible.
4.2 Nature of IRAS 17163
4.2.1 Distance
The knowledge of the distance is a key parameter for defining the nature and physical properties of IRAS 17163, as it determines its absolute luminosity and hence its position in the Hertzsprung–Russell diagram. The signature of foreground interstellar clouds in its optical spectrum allowed Lagadec et al. (2011b) to conclude that the distance to IRAS 17163 is at least 3.6 kpc. This large distance is also supported by recent trigonometric parallax measurements of the star-forming region RCW 122, placing it at a distance of 3.380.3 kpc (Wu et al., 2012). RCW 122 is part of the complex whose CO emission matches the K I absorption in our spectra (Fig. 5), and is hence in front of IRAS 17163.
The knowledge of the absolute magnitude, (see 3.2), of IRAS 17163 provides an alternative method of determining its distance, (in pc), using the equation
| (1) |
where is the apparent visual magnitude and the visual extinction along the line of sight to the star. We take =13.03 mag and =4.10 mag from Le Bertre et al. (1989) and assume that there has been no significant variation in the star between the date of the photometric observations (1988) and the more recent spectroscopic observations of O I (2009), from which is determined. A standard conversion between visual extinction and reddening of is used. Taking the photometric reddening at face value, Eq. (1) gives a distance to IRAS 17163 of 1 kpc. Alternatively, an estimate of the interstellar reddening can be found from the depths of DIBs in the optical spectrum. Taking the highest interstellar reddening value derived by Lagadec et al. (2011b), we calculate a distance of 7 kpc. The uncertainties in the amount and properties of interstellar and circumstellar dust limit the application of this method for constraining the distance to IRAS 17163. In any case, the distance interval (1–7 kpc) is consistent with, but less restrictive than, that the 3.64.7 kpc found by Lagadec et al. (2011b). Throughout this paper we have assumed a distance of 4 kpc.
4.2.2 Mass of the star
The terminal velocities of stellar winds are typically of the order of the stellar escape velocity (see e.g. Abbott, 1978; Lamers & Cassinelli, 1999), which we can use to roughly estimate the current stellar mass. We can estimate the wind terminal velocity from the Ca II P Cygni profile, where the blue edge of the absorption represents the highest wind speed: –80 km s-1. As the wind originates at the systemic velocity, 70 km s-1, this gives a terminal velocity of 150 km s-1.
From the luminosity of 5 L⊙ and an assumed effective temperature of 8000 K (from the determination of IRAS 17163 as a late B- or early A-type star by Lagadec et al. (2011b)), we calculate a stellar radius of 370 R⊙. Then, equating the terminal velocity of the stellar wind, 150 km s-1, with the escape velocity , we derive a stellar mass of 22 M⊙. Summing this value with the estimate of the circumstellar mass (see Sect. 3.1) yields an initial mass of about 30 M⊙, consistent with the expected YHG initial mass range of 20 to 40 M⊙.
4.2.3 Comparison with IRC+10420
There is a wealth of similarity between IRAS 17163 and IRC+10420, the archetypal YHG. Their close proximity in the Hertzsprung–Russell diagram prompted the classification of IRAS 17163 as a YHG, and both objects have absolute magnitudes close to =–10 (see Sect. 3.2). Both objects show distinct circumstellar shells, with ejection timescales of a few hundred years (Lagadec et al., 2011b; Oudmaijer et al., 2009).
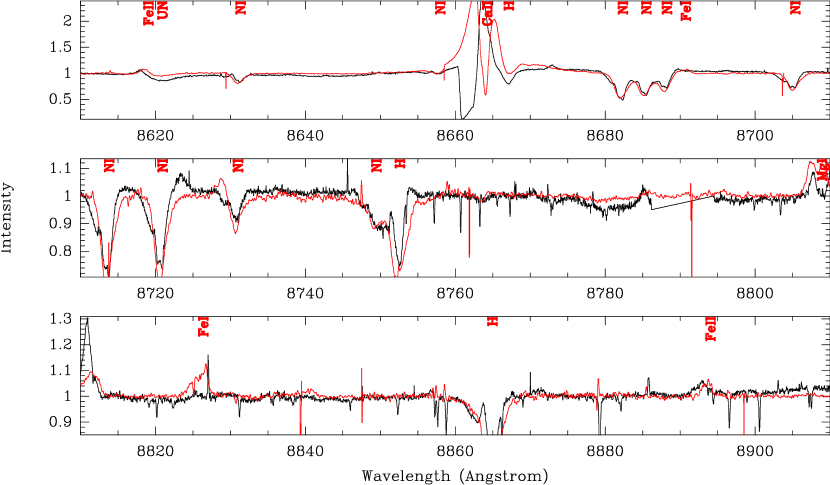
Furthermore, the optical spectrum of IRAS 17163 closely resembles the peculiar optical spectrum of IRC+10420 (Oudmaijer, 1998). The two spectra are shown, overlaid, in Appendix B. Both objects show strong H and Ca II lines. In IRAS 17163 these lines have clear P-Cygni profiles, indicative of circumstellar outflow. In IRC+10420 they show strong central absorptions. There are a few other differences between the two spectra: IRAS 17163 is somewhat more line rich, with about a dozen lines that are not seen at all in the spectrum of IRC+10420. Conversely, there are two Fe I lines seen only in the IRC+10420 spectrum. The Mg II lines around 7890 Å are seen in emission in IRAS 17163 and in absorption in IRC+10420.
Overall, the optical spectra of IRAS 17163 and IRC+10420 are very similar. This, along with the other similarities between these two objects, supports the classification of IRAS 17163 as a yellow hypergiant.
5 Conclusions
IRAS 17163 was recently proposed to be a member of the rare class of yellow hypergiants by Lagadec et al. (2011b) based on its location on a Hertzsprung–Russell diagram close to the archetypal yellow hypergiant IRC+10420. To further investigate the nature of the star, we obtained CO J=2–1 and J=3–2 APEX observations and a high-resolution Mercator spectrum between 5100 and 9000 Å. Our findings can be summarized as follows:
-
•
We observe CO emission associated with IRAS 17163, at a radial velocity around +70 km s-1.
-
•
The CO line profile is broad (60 km s-1) and asymmetric, with a blue component showing multiple peaks and a fainter, broader red component.
-
•
A velocity gradient is resolved across the circumstellar envelope: a 18 offset between the blue and red components’ emission peaks, suggesting an asymmetrical outflow in an approximately east-west direction.
-
•
There is a velocity discrepancy between the CO emission, at 70 km s-1, and the optical Fe II lines at 18 km s-1. This might be explained by large photospheric pulsations in the star or by a binary companion.
-
•
The optical spectrum is line rich and very similar to the peculiar spectrum of the archetypal yellow hypergiant star IRC+10420.
-
•
The P-Cygni profiles of the H and Ca II lines signify a substantial amount of outflowing material.
-
•
The absolute magnitude was estimated using the equivalent width of the O I (7774 Å) triplet to be =–10, comparable to that of IRC+10420.
We conclude that the similarity in properties between IRAS 17163 and IRC+10420 reinforces the classification of IRAS 17163 as a yellow hypergiant. The CO emission from this object is complex and has raised questions about how it fits in with previous observations. Further observations of the circumstellar envelope at high angular resolution, for instance, with ALMA, will be required to reveal the distribution of the molecular gas and further study the mass-loss activity.
Acknowledgements.
We would like to thank the director of the Onsala Space Observatory, Hans Olofsson, for generous allocation of DDT time. We also thank Per Bergman for his help with our APEX observations and for helpful discussions. This publication makes use of data products from the Wide-field Infrared Survey Explorer, which is a joint project of the University of California, Los Angeles, and the Jet Propulsion Laboratory/California Institute of Technology, funded by the National Aeronautics and Space Administration.References
- Abbott (1978) Abbott, D. C. 1978, ApJ, 225, 893
- Arellano Ferro et al. (2003) Arellano Ferro, A.; Giridhar, S. & Rojo Arellano, E.; et al. 2003, RMxAA, 39, 3
- Arnal et al. (2008) Arnal, E. M.; Duronea, N. U. & Testori, J. C. 2008, A&A, 486, 807
- Bergman et al. (2011) Bergman, P.; Parise, B.; Liseau, R.; et al. 2011, A&A, 531, 8
- Castro-Carrizo et al. (2007) Castro-Carrizo, A.; Quintana-Lacaci, G.; Bujarrabal, V.; et al. 2007, A&A, 465, 457
- Dinh-V.-Trung et al. (2009) Dinh-V.-Trung; Muller, S.; Lim, J.; et al. 2009, ApJ, 697, 409
- de Jager (1998) de Jager, C. 1998, A&A Rev., 8, 145
- Fadeyev (2011) Fadeyev, Y. A. 2011, Astronomy Letters, 37, 403
- Henize (1976) Henize, K. G. 1976, ApJS, 30, 491
- Humphreys et al. (1997) Humphreys, R. M.; Smith, N.; Davidson, K.; et al. 1997, AJ, 114, 2778
- Humphreys et al. (2002) Humphreys, R. M.; Davidson, K. & Smith, N. 2002, AJ, 124, 1026
- Hutsemékers et al. (2013) Hutsemékers, D.; Cox, N. L. J. & Vamvatira-Nakou, C. 2013, A&A, 552, 6
- Lagadec et al. (2011b) Lagadec, E.; Zijlstra, A. A.; Oudmaijer, R. D.; et al. 2011b, A&A, 534, L10
- Lamers & Cassinelli (1999) Lamers, H. J. G. L. M. & Cassinelli, J. P. 1999, Introduction to Stellar Winds (Cambridge University Press)
- Le Bertre et al. (1989) Le Bertre, T.; Heydari-Malayeri, M.; Epchtein, N.; et al. 1989, A&A, 225, 417
- Lobel et al. (2003) Lobel, A.; Dupree, A. K.; Stefanik R. P.; et al. 2003, ApJ, 583, 923
- Lobel et al. (2013) Lobel, A.; Groh, J. H.; Martayan, C.; et al. 2013, A&A, 559, 16
- Loup et al. (1993) Loup, C.; Forveille, T.; Omont, A. & Paul, J. F. 1993, A&AS, 99, 291
- Mason et al. (1998) Mason B. D.; Gies, D. R.; Hartkopf, W. I.; et al. 1998, AJ, 115, 821
- Oudmaijer et al. (1996) Oudmaijer, R. D.; Groenewegen, M. A. T.; Matthews, H. E.; et al. 1996, MNRAS, 280, 1062
- Oudmaijer (1998) Oudmaijer, R. D., 1998, A&AS, 129, 541
- Oudmaijer et al. (2009) Oudmaijer, R. D.; Davies, B.; de Wit, W.-J. & Patel, M. 2009, in The Biggest, Baddest, Coolest Stars, ASP Conf. Series 112, pp. 17-32
- Raskin et al. (2011) Raskin, G.; van Winckel, H.; Hensberge, H.; et al. 2011, A&A, 526, 69
- Reid et al. (2009) Reid, M. J.; Menten, K. M.; Zheng, X. W.; et al. 2009, ApJ, 700, 137
- Wu et al. (2012) Wu, Y. W.; Xu, Y.; Menten, K. M.; et al. 2012, IAU Symposium, Volume 287, p. 425-426
Appendix A Map of CO 3–2 emission
Appendix B Optical spectrum of IRAS 17163, overlaid with the spectrum of IRC+10420
![[Uncaptioned image]](/html/1501.03362/assets/x8.png)
![[Uncaptioned image]](/html/1501.03362/assets/x9.png)
![[Uncaptioned image]](/html/1501.03362/assets/x10.png)
![[Uncaptioned image]](/html/1501.03362/assets/x11.png)
![[Uncaptioned image]](/html/1501.03362/assets/x12.png)