Star Formation in Ultrafaint Dwarfs: Continuous or Single-age Bursts?
Abstract
We model the chemical evolution of six UFDs: Bootes I, Canes Venatici II, Coma Berenices, Hercules, Leo IV and Ursa Major I, based on their recently determined star formation histories. We show that two single-age bursts cannot explain the observed [/Fe] vs [Fe/H] distribution in these galaxies and that some self-enrichment is required within the first burst. An alternative scenario is modelled, in which star formation is continuous except for short interruptions when one or more supernovae temporarily blow the dense gas out from the centre of the system. This model allows for self-enrichment and can reproduce the chemical abundances of the UFDs in which the second burst is only a trace population. We conclude that the most likely star formation history is one or two extended periods of star formation, with the first burst lasting for at least 100 Myr. As found in earlier work, the observed properties of UFDs can be explained by formation at a low mass ( M⊙), rather than being stripped remnants of much larger systems.
Subject headings:
dark ages, reionization, first stars—galaxies: abundances—galaxies: dwarf—galaxies: formation—galaxies: star formation1. Introduction
The discovery of very faint low-mass galaxies, known as ultra-faint dwarfs ( L⊙) has provided a low-redshift method of investigating the formation and evolution of the early baryonic systems. UFDs contain only old, metal-poor stellar populations and may retain relatively unpolluted chemical signatures of the first generations of stars. Recent work has made progress in determining the star formation history (Weisz et al., 2014; Brown et al., 2014) and chemical abundances (Frebel & Bromm, 2012; Gilmore et al., 2013; Vargas et al., 2013) of these systems.
For most stars in UFDs, only medium-resolution spectroscopy is available, however this is sufficient to determine iron and element abundances (Kirby et al., 2009, 2010). This allows use of the idea of Tinsley (1979), who suggested that the enhanced [/Fe] ratio in halo stars could be explained by the time delay between Type II and Type Ia supernovae. The progenitors of Type Ia supernovae are evolved low and intermediate-mass stars with longer lifetimes than the massive stars that are the progenitors of Type II supernovae, such that there is a Myr period after star formation commences in a galaxy when only Type II supernovae enrich the gas. Type II supernovae eject much more elements relative to iron than Type Ia supernovae, resulting in enhanced [/Fe] for stars that form in the first 100 Myr of star formation in a system. A galaxy that only contains stars with [/Fe] above or close to the mean of 0.35 expected for Type II supernovae in a typical initial mass function (e.g. Salpeter, 1955; Kroupa, 2001) is likely to have formed stars for less than 100 Myr (Cayrel et al., 2004; Frebel & Bromm, 2012).
Enrichment from Type Ia supernovae is not the only possible explanation for low [/Fe], which can also be explained by an initial mass function (IMF) that favours lower-mass Type II supernovae, or by types of supernovae in which most elements do not escape into the interstellar medium (Karlsson et al., 2012). Observationally disentangling the contribution of the decline in [/Fe] as a result of Type II supernovae as compared to Type Ia supernovae is therefore difficult and is likely to require high-resolution observations of iron-peak and s-process elements. It should also be noted that there is not necessarily a direct relationship between [Fe/H] and time, as the merging of gas clouds can create multiple metallicity populations (Wise et al., 2012).
The low luminosity of the UFDs means that chemical abundance data is available for only a few stars in each galaxy, resulting in large uncertainties for individual systems. yHowever, the situation is improving, with Brown et al. (2014) providing [Fe/H] for a large sample of stars in six UFDs and Vargas et al. (2013) determining [/Fe] abundances for 61 stars in eight UFDs. The [Fe/H] distribution from these observations was then used to determine the ages of the stars relative to the M92 globular cluster.
Brown et al. (2014) used isochrone fitting to determine the star formation history (SFH) of six UFDs; Bootes 1, Coma Berenices, Canes Venatici II, Hercules, Leo IV and Ursa Major I. Without the constraint of spectroscopic abundances for [/Fe], they found that the SFH could be fit by a two single-age burst model with three parameters: the ages of the two components and the proportion of stars in each burst. Adding parameters for the duration of the two bursts did not improve the fit, which the authors suggest indicates a narrow age range for the stars within each burst.
In this work we simulate chemical abundances given two possible star formation histories using the models of M⊙ halos presented in Webster et al. (2014) & Bland-Hawthorn et al. (2015). Collins et al. (2014) showed that Bootes I and Hercules have circular velocities of 5-7 kms-1, consistent with halo masses this low. We also investigate whether observed chemical abundances (Gilmore et al., 2013; Vargas et al., 2013; Brown et al., 2014) are consistent with the Brown et al. (2014) star formation histories.
2. Models
The simulations used to model the chemical abundances are described in Webster et al. (2014) & Bland-Hawthorn et al. (2015). The 3D hydro/ionization code Fyris Alpha (Sutherland, 2010) was used to model the effects of a 25 M⊙ star on gas in an M⊙ halo. The density and metallicity distribution of the gas after the first supernova was then used as a template to simulate the effects of later supernovae, allowing an estimation of star formation and gas enrichment over periods of up to 600 Myr. Using the method of Argast et al. (2000), a number of cells were randomly selected, with stars forming in these cells with a probability proportional to the square of the density of the gas.
In our model of two single-age bursts, the first burst stars form in gas enriched from [Fe/H] by only a single 25 M⊙ star. The density and metallicity distribution for the first burst gas is taken from the hydrodynamical model 15 Myr after the supernova. At this time most of the enriched gas has returned to the centre of the galaxy, such that the number of cells with cm-3 is of the number in the undisturbed state. The second burst forms in gas enriched by Type II and Type Ia supernovae from the first burst of stars, with yields as in Woosley & Weaver (1995) & Iwamoto et al. (1999). The number of Type Ia supernovae is similar to the number of Type II supernovae. Bootes I is enriched by only Type II supernovae, because the two bursts in Brown et al. (2014) are only 100 Myr apart. The continuous model is described in Webster et al. (2014). The gas is enriched by only Type II supernovae for the first 100 Myr, after which Type Ia supernovae occur with a rate as in Jimenez et al. (2014). Because higher mass stars yield more alpha elements, varying the mass of the initial star would alter [/Fe] at low [Fe/H], meaning that we should not necessarily expect the models to fit the observations at low [Fe/H]. However, this effect is washed out after a few supernovae.
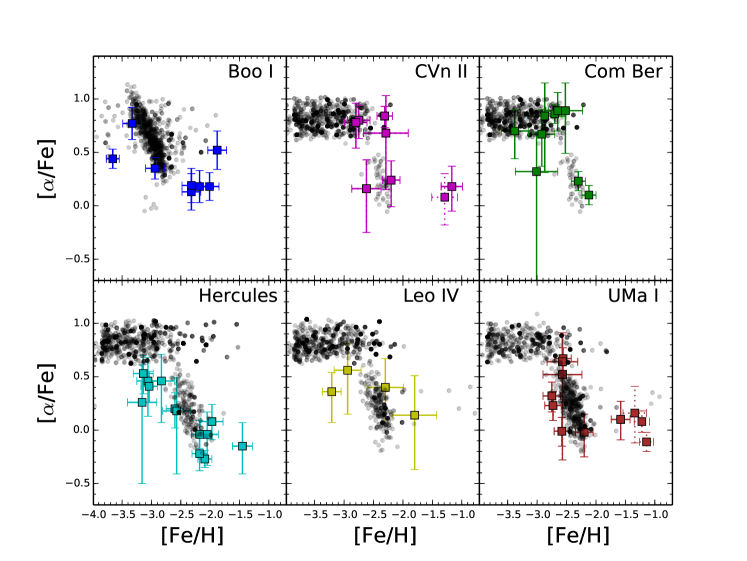
2.1. Single-age bursts
Based on colour-magnitude diagrams, Brown et al. (2014) modelled the star formation histories of six UFDs as two single-age populations, determining the ages of the bursts and the proportion of stars in each burst. A model with extra parameters for the duration of star formation in each burst did not improve their fit, suggesting a narrow age range within each burst.
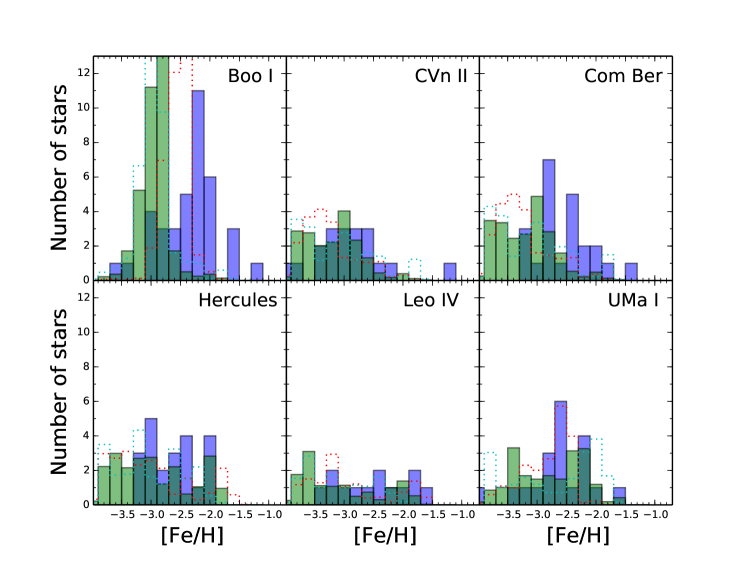
2.1.1 Bootes I
The two-burst model of Brown et al. (2014) has 97% of the stars in Bootes I forming in the second burst, with the two bursts being only 100 Myr apart. This is the only galaxy for which the Brown et al. (2014) model favours such closely spaced bursts, as well as the only case where significantly more stars form in the second burst. 26 of the 38 observed stars (68%) in Bootes I have [Fe/H] , compared to for the other five galaxies. Our model for Bootes Iis shown in the first panel of Figs. 1 and 2, along with the [Fe/H] data from Brown et al. (2014) and [/Fe] data from Gilmore et al. (2013). In our model, the 3% of stars that form in the first burst enrich the gas to [Fe/H] , with a spread in [/Fe] resulting from variations in the extent to which these stars enrich different regions of the galaxy.
A cross-correlation between the observed [Fe/H] histogram and our modelled histogram gives a lag of 0.6 dex for the model. This could be explained by a higher initial metallicity in Bootes I than in our model, or a top-heavy IMF such that a greater proportion of the stars in the first burst produced supernovae. The red dotted histogram, corresponding to an increased Type II SN rate, shows a much smaller lag compared to the observations.
[/Fe] observations from Gilmore et al. (2013) indicate at least some self-enrichment, with evidence of a decline in [/Fe] with increasing [Fe/H]. This could be explained by Type Ia supernovae, but can also be explained by lower mass Type II supernovae, with stochastic sampling of a Kroupa IMF selecting many 8-15 M⊙ star in Bootes I, reducing [/Fe]. If Type II supernovae are the cause of the decline, the Brown et al. (2014) scenario with two single-age bursts 100 Myr apart is possible for Bootes I.
2.1.2 Canes Venatici II
The Brown et al. (2014) model found that 95% of the stars in Canes Venatici II formed in the first burst. Our modelled [/Fe] and [Fe/H] for this scenario is shown along with observational data (Vargas et al., 2013; Brown et al., 2014) in the second panel of Figs. 1 & 2. While our model of the two-burst scenario can fit most of the stars, it produces insufficient scatter to fit the stars at [Fe/H] . Furthermore, four of the eight stars for which [/Fe] data is available show [/Fe] suppressed by 0.5 dex compared to the other four stars. If low [/Fe] reflects self-enrichment, these stars must have formed in the second burst. However, Brown et al. (2014) suggest that 95% of the stars in Canes Venatici II formed in the first burst. Selecting eight stars randomly from such a distribution gives a probability of that four or more will be second burst stars. Removing one of the high-metallicity stars for which the membership of the system is uncertain (J. Simon, private comm.) increases this probability to . As with Bootes I, the cross-correlation showed a lag of 0.6 dex in [Fe/H] for the model compared to the observations.
2.1.3 Coma Berenices
Coma Berenices shows a lag of 0.4 dex in [Fe/H] for the best-fitting model compared to the observations. As shown in Fig. 1, two of the nine stars for which [/Fe] is available show suppressed [/Fe] abundances, suggesting that they belong to the second burst. Using the same method as for Canes Venatici II, this is reasonably unlikely () given that Brown et al. (2014) determine that 96% of the stars belong to the first burst. If the two-burst model is to explain Coma Berenices and Canes Venatici II, it requires more stars in the second burst, or enrichment within the first burst.
2.1.4 Hercules
The Brown et al. (2014) model for Hercules has 82% of the stars in the first burst. As with the previous systems, the model overestimates the number of low-metallicity stars, with the cross-correlation showing a lag of 0.6 dex in [Fe/H] for the model. Fig. 1 shows that [/Fe] observed in Hercules is lower than predicted by the model, suggesting that the gas that formed the first burst of stars was enriched by stars with lower alpha abundances than a 25 M⊙ supernova. Five of the 13 stars show sub-solar [/Fe], suggesting Type Ia enrichment. This is possible, but unlikely () given that the Brown et al. (2014) model has 82% of the stars in the first burst.
2.1.5 Leo IV
Limited abundance data is available for Leo IV, which contains only four stars with known [/Fe] (Vargas et al., 2013) and 13 with [Fe/H] (Brown et al., 2014). The four stars with [/Fe] abundances are consistent with no decline with increasing [Fe/H] or a slight decline. There is insufficient data to conclude whether Leo IV is consistent with the Brown et al. (2014) two-burst model.
2.1.6 Ursa Major I
Ursa Major I has half-light mass of 2.6 M⊙ (Collins et al., 2014) and a luminosity of L⊙, which is much more massive and luminous than our model and therefore the results from the model should be treated with caution. It is the only galaxy studied by Brown et al. (2014) with similar numbers of stars forming in each burst. As shown in Fig. 1, the model can explain the observed abundances except for the stars with [Fe/H] . However, three of these higher-metallicity stars are included in Vargas et al. (2013) but not in Brown et al. (2014) because they are no longer believed to be members (J. Simon, private comm.). When these three stars are excluded, the model is a much better fit to Ursa Major I.
2.1.7 Summary
The two single-age burst model of Brown et al. (2014) found that four of the six UFDs studied formed 75-96% of stars in the first burst. However, 38% (13/34) of stars in these systems show [/Fe] suppressed 0.5 dex compared to the high [/Fe], low [Fe/H] stars in the same galaxy. These stars show [/Fe] , indicative of enrichment either from Type Ia supernovae or lower mass Type II supernovae after the time at which the high [/Fe] stars formed. To fit observations of [/Fe], the two single-age bursts model requires a more even distribution of stars between the first and the second burst.
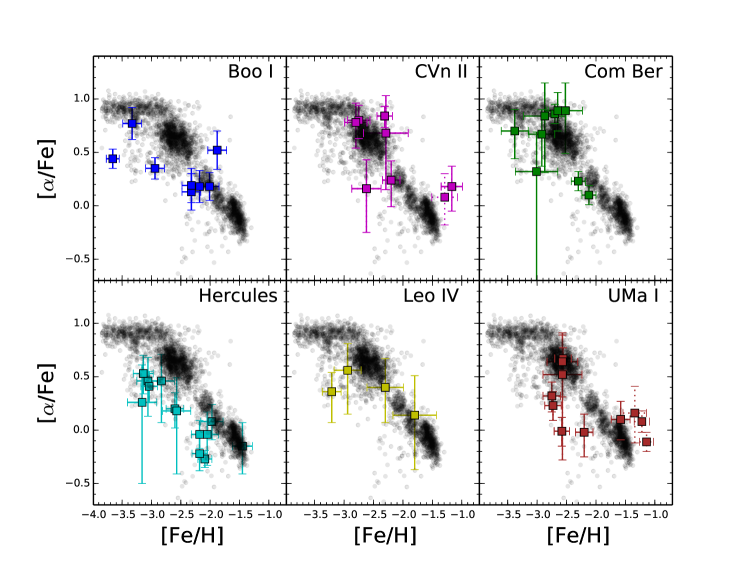
2.2. Continuous model
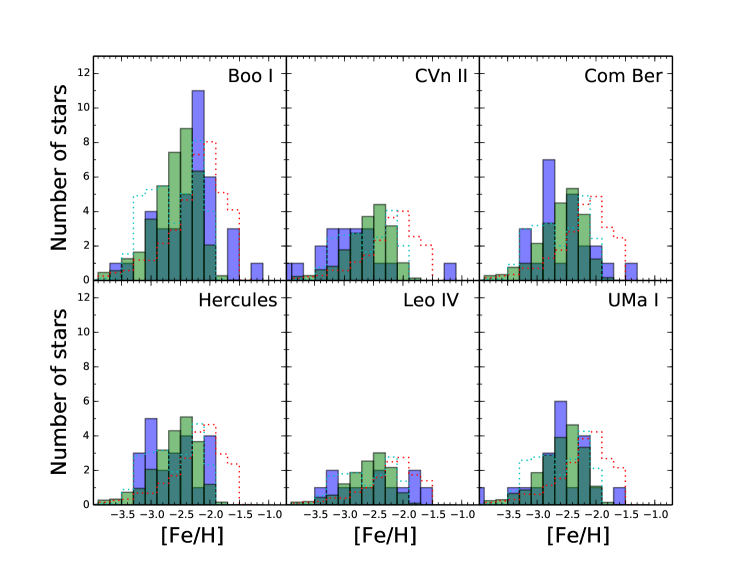
In Webster et al. (2014), we presented a star formation history where each supernova in a M⊙ galaxy temporarily blows out the gas from the centre of the system, pausing star formation for Myr until the gas recovers. Star formation proceeds in the intervals between the supernovae, which are typically 10-20 Myr, but can be as long as 30-40 Myr. Longer, possibly permanent pauses may be caused by a large number of supernovae occurring nearly simultaneously. The output from this model is presented in Figs. 3 & 4 along with observed abundances from Brown et al. (2014); Vargas et al. (2013); Gilmore et al. (2013).
Like the two-burst model, the continuous model shows a clump of stars at low [Fe/H] with [/Fe] 0.8, however this is a smaller proportion of stars than for the bursts model. The gas is then enriched by Type II supernovae, resulting in stars forming with [Fe/H] and [/Fe] . This level of [/Fe] is higher than the average of from Type II supernovae because the low star formation rate results in a low supernova rate, meaning that the enhanced abundances present in the initial gas and from the 25 M⊙ star have not yet been washed out. After 100 Myr, Type Ia supernovae enrich the gas, eventually reducing [/Fe] to sub-solar levels.
The [Fe/H] histogram for this model produces significantly more higher metallicity stars than the two single-age bursts due to the self-enrichment resulting from extended star formation. The number of stars at each metallicity increases until [Fe/H] , as expected for a reasonably constant rate of enrichment, because [Fe/H] is a logarithmic scale. There is then a decline caused by the start of Type Ia enrichment. Type Ia supernovae yield much more Fe than Type II, resulting in a more rapid increase in [Fe/H] and therefore fewer stars at a given metallicity. The number of stars at each [Fe/H] then begins to increase again, followed by a decline due to the truncation of star formation. While the observed [Fe/H] histograms contain limited stars, there may be signs of this pattern in Coma Berenices, Ursa Major I & Hercules, all of which show valleys near [Fe/H] , which is the metallicity at which these systems start to show evidence of Type Ia supernovae.
2.3. Comparison between the models
To compare the models we implement a method based on Section 3.2 of Price-Whelan et al. (2014). For each point in the model, the probability of a modelled star matching the observed star is:
| (1) |
where x = [Fe/H] and y = [/Fe]. This is then summed over all the modelled stars and normalised by the number of stars in the model. The overall likelihood for the system is then the product of the likelihoods of the individual observed stars:
| (2) |
This gives the log likelihoods shown in Table 1. In nearly all cases the extended model has a greater likelihood than the two-burst model, with the only exception being Ursa Major I when the stars with questionable membership are excluded.
| System | Two-burst | Extended |
|---|---|---|
| Bootes I | -12.0 | -6.8 |
| Canes Venatici II | -20.3 (-14.4) | -4.2 (-3.2) |
| Coma Berenices | -4.9 | -3.6 |
| Hercules | -14.2 | -9.4 |
| Leo IV | -3.0 | -2.3 |
| Ursa Major I | -15.3 (-3.5) | -8.2 (-4.2) |
3. Conclusions
We have modelled the chemical evolution resulting from two possible star formation histories. Our conclusions are as follows:
-
1.
The two single-age burst model of Brown et al. (2014) produces too many stars with low [Fe/H], with a lag of dex in the model compared to the observations. This could be explained in part by the systems forming at a higher metallicity [Fe/H], rather than as assumed in our model.
-
2.
Extended star formation is a better fit to observations of [/Fe] in UFDs than the Brown et al. (2014) two single-age bursts model for all galaxies except Ursa Major I. The difference is largest for Canes Venatici II, in which half the observed stars show suppressed [/Fe], while the Brown et al. (2014) star formation history has 95% of stars forming in the first burst.
-
3.
Enrichment within a burst is required to explain the number of low [/Fe] stars in systems where Brown et al. (2014) determine that the vast majority of stars are in the first burst. The success of the Ursa Major I two-burst model suggests that two-burst models can explain at least some UFDs, however a more even distribution of stars between the two bursts is required. An alternate explanation is extended bursts, such that the first stars in each burst enrich those formed later, either through Type Ia supernova enrichment, with a timescale 100 Myr, or lower mass Type II supernovae ( Myr).
-
4.
Our modelled M⊙ systems with extended star formation can reproduce the observed chemical abundances. This provides support to the conclusion of Webster et al. (2014) that the UFDs can be explained as systems with a low formation mass rather than stripping from much larger ( M⊙) halos.
A combination of isochrone fitting as in Brown et al. (2014), observations of chemical abundances, and modelling of chemical evolution can reveal the star formation history of UFDs. Knowledge of the star formation histories can give insight into star formation processes prior to the epoch of reionization. Deeper spectroscopy with the next generation of extremely large telescopes will allow the study of a larger sample of stars, as well as the determination of the abundances of more elements. This should allow chemical tagging (Bland-Hawthorn et al., 2010; Karlsson et al., 2012). If stars in dwarf spheroidals and UFDs formed in large clusters, it should be possible to identify stars born within the same cluster, as there will be very low scatter in chemical abundances between them. Karlsson et al. (2012) presented tentative evidence for a cluster in Sextans at [Fe/H] based on three stars with similar [Fe/H] abundances that also had similar Mg, Ti, Cr & Ba abundances. An equivalent study of UFDs to identify individual clusters requires more chemical abundance observations than is currently available.
Karlsson et al. (2012) also found that the cumulative metallicity functions of UFDs showed less clustering than for dSphs. They suggest that this could result from UFDs forming before reionization at masses below the atomic hydrogen cooling limit M⊙ as in Bovill & Ricotti (2009). Star formation in such halos would be affected by inefficient cooling and feedback from Lyman-Werner radiation, which dissociates H2. This could result in a lower cluster mass. Lower cluster masses provide support for the result in this paper that UFDs experienced more extended star formation than in the case of large clusters with multiple supernovae.
References
- Argast et al. (2000) Argast, D., Samland, M., Gerhard, O. E., & Thielemann, F.-K. 2000, A&A, 356, 873
- Bland-Hawthorn et al. (2010) Bland-Hawthorn, J., Karlsson, T., Sharma, S., Krumholz, M., & Silk, J. 2010, ApJ, 721, 582
- Bland-Hawthorn et al. (2015) Bland-Hawthorn, J., Sutherland, R., & Webster, D. 2015, submitted
- Bovill & Ricotti (2009) Bovill, M. S., & Ricotti, M. 2009, ApJ, 693, 1859
- Brown et al. (2014) Brown, T. M., et al. 2014, ArXiv e-prints
- Cayrel et al. (2004) Cayrel, R., et al. 2004, A&A, 416, 1117
- Collins et al. (2014) Collins, M. L. M., et al. 2014, ApJ, 783, 7
- Frebel & Bromm (2012) Frebel, A., & Bromm, V. 2012, ApJ, 759, 115
- Gilmore et al. (2013) Gilmore, G., Norris, J. E., Monaco, L., Yong, D., Wyse, R. F. G., & Geisler, D. 2013, ApJ, 763, 61
- Iwamoto et al. (1999) Iwamoto, K., Brachwitz, F., Nomoto, K., Kishimoto, N., Umeda, H., Hix, W. R., & Thielemann, F.-K. 1999, ApJS, 125, 439
- Jimenez et al. (2014) Jimenez, N., Tissera, P. B., & Matteucci, F. 2014, ArXiv e-prints
- Karlsson et al. (2012) Karlsson, T., Bland-Hawthorn, J., Freeman, K. C., & Silk, J. 2012, ApJ, 759, 111
- Kirby et al. (2009) Kirby, E. N., Guhathakurta, P., Bolte, M., Sneden, C., & Geha, M. C. 2009, ApJ, 705, 328
- Kirby et al. (2010) Kirby, E. N., et al. 2010, ApJS, 191, 352
- Kroupa (2001) Kroupa, P. 2001, MNRAS, 322, 231
- Price-Whelan et al. (2014) Price-Whelan, A. M., Hogg, D. W., Johnston, K. V., & Hendel, D. 2014, ApJ, 794, 4
- Salpeter (1955) Salpeter, E. E. 1955, ApJ, 121, 161
- Sutherland (2010) Sutherland, R. S. 2010, AP&SS, 327, 173
- Tinsley (1979) Tinsley, B. M. 1979, ApJ, 229, 1046
- Vargas et al. (2013) Vargas, L. C., Geha, M., Kirby, E. N., & Simon, J. D. 2013, ApJ, 767, 134
- Webster et al. (2014) Webster, D., Sutherland, R., & Bland-Hawthorn, J. 2014, ApJ, 796, 11
- Weisz et al. (2014) Weisz, D. R., Dolphin, A. E., Skillman, E. D., Holtzman, J., Gilbert, K. M., Dalcanton, J. J., & Williams, B. F. 2014, ApJ, 789, 147
- Wise et al. (2012) Wise, J. H., Turk, M. J., Norman, M. L., & Abel, T. 2012, ApJ, 745, 50
- Woosley & Weaver (1995) Woosley, S. E., & Weaver, T. A. 1995, ApJS, 101, 181