Revisiting variable gamma-ray sky at 1 GeV with 6 years of Fermi-LAT data
Abstract
We perform a blind search for the variability of the -ray sky in the energy range GeV using 308 weeks of the Fermi-LAT data. We use the technique based on the comparison of the weekly photon counts and exposures in sky pixels by means of the Kolmogorov-Smirnov test. We consider the flux variations in the region significant if statistical probability of uniformity is less than , which corresponds to 0.05 false detections in the whole set of 12288 pixels. Close inspection of the detected variable regions result in identification of 8 sources without previous known variability. Two of them are included in the second Fermi LAT source catalogue (FBQS J122424.1+243623 and GB6 J0043+3426) and one (3EG J1424+3734) was reported by EGRET and also was included in the First Fermi LAT source catalogue (1FGL), but is missing in the 2FGL. Possible identifications of five other sources are obtained using NED and SIMBAD databases (1RXS J161939.9+765515, PMN J2320-6447, PKS 0226-559, PKS J0030-0211, PMN J0225-2603). These new variable gamma-ray sources demonstrate recurring flaring activity with time scale weeks and have hard spectra. Their spectral energy distributions deviate significantly from a simple power-law shape and often peak around GeV. These properties of activity are typical for flaring blazars.
keywords:
methods: data analysis, gamma-rays: general, BL Lacertae objects: general, galaxies: active1 Introduction
In the previous paper (Pshirkov & Rubtsov, 2013) (Paper I) we developed a method for the blind search of long time-scale variability in the Fermi-LAT data. We binned the gamma-ray sky into a large number of relatively small pixels ( sq.deg.) and, using Kolmogorov-Smirnov test, compared a cumulative distribution functions of the registered photons and exposure. If there is no significant variability in a pixel these distributions should be close. The statistically significant deviation of the flux from uniform distribution is considered as an indication of the presence of some variable source in the corresponding pixel. The method is sensitive to the slight gradual changes in the flux that are more difficult to discover with the alternative techniques. However, that comes at a price of somehow reduced sensitivity to short, burst-like events.
In the Paper I 168 weeks of data were analyzed, 151 pixels with a significant variability were found (see Section 2 for the definition of significance). Variability in these pixels was due to 118 sources (some sources contributed to several neighboring pixels), 27 out of which had not been previously reported as variable in the Astronomer’s Telegrams111http://www.astronomerstelegram.org/(ATels), on the Fermisky blog222http://fermisky.blogspot.com/ or in the dedicated papers.
In this paper we extend the data set by 140 weeks to the first 308 weeks of the Fermi mission livetime. This reanalysis is justified not only because of almost twofold increase in the statistics but also by using the new reconstruction framework Pass 7 Reprocessed (P7REP) recently presented by the Fermi-LAT collaboration (Bregeon et al., 2013). The new improved instrument response functions (IRFs) may result in a change of calculated exposures and thus significantly affect the results of our analysis.
2 Data and method
In this work we use the LAT Pass 7 Reprocessed weekly all-sky data publicly available at the Fermi mission website333http://fermi.gsfc.nasa.gov/ssc/data/access/. The analysis spans the time period of 308 weeks from August 04, 2008 to June 23, 2014, corresponding to the mission elapsed time (MET) from 239557417 s to 425179643 s. We use the ’SOURCE’ event class photons with GeV and impose an Earth relative zenith angle cut of and rocking angle cut of . The data selection criteria and our method are identical to the ones described in details in Paper I, here we only briefly repeat the main points:
-
•
We bin weekly data files using HEALPIX package (Górski et al., 2005) into a map of resolution in galactic coordinates with ’RING’ pixel ordering. Total number of pixels is equal to 12288 and the area of each pixel is 3.6 sq. deg, chosen according to the size of Fermi-LAT point-spread function (PSF) above 1 GeV which is approximately .
-
•
We estimate an integral weekly exposure for each pixel using the standard Fermi-LAT tools gtltcube and gtexpcube from the Science Tools v9r32p5 package.
For each pixel we count the number of photons in each of 308 weeks and consider corresponding values of weekly exposure. Cumulative distribution functions (CDFs) for both photon counts and exposure are constructed.
-
•
We compare distributions in each pixel using the Kolmogorov-Smirnov test and find all pixels with a probability lower than the threshold value . This threshold leads to an average 0.05 false detections in the blind search through the whole 12288 pixel set.
We have produced a dedicated set of Monte-Carlo simulated photons with the gtobssim utility using the positions and spectra of sources from the 2FGL catalogue(Nolan et al., 2012) and the latest templates for the diffuse Galactic and isotropic gamma-ray radiation. All sources were naturally simulated as non-variable. Repeating the analysis on events from this Monte-Carlo set we arrive at the lowest value around in total agreement with the expectations.
3 Results
The analysis resulted in 231 pixels with . We compare our findings with the results of the Paper I and concentrate mainly on the differences. First, there are 20 pixels reported in the Paper I, but not detected now. These changes could be due to two main causes: 1) variability may decay on longer timescales and thus the corresponding probability for this timescale would increase and, eventually, would overshoot the chosen threshold 2) refined exposure calculation with the improved IRFs may affect an apparent pixel variability obtained with the older IRFs. The most intriguing case was the one of the pixel 5637 which contains the Geminga pulsar. We have reported for it in the Paper I. However in our new analysis this probability was only . This decrease is mostly attributed to the change of the reconstruction – the probability for the first 178 weeks recalculated using P7REP gives only .
Second, we deal with the pixels that have not been reported in the Paper I (100 pixels total). In order to crudely locate a source within the pixel to check whether its variability was already known, we plot the photons belonging to the weeks with the highest flux and find the center of their clustering. After that, the attribution was first made using 2FGL catalogue and then using SIMBAD444http://simbad.u-strasbg.fr/simbad/ or NED555http://ned.ipac.caltech.edu/ databases if no counterpart was found in the 2FGL catalogue.
Finally we focus on the pixels where no sources with previously known variability was found. That comprises both pixels with known gamma-ray sources that were supposed to be non-variable and pixels with some previously unknown gamma-ray sources not included in the 2FGL catalogue. Therefore we discard the pixels containing sources with variability reported in ATels, on the Fermisky blog, or in the papers e.g. (Ackermann et al., 2013) and (Abdo et al., 2010), or, finally, if their variability indices in the 2FGL catalogue exceed the ’official’ threshold value 41.6. In the end it left us with 8 pixels out of 100 corresponding to 8 different sources.
With 8 remaining pixels we perform more thorough search in the following manner: first, we find a location of the apparent excess using the gttsmap utility. Known 2FGL sources and the Galactic and isotropic diffuse components were included in the initial sky model that was provided as an input for gttsmap. In two cases (pix.34, pix. 9067) no new significant excess was found meaning that the flares occurred in the sources from the 2FGL catalogue. These sources were identified by their large TS values in the results of standard gtlike fit. Variability in these pixels was caused by 2FGL sources FBQS J122424.1+243623 (MS 1221.8+2452) and GB6 J0043+3426 correspondingly. The first one is BL Lac type object at the redshift that was recently observed also in the TeV energy range by the MAGIC collaboration (Cortina, 2013), the latter one is a blazar at the redshift . In the remaining six cases (see Fig. 1) we have used gtfindsrc in order to refine the positions of the sources (see Table 1).
We have performed searches in the NED and SIMBAD databases using the best fit positions and reported errors obtained earlier. One of the sources may be identified with a high confidence: the reported variability in the 431-th pixel was caused by the 3EG J1424+3734 BL Lac type object that was included into the 3rd EGRET catalogue (Hartman, 1999) and also into the first Fermi LAT catalogue (1FGL) (Abdo, 2010). However it is absent in the 2FGL catalogue and that clearly indicates its long-time variability. The other five sources were linked with the known radio- and X-ray sources from the NED and SIMBAD databases. One of the five, PKS 0226-559 (pix.11255), is a blazar with a redshift (Healey et al., 2008). Two other sources, PKS J0030-0211 (pix. 11696) and PMN J0225-2603 (pix. 11901666There is a possibility that the variability in this pixel was caused by another source, 1RXS J022517.5-260926 located only 6.6 arcmin away from our best localization of the source but a flat-spectrum radio source PMN J0225-2603 looks a more plausible candidate.) are flat-spectrum radio sources. Two remaining candidate sources 1RXS J161939.9+765515 (pix. 2663) and PMN J2320-6447 (pix. 10871) has no classification type.
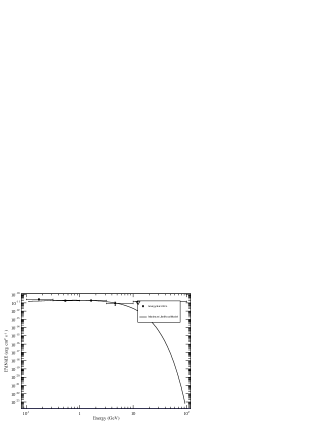
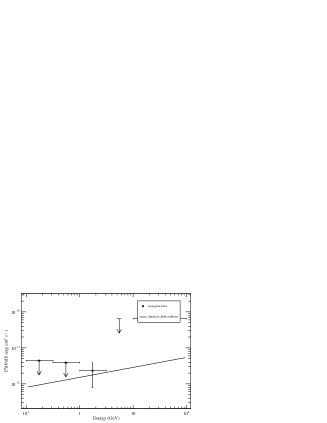
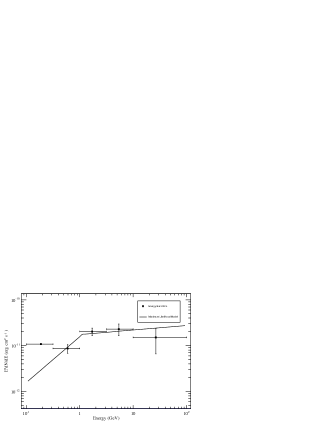
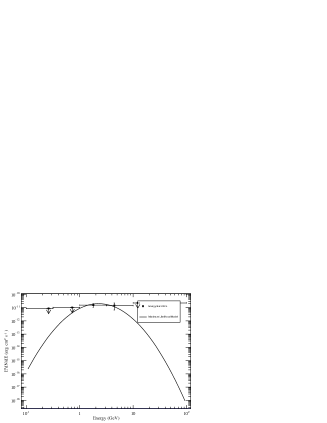
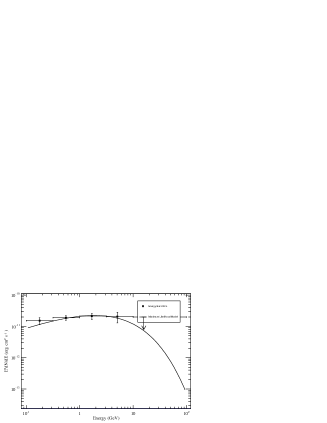
We have accomplished a detailed analysis of the spectra of these sources. We have carried out gtlike fit in two energy intervals – (0.1-100 GeV) and (1.0-100 GeV) adding new sources to the source model files obtained from the 2FGL catalogue. Also we conduct fits in (0.1-100 GeV) interval using the spectral models other than just a simple power-law. The results are presented in the Tables 2,3. We plot the spectral energy distributions (SEDs) using the python-based package likeSED.py777http://fermi.gsfc.nasa.gov/ssc/data/analysis/user/(figs. (2-3)). The spectral shapes demonstrate significant deviation from the simple power law. For a majority of sources their SEDs peak at around GeV. In all cases the spectra are rather hard – that makes them look very similar to the SEDs of the brightest flares of powerful blazars (Pacciani et al., 2014). Thus the observed variability seems to be caused by some sources with temporal and spectral properties close to highly-variable blazars.
4 Conclusions
We have performed a full sky blind search for regions with variable flux at energies above 1 GeV in the 308 weeks of the Fermi-LAT data. The variability of 8 gamma-ray sources was identified for the first time. Two of the sources are included in the second Fermi LAT source catalogue (2FGL), one was reported by the EGRET and in the First Fermi LAT source catalogue (1FGL), while the gamma-ray radiation from the five other sources is detected for the first time. The latter, using the NED and SIMBAD databases, were linked to the sources known in radio and X-ray bands. All detected variable sources demonstrate recurring flaring activity at time scales weeks which is typical for blazars. The SEDs of the sources in their high states are hard and deviate significantly from the simple power-law. The spectra of the most of the sources peak around few GeV. We note finally, that the variability property was for the first time employed to detect new gamma-ray sources.
Acknowedgements
The work was supported by the RFBR grant 13-02-01293. M.P. and G.R. acknowledge the fellowships of the Dynasty foundation. The analysis is based on data and software provided by the Fermi Science Support Center (FSSC). The numerical part of the work was done at the cluster of the Theoretical Division of INR RAS. This research has made use of NASA’s Astrophysics Data System, NASA/IPAC Extragalactic Database (NED) which is operated by the Jet Propulsion Laboratory, California Institute of Technology, under contract with the National Aeronautics and Space Administration, and the SIMBAD database, operated at CDS, Strasbourg, France.
Update
When this paper was already finished, the Fermi LAT Third Source Catalog (The Fermi-LAT Collaboration, 2015) has appeared on the arXiv. We have checked for our variable sources from the Table 4 there. Both 2FGL sources (pix.34, pix.9067) are in the 3FGL catalogue as well. Sources that were responsible for the variability in the pixels 11255, 11696, 11901 (PKS 0226-559,PKS B0027-024, PMN J0225-2603) are firmly estabisished in the new catalogue. However, 3EG J1424+3734 (pix.431) is absent from the catalogue. Also our identification in the pix. 2663 (1RXS J161939.9+765515) is 1.3∘ away from the closest 3FGL source, which in turn lacks identification. Our identification of the source in the pix. 10871 PMN J2320-6447 differs from the 3FGL – PMN J2321-6438 () which is 26.1′ away from our best localization position () that has an error 5.5′.
References
- Abdo et al. (2010) Abdo A. A., Ackermann M., Ajello M. e. a., 2010, ApJ, 722, 520
- Abdo (2010) Abdo A. e. a., 2010, Astrophys.J.Suppl., 188, 405
- Ackermann et al. (2013) Ackermann M., Ajello M., Albert A. e. a., 2013, ApJ, 771, 57
- Bregeon et al. (2013) Bregeon J., Charles E., M. Wood for the Fermi-LAT collaboration 2013, ArXiv e-prints
- Cortina (2013) Cortina J., 2013, The Astronomer’s Telegram, 5038, 1
- Górski et al. (2005) Górski K. M., Hivon E., Banday A. J., Wandelt B. D., Hansen F. K., Reinecke M., Bartelmann M., 2005, ApJ, 622, 759
- Hartman (1999) Hartman R. e. a., 1999, Astrophys.J.Suppl., 123, 79
- Healey et al. (2008) Healey S. E., Romani R. W., Cotter G., Michelson P. F., Schlafly E. F., Readhead A. C. S., Giommi P., Chaty S., Grenier I. A., Weintraub L. C., 2008, ApJS, 175, 97
- Nolan et al. (2012) Nolan P. L., Abdo A. A., Ackermann M., Ajello M., Allafort A., Antolini E., Atwood W. B., Axelsson M., Baldini L., Ballet J., et al. 2012, ApJS, 199, 31
- Pacciani et al. (2014) Pacciani L., Tavecchio F., Donnarumma I., Stamerra A., Carrasco L., Recillas E., Porras A., Uemura M., 2014, ApJ, 790, 45
- Pshirkov & Rubtsov (2013) Pshirkov M. S., Rubtsov G. I., 2013, Soviet Journal of Experimental and Theoretical Physics, 116, 59
- The Fermi-LAT Collaboration (2015) The Fermi-LAT Collaboration 2015, ArXiv e-prints
| no | Pixel no. | error, ′ | ||
|---|---|---|---|---|
| 1 | 431 | 67.33 | 68.10 | 3.0 |
| 2 | 2663 | 110.32 | 34.47 | 6.6 |
| 3 | 10871 | 317.64 | -49.67 | 5.5 |
| 4 | 11255 | 278.42 | -56.52 | 4.0 |
| 5 | 11696 | 110.79 | -64.59 | 3.0 |
| 6 | 11901 | 215.54 | -69.14 | 3.5 |
| no | Pixel no. | \pbox8 cm | |||||||
|---|---|---|---|---|---|---|---|---|---|
| \pbox8 cm | |||||||||
| \pbox8 cm | |||||||||
| \pbox8 cm | |||||||||
| 1 | 34 | 1.71 | 0.004 | 2.00 | 0.06 | ||||
| 2 | 431 | 0.03 | 1.710 | 0.005 | 0.85 | 0.05 | 2.07 | 0.04 | |
| 3 | 2663 | 0.68 | 1.72 | 0.01 | 0.14 | 0.05 | 2.18 | 0.34 | |
| 4 | 9067 | 5.3 | 0.07 | 1.68 | 0.006 | 1.2 | 0.06 | 1.97 | 0.03 |
| 5 | 10871 | 2.3 | 0.07 | 1.64 | 0.01 | 0.75 | 0.19 | 2.44 | 0.30 |
| 6 | 11255 | 8.5 | 0.2 | 1.99 | 0.007 | 0.95 | 0.19 | 2.40 | 0.29 |
| 7 | 11696 | 22 | 2.9 | 2.11 | 0.098 | 0.75 | 0.19 | 2.44 | 0.30 |
| 8 | 11901 | 12 | 0.1 | 2.15 | 0.003 | 0.95 | 0.16 | 2.81 | 0.26 |
| no | Pixel no. | PL | BPL | LP | PLEC |
|---|---|---|---|---|---|
| 1 | 34 | 134.8 | 137.6 | 136.5 | 136.5 |
| 2 | 431 | 159.0 | 162.9 | 165.7 | 167.5 |
| 3 | 2663 | 25.0 | 25.4 | 26.2 | 26.5 |
| 4 | 9067 | 260.1 | 264.9 | 262.7 | 261.0 |
| 5 | 10871 | 43.2 | 52.6 | 58.6 | 56.9 |
| 6 | 11255 | 244.6 | 248.4 | 249.1 | 250.2 |
| 7 | 11696 | 297.9 | 298.8 | 298.5 | 299.1 |
| 8 | 11901 | 203.2 | 208.4 | 208.3 | 210.0 |
| no | Pixel no. | source identification | distance, ′ | source type | In 2FGL | ||||
|---|---|---|---|---|---|---|---|---|---|
| 1 | 34 | 236.25 | 84.15 | 610 | FBQS J122424.1+243623 | - | TeV BLL | yes | |
| 2 | 431 | 67.33 | 68.10 | 419 | 3EG J1424+3734 | 2 | BLL | no | |
| 3 | 2663 | 110.32 | 34.47 | 574 | 1RXS J161939.9+765515 | 10 | ? | no | |
| 4 | 9067 | 120.94 | -28.63 | 840 | GB6 J0043+3426 | - | blazar | yes | |
| 5 | 10871 | 317.64 | -49.670 | 351 | PMN J2320-6447 | 0.2 | ? | no | |
| 6 | 11255 | 278.42 | -56.52 | 55 | PKS 0226-559 | 7 | blazar | no | |
| 7 | 11696 | 110.79 | -64.59 | 326 | PKS J0030-0211 | 2 | flat-spectrum radio source | no | |
| 8 | 11901 | 215.54 | -69.14 | 289 | PMN J0225-2603 | 7 | flat-spectrum radio source | no |
(a)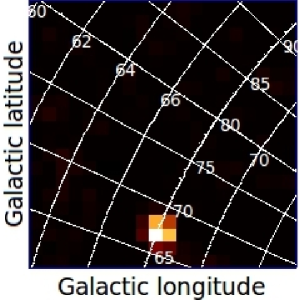
 (b)
(b)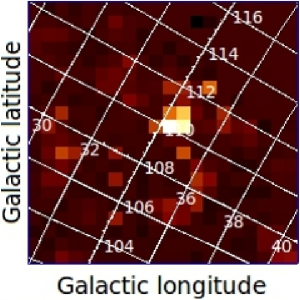

(c)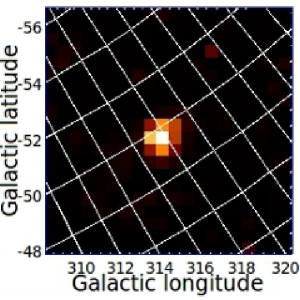
 (d)
(d)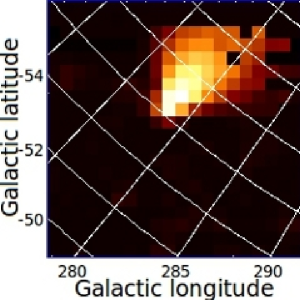

(e)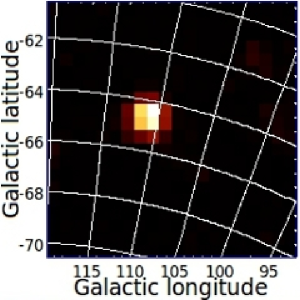
 (f)
(f)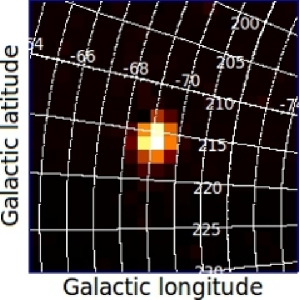
(a)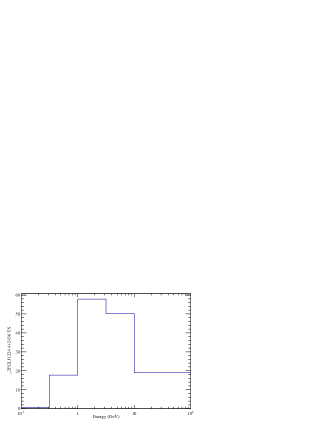

(b)

(c)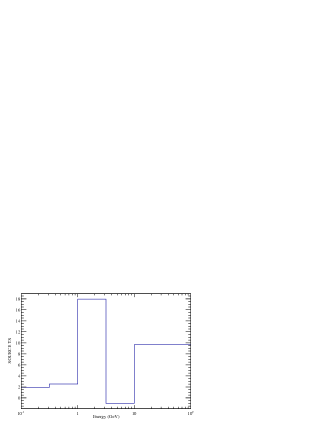
(d)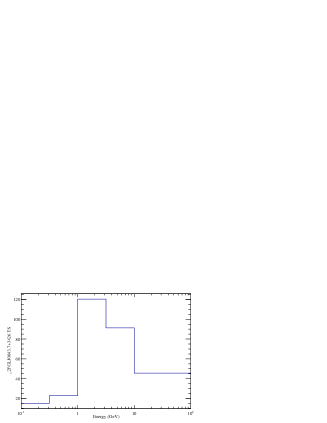
(a)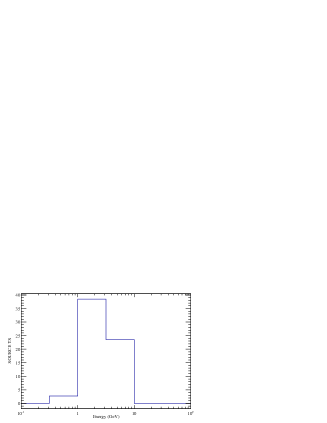
(b)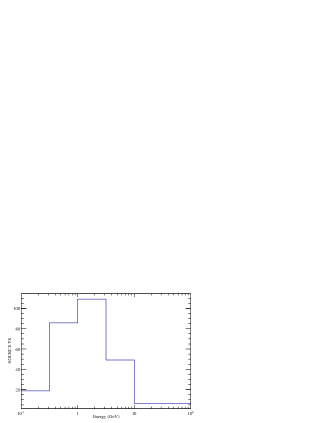
(c)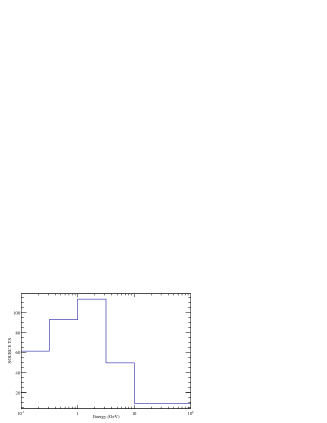

(d)