A Spitzer/IRAC Characterization of Galactic AGB and RSG Stars
Abstract
We present new Spitzer/IRAC observations of 55 dusty Long Period Variables (LPVs, 48 AGB and 6 RSG stars) in the Galaxy that have different chemistry, variability type, and mass-loss rate. O-rich AGB stars (including intrinsic S-type) tend to have redder [3.6][8.0] colors than carbon stars for a given [3.6][4.5] color due to silicate features increasing the flux in the 8.0 µm IRAC band. For colors including the 5.8 µm band, carbon stars separate into two distinct sequences, likely due to a variable photospheric C3 feature that is only visible in relatively unobscured, low mass-loss rate sources. Semiregular variables tend to have smaller IR excess in [3.6][8.0] color than Miras, consistent with the hypothesis that semiregular variables lose mass discontinuously. Miras have redder colors for longer periods while semiregular variables do not. Galactic AGB stars follow the period-luminosity sequences found for the Magellanic Clouds. Mira variables fall along the fundamental pulsation sequence, while semiregular variables are mostly on overtone sequences. We also derive a relationship between mass-loss rate and [3.6][8.0] color. The fits are similar in shape to those found by other authors for AGBs in the LMC, but discrepant in overall normalization, likely due to different assumptions in the models used to derive mass-loss rates. We find that IR colors are not unique discriminators of chemical type, suggesting caution when using color selection techniques to infer the chemical composition of AGB dust returned to the ISM.
keywords:
stars: AGB and post-AGB, carbon, mass loss – infrared: stars1 Introduction
The Asymptotic Giant Branch (AGB) is the last evolutionary phase of low and intermediate mass stars ( M⊙), before the brief post-AGB phase that leads them to become white dwarfs. AGB stars are characterised by complex nucleosynthesis, high mass-loss rates, and variability. They are the source of a large fraction of the mass returned by stars to the Interstellar Medium (ISM, Sedlmayr, 1994). In particular, they are believed to be the primary ‘dust factories’ in galaxies (Gehrz, 1989; Boyer et al., 2012), even though recent observations have re-evaluated the role played by supernovae (see e.g. Matsuura et al., 2011; Dwek & Cherchneff, 2011). It is clear, however, that understanding mass-loss in AGB stars is instrumental for modeling the chemical evolution of galaxies.
The composition of the material returned from AGB stars to the ISM depends on the chemistry of the star, which is determined by its initial mass and evolutionary history. The latter is crucially regulated by mass loss. Most stars enter the AGB with an intrinsic C/O abundance ratio less than one (O-rich). In stars of M⊙ (Straniero et al., 1995, 1997) however, several dredge-up events following thermal pulses may drive the C/O ratio above unity. These stars become the so-called carbon stars. In stars above M⊙, however, carbon is destroyed by nuclear burning at the base of the convective envelope (Hot Bottom Burning; Smith & Lambert, 1985; Boothroyd & Sackmann, 1992) preventing it from reaching the surface of the star where it could be observed. These stars never transition to the carbon star phase. Mass limits constraining the formation of carbon stars depend on metallicity; low metallicity environments (e.g. the Magellanic Clouds) form carbon stars at lower masses. Intrinsic S-type stars share many characteristics with carbon stars such as similar masses and a rich s-element chemistry from many dredge-up events, but they lack sufficient carbon to drive the C/O ratio above one.
Stars with masses M⊙ do not enter the AGB phase, but become Red Supergiants (RSGs) on the way to ending their lives as Type II supernovae (e.g. Massey & Olsen, 2003; van Dyk et al., 2003). RSGs do not experience third dredge up episodes and as such they are characterised by an O-rich chemistry (e.g. Verhoelst et al., 2009). More luminous than AGB stars, but with similar spectral types, they are also subject to variability and mass loss. Their dust production rates are comparable to those of AGB stars but their overall yield to the ISM is lower, due to RSGs being more rare than their lower mass counterparts in the AGB (e.g. Boyer et al., 2012).
AGB and RSG stars lie close to an instability region of the Hertzsprung-Russell diagram and as such they exhibit long period variability of Mira, semiregular, and irregular type with periods on the order of hundreds to thousands of days. Period-luminosity diagrams of long period variables (LPVs) in the Magellanic clouds (LMC and SMC) reveal sequences that appear to correspond to the variable pulsation mode, binarity and other as yet unknown characteristics (Wood, 2010). These diagrams can be a powerful tool for studying the pulsation mode for a large population of variable stars. This is especially true when the available light curves are sparse and poorly sampled, making it difficult to detect additional periodicity (e.g. overtone pulsations) in the amplitude modulations of the light curve. The construction of similar diagrams for Galactic AGB stars would be extremely useful, as they would illuminate the role of metallicity in determining the pulsation properties of these variables. Efforts in this sense depend critically on accurate and precise distance measurements for Galactic LPVs (Whitelock et al., 2008).
Pulsations and mass loss are inextricably linked in AGB and RSG stars (see e.g. Willson, 2000) since radial pulsations aide in the formation of the dust-driven winds responsible for the characteristic high mass-loss rates of AGB stars ( M⊙ yr-1 up to M⊙ yr-1, e.g. Wood et al. 1983, 1992; van Loon et al. 1999, as compared with M⊙ yr-1 to M⊙ yr-1, e.g. Mauas et al. 2006; Dupree et al. 2009 for Red Giant Branch stars). The dusty wind that results from these mass-loss processes, before elements synthesized in AGB stars are released into the ISM, leads to the formation of dusty cocoons enshrouding the star. These circumstellar envelopes obscure optical radiation, making observation of mass-losing AGB stars difficult at visible wavelengths. However, thermal radiation from the dust makes AGB stars extremely luminous in the infrared (IR). The InfraRed Array Camera (IRAC, Fazio et al., 2004) on board the Spitzer Space Telescope (Werner et al., 2004) operates in the mid-IR and is an ideal instrument for characterizing AGB stars according to their chemical composition, mass-loss rate, and variability class. IRAC’s four channel imaging during the Spitzer cryogenic mission was especially well-suited to observe the prominent dust and molecular spectral features in AGB stars – for example, H2O, SiO, CO2, and CO among others for O-rich stars and C2H2, HCN, CS, and C3 for carbon stars.
Due to their intrinsic brightness and red colors, AGB stars are easily detected by IRAC and have been found in numerous IRAC surveys of the Milky Way (e.g. GLIMPSE, Benjamin et al. 2003; Churchwell et al. 2009) and Local Group galaxies (e.g. SAGE, Meixner et al. 2006; Blum et al. 2006; Boyer et al. 2011). However, there have been no studies specifically designed to characterise in the IRAC bands a sample of Galactic AGB stars with well determined chemical type, variability, and mass-loss rate. To fill this gap, we designed a program to observe a nearby sample of Galactic AGB stars with IRAC in order to better identify AGB stars in IRAC surveys, to facilitate Galactic population synthesis studies, and to better understand the chemical evolution of the diffuse matter in the ISM.
We have observed 48 Galactic AGB stars, representing each of the main types of AGB stars – O-rich, S-type, carbon stars, Mira, semiregular, and irregular variables as well as 6 RSGs of semiregular and irregular variability type. We outline our target selection in Section 2. Section 3 describes the data reduction pipeline and how the photometry was derived. We present the IRAC colors of AGB stars in Section 4 and discuss period, magnitude and color relations in Section 5. Relationships with the mass-loss rate are explored in Section 6. We summarise our conclusions in Section 7.
2 Target Selection
Our target list was selected from a number of Galactic AGB star catalogs available in the literature (Loup et al., 1993; Kerschbaum & Hron, 1996; Adelman & Maher, 1998; Heras & Hony, 2005; Guandalini et al., 2006, and references therein) with the intention of representing all main types of AGB stars. Two main constraints limited our choice of targets: (1) the availability of distance estimates and (2) a band magnitude , to prevent excessive saturation with IRAC. While our target list is not a statistically significant sample of the Galactic AGB population, the sample is sufficiently large and diverse to allow a general study of the spectral energy distribution (SED) of Galactic AGB stars in the Spitzer/IRAC bands, and its overall dependence on their chemical, physical, and variability characteristics.
Distances for our target stars were derived either from interferometric observations (e.g. van Belle et al., 2002; Zhang et al., 2012), models of radio emission and/or bolometric luminosity (Loup et al., 1993; Olofsson et al., 2002; Guandalini et al., 2006; Guandalini & Busso, 2008; Schöier et al., 2013), and, in the absence of either of those, astrometric methods (van Leeuwen 2007, adopting the latest corrections of Hipparcos distances). The distance of our selected AGB targets varies from 0.14 to 1.85 kpc (with one single carbon star that has a distance of 4.21 kpc). The distances to previously observed supergiants have been derived with different methods found in the literature (see notes on Table 1).
The complete sample is listed in Table 1, and is divided in three main categories: 22 O-rich AGB stars (M III spectral type), 7 intrinsic S stars, 19 carbon stars, and 6 supergiants. In each category we have a similar number of Mira, semiregular and irregular variables, with periods ranging from 50 to 822 days. Information about the period and variability type of the targets was obtained from the General Catalog of Variable Stars (GCVS, Samus et al., 2012). Estimated mass-loss rates were obtained from radio observations of CO or HCN in the outer envelope, or fitting detailed radiative transfer models of the circumstellar emission to the infrared SED (see Loup et al., 1993; Olofsson et al., 2002; Guandalini et al., 2006, and references therein). The mass-loss rates of our target stars range from to yr-1 in each category. Mass-loss rates for the supergiants were estimated by various methods (see notes in Table 1). Near-IR photometry was obtained (for random epochs) from the 2MASS catalog (Skrutskie et al., 2006). While higher quality near-IR photometry exists for some of the stars in our sample, we chose to adopt 2MASS photometry for uniformity across the sample. The uncertainty of the 2MASS magnitudes are already smaller than the amplitude of the infrared variability of our LPVs. In absence of complete light-curves for all stars in the sample from which to calculate average magnitudes, this obviates the need for single epoch photometry with better precision than 2MASS.
Given the variability of the sources, we requested two epochs (six months apart, as constrained by the Spitzer visibility windows) for each target, in order to check for variations in the IRAC photometry on time-scales of several months.
3 Observations and Data Reduction
We restricted our target list to nearby AGB stars with estimates of their distance. Given the intrinsic luminosity () and red colors of AGB stars, these targets saturate the IRAC detectors even at the shortest IRAC subarray frame times. While saturated images are not suitable for aperture photometry, reliable photometry can be recovered with Point Spread Function (PSF) fitting, as long as at least part of the PSF is not saturated. To compromise between the need to limit the amount of saturation in our images and, at the same time, fill enough of the IRAC field-of-view with high S/N unsaturated portions of the PSF, we adopted the 2 sec full-frame IRAC Astronomical Observation Template. To allow for efficient removal of outliers (bad pixels and cosmic rays), and sufficient spatial sampling of the unsaturated PSF optical features (diffraction spikes and rings), we observed each target using the 5-point small scale Gaussian dither pattern.
The data were acquired between 2006 June 2 and 2008 June 20 as part of the IRAC Guaranteed Time, with PID 30411. Starting with the Basic Calibrated Data (BCD) produced by the Spitzer Science Center (SSC) pipeline version S14.4.0, we generated a mosaiced image for each source, using our own post-BCD software IRACproc (Schuster et al., 2006). IRACproc is an add-on to SSC’s MOPEX mosaicing software, that applies more sophisticated outlier rejection criteria. With the optimised parameters from IRACproc, MOPEX defines a fiducial image frame that contains the coordinates for the constituent frames, removes transients using temporal outlier rejection and then interpolates the frames to produce a mosaic image. The final mosaic is scaled to 0.863′′/pixel which is of the IRAC pixel scale (half of the IRAC native pixel area), to provide ideal (Nyquist) sampling even at the shortest IRAC wavelengths.
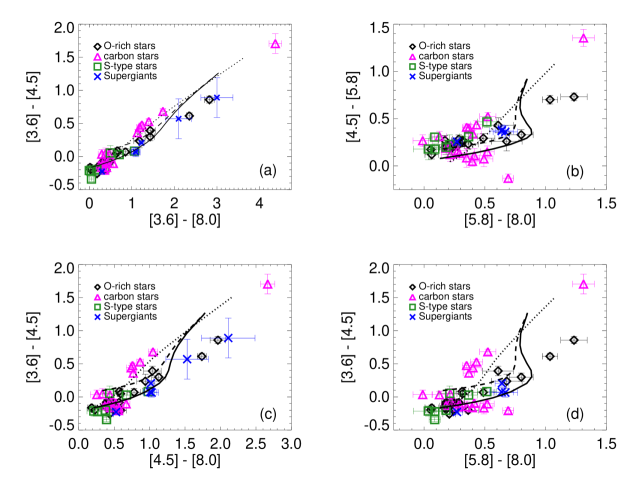
Table 3 lists the measured IRAC Vega magnitudes for all
sources. The adopted PSF fitting technique, developed specifically for
heavily saturated IRAC images, is described in Marengo et al. (2009). As an
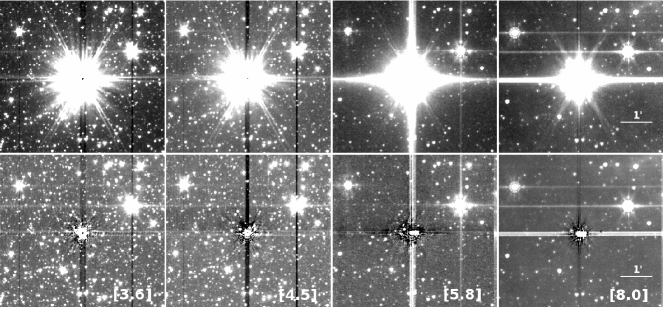
example of this procedure, Figure 1 shows the
O-rich AGB star CZ Ser, shown before and after the PSF is fit and
subtracted from the target. We used a high dynamic range image of the
IRAC PSF111available at the IRSA website:
http://irsa.ipac.caltech.edu/
data/SPITZER/docs/irac/calibrationfiles/psfprf/
in each band, made from a combination of individual images of
a set of stars with different brightness (Sirius, Vega, Fomalhaut,
Eridani, Indi, and the IRAC calibrator
BD68 1022). The PSF intensity is scaled to match the actual IRAC
observations of Vega in each band, providing an absolute
photometric reference, and is super-sampled over a grid with
0.24′′/pixel. By fitting the unsaturated parts (diffraction spikes
and PSF ring and “tails”) of each target star image, we have
measured the flux ratio between the stars in our sample and Vega.
The typical uncertainty of this procedure is 25% (constrained by
comparing the amplitude of the PSF subtraction residuals with
the background and source photon noise), and is comparable to the
typical absolute aperture photometry of unsaturated stars with IRAC.
The photometry of the six supergiants from the literature
obtained from Schuster (2007) use the same PSF-fitting technique.
4 IRAC Colors of Galactic AGB Stars
Ground-based mid-IR colors have been used extensively to characterise the physical and chemical properties of the circumstellar envelopes of evolved stars (see e.g. Marengo et al. 1999 and references therein). The IRAC bands offer a similar opportunity, as they span a wavelength range rich in strong molecular and dust features, and they are free from variable telluric absorption lines. These features correlate with the chemical signature of the circumstellar environment, dust mineralogy, and abundance in the stellar wind. Note that in the IR, interstellar extinction is dramatically reduced with respect to the visible; as a consequence the mid-IR and near-IR colors of our sources are mainly determined by photospheric and circumstellar features.
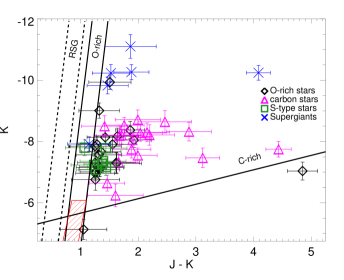
Figure 2 shows a number of IRAC color-color diagrams for all target sources. Each source is plotted once, using the average color of the two observed epochs. The sources tend to be organized on a sequence of increasing excess colors, matching the overall distribution of colors found by Marengo et al. (2007) using synthetic IRAC photometry derived from Infrared Space Observatory Short Wavelength Spectrometer (ISO SWS, Valentijn et al., 1996) spectra (from Sloan et al. 2003). The largest dispersion is in the [3.6][8.0] color (panel a). Radiative transfer models (see e.g. Groenewegen 2006) show that this sequence is related to increasing amounts of circumstellar dust, indicating larger mass-loss rates (assuming wind velocities, dust opacities, and a uniform dust-to-gas mass ratio across the sample). We explore quantitatively the correlation between mass-loss rates and IRAC colors in section 6.
Stars extending along the infrared excess sequence tend to separate according to their circumstellar chemistry. O-rich and intrinsic S-type AGB stars, as well as the supergiants, tend to have a redder [3.6][8.0] color (for the same [3.6][4.5] color), due to the presence of silicate features dramatically increasing their flux in the 8.0 µm band. This separation is only effective for sources with moderate infrared excess, e.g. mag.
The Groenewegen (2006) models we selected miss the location of the most extreme O-rich AGB stars in all of the color-color diagrams. This may be due to the choice of dust chemistry in the model. In Figure 2, we plot models using a mixed chemistry – 60% aluminum oxide (amorphous porous Al2O3) and 40% silicates (see Groenewegen, 2006, for details). More recent papers have shown that the choice of optical constants affects the predicted flux of the silicate feature near 10 µm (see Groenewegen et al., 2009). This suggests that the particular silicate opacities employed in the model may lead to the inaccurate determination of the dust mass-loss rate.
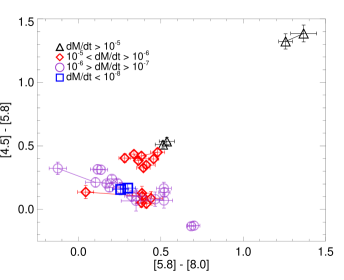
Plots including colors with the 5.8 µm band (panels b and d) instead show an unexpected separation of carbon stars into two distinct branches. Both branches show similar [5.8][8.0] excess, but the upper branch continues to get progressively redder in both [4.5][5.8] and [3.6][4.5] colors, whereas stars in the lower branch tend to get bluer in the [4.5][5.8] color. This divergence suggests the presence of a broad absorption feature at 5.8 µm. Looking at just the carbon stars in [5.8][8.0] versus [4.5][5.8] color and using different symbols to indicate increasing mass-loss rate (Figure 3), we see that the separation is related to the mass-loss rate listed in Table 1. Stars with higher mass-loss rates are on the upper, red branch, while stars with lower mass-loss rates populate the lower, blue track. This dichotomy suggests that the feature responsible for the 5.8 µm absorption is likely photospheric, being masked by thicker dusty envelopes in sources with higher mass-loss rates.
To identify this feature, and to match the observed trends in the IRAC colors with specific spectral features, we retrieved archival spectra (Sloan et al., 2003) for all of our sources that were observed with ISO SWS. We have also compared our colors with the synthetic photometry of 122 AGB and RSG stars of different chemical type, derived by Marengo et al. (2007) by convolving available ISO/SWS spectra with the IRAC passbands. Some of these sources have been observed by ISO at multiple epochs allowing a direct test of the effect of variable spectral features on the IRAC colors. Representative examples are shown in Figure 4. The spectrum of carbon stars along the blue branch (e.g. VX And in the top panel) exhibits a strong C3 absorption feature centred at 5 µm. This feature is not present in the spectra of stars in the redder branch (e.g. V CrB and T Ind). Based on Sloan & Price (1998), C3 is assumed to be developing in the atmospheres of dust poor carbon stars. This feature disappears in stars with thicker circumstellar envelopes, either because it is filled by the continuum dust emission, or because the molecule making the feature is depleted. As noted in Marengo et al. (2007), this feature appears to be transient, as some sources observed with ISO SWS in multiple epochs do not show it in all spectra. This suggests that the feature variability is related to changes in the C3 abundances in the stellar atmosphere as the star pulsates, rather than changes in the dust content of the circumstellar envelope (which is unlikely to show large scale variations on the short time-scales of the ISO repeated observations, although such variations are found on longer time-scales, see e.g. Whitelock et al., 2006).
The spectra of carbon stars present several other molecular features in the IRAC passbands (CO, C2H2, HCN and CS). C2H2 falls mostly outside the 3.6 µm band, and does not contribute significantly to the [3.6][4.5] color of the carbon stars. CO absorption in the 4.5 µm band more likely contributes to the negative (as low as mag) [3.6][4.5] color of the carbon stars with low overall infrared excess. All these molecular absorption features are filled by dust continuum emission for the redder sources, explaining the general trend of increasing [3.6][8.0] color for stars with larger circumstellar dust content.
The mid-IR spectra of the O-rich sources (middle panel), intrinsic S-stars and a red supergiant (bottom panel) are also rich in several molecular features (including CO, H2O, SiO, CO2 and SO2). Of these, the features that have the largest effect on the IRAC colors are SiO, CO2, and CO bands that can severely depress the 4.5 µm flux leading to blue [3.6][4.5] colors (as low as mag) for the sources with less overall infrared excess. Sources with high dust content show the prominent 10 µm silicate feature in emission. As mentioned before, this feature is partially captured by the 8.0 µm band, causing the [3.6][8.0] color to be redder for higher mass-loss rates. There are no significant differences between the colors of the individual types of O-rich sources, as evidenced by the fact that M-type AGB stars, intrinsic S-stars and red supergiants all trace the same color sequence.
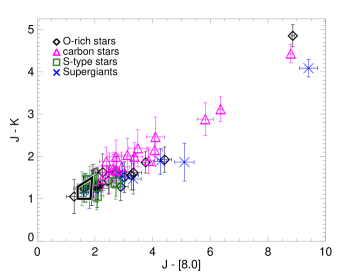
A number of classification schemes for the chemistry of AGB stars rely on the combination of IRAC with near-IR colors. Figures 7 and 8 in Boyer et al. (2011), for example, show how O- and C-rich sources in the SMC and LMC segregate according to their J[8.0] color. With this scheme, O-rich AGB stars have mag and C-rich AGB stars have mag, with the so-called “anomalous” O-rich population having intermediate color. We do not see this segregation for Galactic AGB stars, as shown in our Figure 5, where C-rich and O-rich AGB stars overlap above mag and intrinsic S-type stars (proposed as one possible explanation for the LMC/SMC anomalous O-rich AGB class) overlap with the range of the anomalous O-rich AGB stars (see box in Figure 5).
The fact that we have several O-rich AGB stars that have significantly redder colors than most O-rich AGB stars in the Magellanic Clouds may be the consequence of the different evolutionary paths of the two AGB populations in galaxies with different metallicity. AGB stars are observed to have redder colours at higher metallicities because the gas to dust ratio increases (van Loon, 2000). We note that the few O-rich AGB stars in the Magellanic Clouds that have redder colours than the Galactic AGB stars in our sample are OH/IR stars (Wood et al., 1992; Marshall et al., 2004). As noticed by many authors (see, e.g. Ferrarotti & Gail, 2006; Ventura et al., 2012) a low metallicity environment favors the creation of carbon stars early in the evolution of an AGB star, when the mass-loss rate (and hence infrared excess) tends to be smaller. According to this hypothesis, LMC/SMC O-rich AGB stars are restricted to low J[8.0] excess, with only C-rich stars having redder J[8.0] colors due to their greater mass loss. This restriction would not be present in Galactic O-rich AGB stars, requiring a higher number of thermal pulses to transition to C-rich chemistry. Alternatively (though not in our sample), the neat color separation observed in the LMC/SMC C- and O-rich AGB stars could be explained by the selection method used to identify the chemical type of the source. LMC/SMC AGB catalogs are typically based on near-IR colors (see e.g. Figure 5 in Boyer et al. 2011) while the chemistry of our targets has been identified spectroscopically. This second possibility is supported by the large range in infrared colors exhibited by spectroscopically identified C- and O-rich LMC AGB stars (see e.g. Matsuura et al. 2009). Finally, this may be a selection bias in our sample as we have selected sources with measurable mass-loss rates, and hence a larger infrared excess.
The two reddest O-rich AGB stars in our sample are KU And and V1300 Aql. Both have red [3.6][8.0] color and V1300 Aql is the reddest in the near-IR (consistent with its fainter J-band magnitude indicative of higher circumstellar extinction, see Table 1). Several (5) of our O-rich AGB stars have [5.8][8.0] vs. [3.6][4.5] color sufficiently red that they would be considered extreme AGB stars by Boyer et al. (2011). In fact, all of our O-rich AGB stars are redder than the color cut Boyer et al. (2011) use to isolate O-rich AGB stars in the LMC (see Figure 6).
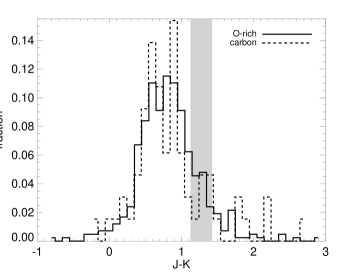
To test whether the redder colors of our O-rich AGB stars are representative of the Galactic AGB population, or rather are the consequence of selection effects, we extracted the 2MASS photometry of all Mira and semiregular variables in the GCVS (Samus et al., 2012) with known chemical type. The median color (0.85 mag) of this larger sample of O-rich AGB stars falls within the Boyer et al. (2011) color cut, suggesting that the red colors of the O-rich AGB stars reflect our choice of O-rich AGB stars with measured mass-loss rates, and thus greater IR excess (see Figure 7). It should be noted, however, that a large fraction of the GCVS carbon stars have a color falling outside the boundaries of the Boyer et al. (2011) C-rich color cut. Javadi et al. (2011) also find that carbon stars are less red at similar metallicities in M33. We find that 78% of the C-rich AGB stars in the Galaxy are bluer than mag (the color selection criteria from Boyer et al., 2011, for K mag, see Figure 6). Based on this, the majority of C-rich sources would likely be misclassified as O-rich sources. However, sources in the GCVS tend to be optically selected, and as such are biased toward low circumstellar extinction (small mass-loss rates), and may sample less-evolved, non-dusty AGB stars that behave very differently than their more evolved, dustier counterparts (Boyer et al., 2011).
4.1 Source Variability
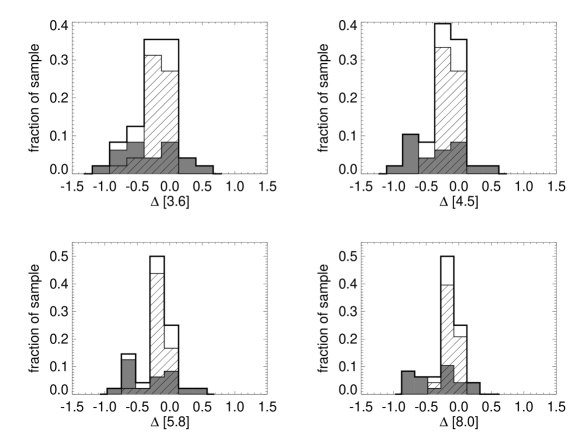
The availability of two separate epochs, while not sufficient to reconstruct a full light-curve, is enough to estimate the average variations of LPVs in the IRAC bands. Figure 8 shows the histograms of the average magnitude change between epochs for all sources in our sample. The RMS variations are 0.29, 0.28, 0.27, and 0.26 mag at 3.6, 4.5, 5.8 and 8.0 µm respectively. This is much larger than the RMS variations expected for a sample of non-variable stars ( mag for all bands), based on the average photometric uncertainty. As expected, the IRAC bands are affected by the variability of the sources to a much smaller extent than the optical bands (where Mira light-curves can have amplitudes as large as 11 mag, Samus et al. 2012), with smaller variations for longer wavelengths. The smallest changes are observed for sources that are classified as semiregular or irregular variables (0.14, 0.12, 0.11, and 0.10 mag in each band), as expected because of their shorter periods and smaller pulsation amplitudes with respect to Miras (0.46, 0.45, 0.42, and 0.41 mag respectively).
The IRAC color changes between epochs are generally small ( mag), resulting in a small scatter in the color sequences shown in Figure 2. The largest variation is found in the [5.8][8.0] color for the carbon stars in the blue branch ( mag), affected by the variability of the C3 feature (see figure 3). One carbon star (RS Cyg) also shows a first epoch [3.6][8.0] color significantly bluer (by 0.31 mag) than all other carbon stars. Unfortunately, ISO SWS spectra are not available for this source. However, we found that our second epoch IRAC photometry closely fits the spectrum of another carbon star, T Ind. The first epoch IRAC photometry of RS Cyg is characterised by a much higher 3.6 µm flux than the second epoch, or the T Ind spectrum. We suspect that this fluctuation is due to unusually strong, variable C2H2 absorption, common in many of the ISO SWS spectra of the other carbon stars in our sample. and band spectra of RS Cyg taken at multiple phases would be required to confirm this hypothesis, and the existence of such broad variations in the strength of this absorption feature.
5 Period, Magnitude and Color Relations
LMC and SMC LPVs tend to organize themselves in a series of parallel sequences in optical and infrared period-luminosity diagrams (see e.g. Wood 2010; Riebel et al. 2010 and references therein). These sequences depend on the pulsation mode, binarity, and other not yet identified parameters (giving rise to poorly understood characteristics, like a long secondary period observed in some stars). The so-called C sequence is populated by fundamental mode pulsators. The brightest of the C sequence variables tend to be Miras, while the lower end of the sequence (straddling the RGB tip) is mainly inhabited by semiregulars. Sequence C’ (to the left of sequence C by ), is instead populated by first overtone semiregular variables. LPVs with higher overtone modes are organized in separate sequences (A and B) with even shorter periods. Stars with the mysterious secondary long period are found in sequence D, shifted by from the C sequence.
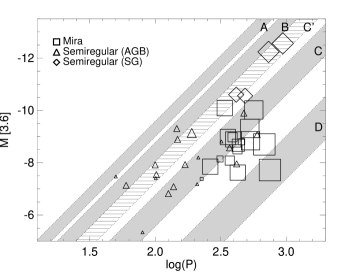
Figure 9 shows the period-luminosity diagram calculated for the 3.6 µm absolute magnitude (averaged between the two epochs) for our sample of AGB stars. Diagrams for the other three bands are similar. The sources classified in the GCVS (Samus et al., 2012) as Mira and semiregulars are indicated by different symbols. The size of the symbols is proportional to the [3.6][8.0] color (as a proxy for their mass-loss rate). The shaded bands for the individual sequences are derived from the approximate distribution of LMC LPVs in Riebel et al. (2010) where the [3.6] magnitude is taken as a proxy for the luminosity, and converted to absolute magnitudes using the LMC distance modulus of 18.5 (Freedman et al., 2001; Walker, 2011). These sequences are similar to those found by Wood (2010) using the band magnitude as a proxy for luminosity, however they have a slightly shallower slope (larger period for a given luminosity).
The location of our sources on the diagram is listed in Table 4 and is largely as expected, based on AGB stars in the Magellanic Clouds, confirming results found by Glass et al. (2009) using synthetic IRAC photometry from Marengo et al. (2007). Miras (squares) are all within or below the sequence C (fundamental pulsators), with the exception of the carbon star R For, which is in the first overtone sequence C’. A few of the Miras appear to be significantly under-luminous in the 3.6 µm band, up to 3 mag below the C sequence for their period, placing them in or near the secondary long period sequence D. Most of these stars (e.g. KU And and V1300 Aql) have large infrared excess due to their high mass-loss rate; their low 3.6 µm brightness may be caused by the large extinction due to their thick circumstellar envelope. Alternately, they may have increased their period as the stellar structure responds to the mass lost. The semiregular variables, as expected, are mostly located in the overtone sequences or the lower part of sequence C. Only four semiregulars (T Ind, VX And, BN Mon and RS Cyg, all carbon stars) are found in the area of the C sequence occupied by fundamental mode Miras. ET Vir is the faintest source in the plot, lying at the very bottom of sequence C. At a Hipparcos-determined distance of 0.14 kpc, ET Vir is also the nearest source in the sample. Given the large uncertainty on the parallax (%), we might expect that the luminosity has been underestimated due to an unreliable distance estimate. However, the Hipparcos value agrees well with the distance modulus calculated using the width of chromospheric Ca ii emission lines (Wilson, 1976) to determine the absolute magnitude, making it unclear why ET Vir is more than a magnitude fainter than the other sources in the sample. One possibility is that we observed ET Vir with lower luminosity following a thermal pulse. All semiregular AGB variables in our sample tend to have small infrared excess, so it is unlikely that their position in the diagram is significantly affected by extinction at 3.6 µm. The only semiregular variables with large excess are four supergiants (XX Per, W Per, NML Cyg, and VX Sgr), located at the top of sequence C’ as expected.
The general distribution of our Galactic LPVs in the period-luminosity diagram is characterised by a significantly larger spread than the variables in the Magellanic Clouds. As found by previous authors (see e.g. Tabur et al. 2010), this is primarily due to the larger uncertainty in the distance of Galactic LPVs, and possibly in the larger spread in their metal abundance, which also affects their period-luminosity relation. Despite these difficulties, the period-luminosity plot using the IRAC 3.6 µm band (where extinction is minimal, and infrared excess tends to be lower than at longer wavelengths) as a proxy for luminosity remains an important tool to study the pulsation mode of these variables, most of which only possess sparse and incomplete light-curves.
While period-magnitude relations are diagnostics of the pulsation mechanisms of several classes of variables, the infrared colors of AGB stars are dominated by dust emission and molecular absorption. The relationship between infrared colors and period, however, provides an excellent diagnostic to investigate the dependence of the circumstellar chemistry and mass-loss rate on the pulsation period. The [3.6][8.0] color, which is strongly affected by dust emission, is a good candidate for this analysis.

The results are shown in figure 10. Semiregular variables are distributed along a tight (RMS mag) period-color relation, statistically consistent with a zero slope, confined within a narrow color range ([3.6][8.0] mag). Note that all semiregulars, including the ones with larger period that appear to be on the fundamental mode sequence C, are part of the same period-color relation. The Mira variables are instead spread over a much larger range of colors ([3.6][8.0] mag), with longer period sources (on the D sequence) having the largest infrared excess. The two linear best-fitting relations are:
| (1) |
| (2) |
where the period is in days.
One possible explanation for this dichotomy is that the two groups of variables are characterised by different dust composition, affecting their excess in the IRAC bands. One problem with this interpretation is that there seems to be no difference between O-rich (M and S-type) and C-rich AGB stars, despite the very different source of the infrared excess (mainly continuum from amorphous carbon dust for carbon stars, and the 10 µm silicate feature in emission for M and S-type AGB stars). Another possibility is a difference in the amount of circumstellar dust responsible for the IR excess, i.e. a different mass-loss rate. While the median mass-loss rate of the Miras in our sample is indeed higher than for the semiregulars ( and yr-1 respectively), the separation is not as marked as in the color-period space. A third possibility is that the separation in color reflects different circumstellar dust temperatures. Given that the IRAC bands are sensitive to dust in the temperature range K, the observed dichotomy may indicate that semiregulars are deficient in the hot dust emission that is present in Mira variables. This is consistent with the suggestion in Marengo et al. (2001) that semiregular variables could have discontinuous mass-loss, spending a significant part of their time in the quiescent phase with only brief phases of higher mass-loss. According to this hypothesis, semiregulars would have more excess during these brief intervals of higher mass-loss, but once this phase has concluded, the dust would expand and cool, leading to a small [3.6][8.0] excess ( mag). Infrared color variations due to intermittent dust production have been found for many AGB stars (see e.g. Whitelock et al., 2006, and references therein), for both Mira and semiregular LPVs. Those variations have been attributed to the emission of dust clumps, similar to the ones observed with interferometric observations of the very obscured Mira carbon star IRC+10216 (Tuthill et al., 2000). The different color we observe between Mira and SR variables may reflect the fact that dust episodes in semiregulars happen on longer time-scales, giving the dust time to cool between each mass-loss episode. Less excess for the semiregulars would mean that their IRAC colors are a better reflection of the star’s intrinsic color (and not thermal emission from the dust). This would lead to the more strict period-color relation for semiregular than for Mira variables. Indeed it is the higher excess in Mira variables that would prevent a similarly tight relation.
6 Mass Loss and Comparison to LMC/SMC AGB stars
The intense mass-loss processes that are often active during the AGB phase are not well understood. Commonly used empirical mass-loss-rate formulas (see e.g. Salpeter, 1974; Reimers, 1975; Baud & Habing, 1983; Nieuwenhuijzen & De Jager, 1990; Vassiliadis & Wood, 1993) only provide an order-of-magnitude estimate of the mass-loss rate of AGB stars and cannot predict the actual mass-loss rate as a function of stellar parameters. Radiative transfer modeling can be used to infer the amount of circumstellar dust from excess flux measurements in the thermal infrared. Coupled with assumptions about the AGB wind velocity (usually km s-1) and the gas-to-dust mass ratio (typically in the range of the ISM ratio of ), these models can be used to provide estimates for AGB mass-loss rates from infrared photometric measurements. This can be achieved either by fitting the SED (see e.g. Gullieuszik et al., 2012; Riebel et al., 2012) of each source to a model or adopting a color – mass-loss relation (see e.g. models using realistic stellar atmospheres from Groenewegen, 2006; Groenewegen et al., 2009, 2007; Gruendl et al., 2008). These models show how high-mass-loss rate AGB stars of all types follow monotonically increasing sequences similar to those shown in Figure 2 (higher mass-loss rate, stronger infrared excess).
Figure 11 shows the mass-loss rate plotted as function of [3.6][8.0] color. Reflecting the color separation found in Figure 10, all semiregular variables are grouped in the mag color range. However, the overall mass-loss rates are comparable for the two groups. This is in accordance with the previously mentioned results found in Marengo et al. (2001; see discussion in Section 5), and since we would expect semiregular variables to show less excess than Mira variables if they are characterised by discontinuous mass-loss.
The overlap in the distribution of AGB stars of different chemical types echoes our finding that the majority of O-rich AGB stars in our sample have colors consistent with carbon stars (see Section 4). Because our sample of O-rich AGB stars is biased towards higher mass-loss rates, the most significant contributors of O-rich AGB dust are also the most likely to be mis-classified with color cuts alone, suggesting that care must be taken in inferring the chemical yield of AGB dust from color-selected stellar population studies.
Selecting for AGB stars with measured mass-loss rates may also explain the relatively high mass-loss rate that is characteristic of our sample. Our best-fit for the mass-loss rate as a function of [3.6][8.0] color for the O-rich AGB (excluding the supergiants) and C-rich AGB samples respectively, are:
| (3) |
While the small number of sources in either sample does not allow us to establish meaningful uncertainties to the fits, we note that the two curves approach each other for mag. This suggests that the mass-loss rate for red sources is similar, for a given value of the infrared excess, regardless of the dust chemistry. Our three supergiants with reliable mass-loss rate estimates follow a trend similar to the AGB stars, but as expected are shifted towards higher mass-loss rates.
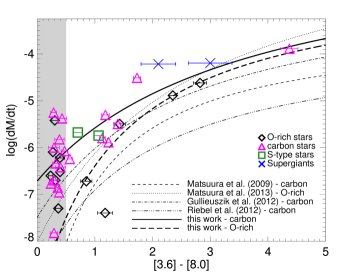
Similar fits are provided by different authors for AGB stars in the Magellanic Clouds. Figure 11 shows a selection of them (Matsuura et al., 2009, 2013; Gullieuszik et al., 2012; Riebel et al., 2012), based on the photometry obtained as part of the Spitzer/IRAC SAGE program. It is worth noting that the spread between the individual fits is large, as much as an order of magnitude in . This spread may be, in part, a consequence of the specific selection criteria adopted by different authors, leading to different biases in the AGB samples used in the fit. Different assumptions for the gas-to-dust ratio and wind velocity, as well as different optical constants used to model the sources will also contribute to the spread. While our best-fitting relations predict larger mass-loss rates for our Galactic AGB sample, the large uncertainty in the fit parameters and the spread between the Magellanic Cloud curves prevent us from deriving meaningful conclusions about the dependence of mass-loss rates on metallicity. Such a dependence is expected for O-rich AGB stars, but not for C-rich sources, since carbon is synthesized locally in the Thermally-Pulsing AGB stars, as argued by Matsuura et al. (2009). However, it is unclear whether the local synthesis of carbon increases the dust-to-gas ratio (see, e.g. van Loon et al., 2008). A large Galactic sample with reliable distances (that could be provided in the near future by GAIA) and radio-based mass-loss rate determinations will help resolve this issue.
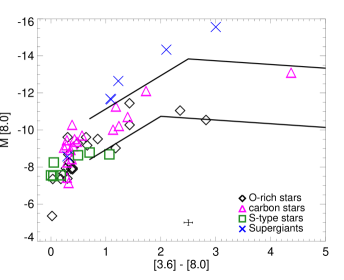
The selection criteria used by Matsuura et al. (2009, 2013) to differentiate evolved stars in the Magellanic Clouds result in a sample that is more directly comparable with our own Galactic sample. The sources in these works are identified by optical and infrared spectroscopy, avoiding the potential mis-classification of red O-rich sources (OH/IR stars and RSG) in the extreme AGB class (where most of the sources, at least in the Magellanic Clouds, are C-rich). Matsuura et al. (2013) show how spectrally classified sources of different type tend to separate into three different regions in the [3.6][8.0] versus [8.0] color-magnitude diagram. These three regions are overlaid on our sample in Figure 12. Note that for our Galactic sources, the bright supergiants also have the highest mass-loss rate plotted in Figure 11. Our two O-rich AGB stars with larger infrared excess are in the lowest luminosity region in the Matsuura et al. (2013) diagram, within the region where extreme C-rich AGB stars are expected. However, these two stars are characterised by a mass-loss rate as high as C-rich AGB stars with similar excess. As pointed out by Matsuura et al. (2013) and Riebel et al. (2012), the overall dust return of AGB stars to the ISM of the Magellanic Clouds is dominated by a handful of stars with very large mass-loss rates. In the Magellanic Clouds, most of these stars tend to be C-rich ‘extreme’ stars. The situation may be different in the Galaxy where a large number of very red OH/IR stars are found. These O-rich evolved stars, with mass-loss rates as high as the two reddest O-rich AGB stars in our sample, may contribute as much as the C-rich AGB stars to the overall dust budget in our Galaxy. A larger portion of O-rich AGB stars with high mass-loss rates in sources with near solar metallicity has indeed been observed in M33 (Javadi et al., 2013).
7 Conclusions
We present the results of the first study to characterise Galactic AGB stars in the IRAC bands. The sample consists of 48 AGB stars observed in two epochs – 22 O-rich, 19 carbon-rich, and 7 S-type – representing a diverse AGB population with well-determined distance, chemistry, variability type, and mass-loss rate. These are compared to 6 supergiants representing mass-losing evolved stars outside the AGB.
By fitting a PSF to unsaturated parts of the IRAC images, we derive reliable photometry in all four IRAC bands. From this, we compute the mid-IR colors of Galactic AGB stars. AGB stars with O-rich chemistry (including S-type AGB stars) tend to have redder [3.6][8.0] colors than carbon stars for a given [3.6][4.5] color, possibly driven by silicate emission in the [8.0] band. For colors including the 5.8 µm band, carbon stars separate into two distinct sequences. Carbon stars with higher mass-loss rates tend to lie along the redder branch, while sources along the blue branch have lower mass-loss rates. We interpret this as evidence of a photospheric C3 feature that is only visible in the low-mass-loss-rate sources that are relatively unobscured by dusty circumstellar envelopes.
AGB stars are LPVs, so we have examined both the color and the magnitude as a function of period. We find a period-color relationship consistent with the hypothesis of Marengo et al. (2001) that semiregular variables lose mass discontinuously, leading to a lack of hot dust producing redder colors. In contrast, the Mira variables extend along a more linear sequence toward redder colors as we might expect based on the fact that their mass-loss rates are more sustained in time.
The period-luminosity distribution of Galactic AGB stars is similar to that found by Riebel et al. (2012) for the LMC. Mira variables fall along the fundamental pulsation sequence C. Semiregular variables are mostly in sequences A and B, reflecting the presence of higher overtone modes and shorter periods.
We derive a relationship between mass-loss rate and [3.6][8.0] color separately for O-rich AGB stars and carbon stars. The overall shape of the fits is similar to those found by other authors for AGB stars in the LMC, albeit corresponding to a higher mass-loss rate for a given [3.6][8.0] color. Discrepancies between our fits and those found by other authors likely reflect different assumptions used in the radiative transfer models used to derive mass-loss rates and uncertainties in the gas-to-dust ratio. In addition, we find that neither color nor mass-loss rate is a good discriminator of chemical type, suggesting that care must be taken when inferring the chemical contribution of dust returned to the ISM by AGB stars.
Acknowledgements
We thank the referee, Jacco van Loon, for a thoughtful review and suggestions that improved the quality of the manuscript. This work is based on observations made with the Spitzer Space Telescope, which is operated by the Jet Propulsion Laboratory, California Institute of Technology under NASA contract 1407. This research has made use of the SIMBAD database, operated at CDS, Strasbourg, France. Support for this work was provided by NASA through an award issued by JPL/Caltech. This work is also supported by the National Science Foundation’s Research Experience for Undergraduates program. MR wishes to thank the REU coordinators Saku Vrtilek, Christine Jones, Melissa Cirtain, and Jonathan McDowell for all their guidance and support.
References
- Adelman & Maher (1998) Adelman S.J., Maher D.W., 1998, IBVS, 4591, 1
- Aoki et al. (1999) Aoki W., Tsuji T., Ohnaka K., 1999, IAUS, 191, 175
- Baud & Habing (1983) Baud B., Habing J.H., 1983, A&A, 127, 73
- Benjamin et al. (2003) Benjamin R.A. et al., 2003, PASP, 115, 953
- Bergeat & Chevallier (2005) Bergeat J., Chevallier L., 2005, A&A, 429, 235
- Blanco et al. (2000) Blanco A., Borghesi A., Fonti S., Orofino V., 2000, A&A, 357, 515
- Blum et al. (2006) Blum R.D. et al., 2006, AJ, 132, 2034
- Boothroyd & Sackmann (1992) Boothroyd A.I., Sackmann I.-J., 1992, ApJ, 393, 21
- Boyer et al. (2011) Boyer M.L. et al., 2011, AJ, 142, 103
- Boyer et al. (2012) Boyer M.L. et al., 2012, ApJ, 748, 40
- Chen et al. (2007) Chen X., Shen Z.-Q., Xu Y., 2007, Chin. J. Astron. Astrophys., 7, 531
- Churchwell et al. (2009) Churchwell E. et al., 2009, PASP, 121, 213
- Currie et al. (2010) Currie T. et al., 2010, ApJS, 186, 191
- De Beck et al. (2010) De Beck E., Decin L., de Koter A., Justtanont K., Verhoelst T., Kemper F., Menten K.M., 2010, A&A, 523, 18
- Dupree et al. (2009) Dupree A.K., Smith G.H., Strader J., 2009, AJ, 138, 1485
- Dwek & Cherchneff (2011) Dwek E., Cherchneff I., 2011, ApJ, 727, 63
- Fazio et al. (2004) Fazio G. et al., 2004, ApJS, 154, 10
- Feast et al. (1989) Feast M.W., Glass I.S., Whitelock P.A., Catchpole R.M., 1989, MNRAS, 241, 375
- Ferrarotti & Gail (2006) Ferrarotti A.S., Gail, H.-P., 2006, A&A, 447, 553
- Freedman et al. (2001) Freedman W.L. et al., 2001, ApJ, 553, 47
- Gehrz (1989) Gehrz R., 1989, in IAU Sypm. 135, Interstellar Dust, ed. L.J. Allamandola & A.G.G.M. Tielens (Cambridge: Cambridge Univ. Press), 445
- Gérard & Le Bertre (2006) Gérard E., Le Bertre T., 2006, AJ, 132, 2566
- Glass et al. (2009) Glass I.S., Schultheis M., Blommaert J.A.D.L., Sahai R., Stute M., Uttenthaler S., 2009, MNRAS, 395, L11
- Groenewegen (2006) Groenewegen M.A.T., 2006, A&A, 448, 181
- Groenewegen et al. (2007) Groenewegen M.A.T. et al., 2007, MNRAS, 376, 313
- Groenewegen et al. (2009) Groenewegen M.A.T., Sloan G.C., Soszyński I., Petersen E.A., 2009, A&A, 506, 1277
- Gruendl et al. (2008) Gruendl R.A., Chu Y.-H., Seale J.P., Matsuura M., Speck A.K., Sloan G.C., Looney L.W., 2008, ApJL, 688, 9
- Guandalini et al. (2006) Guandalini R. et al., 2006, A&A, 445, 1069
- Guandalini et al. (2006) Guandalini R., Busso M., Ciprini S., Silvestro G., Persi P., 2006, A&A, 445, 1069
- Guandalini & Busso (2008) Guandalini R., Busso M., 2008, A&A, 488, 675
- Gullieuszik et al. (2012) Gullieuszik M. et al., 2012, A&A, 537, 105
- Heras & Hony (2005) Heras A.M., Hony S., 2005, A&A, 439, 171
- Humphreys (1978) Humphreys R.M., 1978, ApJS, 38, 309
- Humphreys et al. (1997) Humphreys R.M. et al., 1997, AJ, 114, 2778
- Hyland et al. (1972) Hyland A.R., Becklin E.E., Frogel J.A., Neugebauer G., 1972, A&A, 16, 204
- Iben (1991) Iben I., Jr. 1991, ApJS, 76, 55
- Javadi et al. (2011) Javadi A., van Loon J.Th., Mirtorabi M.T., 2011, MNRAS, 411, 263
- Javadi et al. (2013) Javadi A., van Loon J.Th., Khosroshahi H., Mirtorabi M.T., 2013, MNRAS, 432, 2824
- Kerschbaum & Hron (1996) Kerschbaum F., Hron J., 1996, A&A, 308, 486
- Knapp & Morris (1985) Knapp G.R., Morris M., 1985, ApJ, 292, 640
- Kurayama et al. (2005) Kurayama T., Sasao T., Kobayashi H., 2005, ApJ, 627, 49
- Levesque et al. (2005) Levesque E.M., Massey P., Olsen K.A.G., Plez B., Josselin E., Maeder A., Meynet G., 2005, ApJ, 628, 973
- Loup et al. (1993) Loup C., Forveille T., Omont A., Paul J.F., 1993, A&AS, 99, 291
- Mauas et al. (2006) Mauas P.J.D., Cacciari C., Pasquini L., 2006, A&A, 454, 609
- Marengo et al. (1999) Marengo M., Busso M., Silvestro G., Persi P., Lagage P.O., 1999, A&A, 348, 501
- Marengo et al. (2001) Marengo M., Ivezić Ž., Knapp G.R., 2001, MNRAS, 324, 1117
- Marengo et al. (2007) Marengo M., Hora J.L., Barmby P., Willner S.P., Allen L.E., Schuster M.T., Fazio G.G., 2007, in proc. “Why Galaxies Care About Stars”, ASP Conf. Series (eds. F. Kerschbaum, C. Charbonnel, R. F. Wing), vol. 378, p. 80 (arXiv:astro-ph/0611346)
- Marengo et al. (2009) Marengo M. et al., 2009, ApJ, 700, 1647
- Marshall et al. (2004) Marshall J.R., van Loon J.Th., Matsuura M., Wood P.R., Zijlstra A.A., Whitelock P.A., 2004, MNRAS, 355, 1348
- Massey & Olsen (2003) Massey P., Olsen K.A.G., 2003, AJ, 126, 2867
- Matsuura et al. (2009) Matsuura M. et al., 2009, MNRAS, 396, 918
- Matsuura et al. (2011) Matsuura M. et al., 2011, Science, 333, 1258
- Matsuura et al. (2013) Matsuura M., Woods P.M., Owen P.J., 2013, MNRAS, 429, 2527
- Meixner et al. (2006) Meixner M. et al., 2006, AJ, 132, 2268
- Millan-Gabet et al. (2005) Millan-Gabet et al., 2005, ApJ, 620, 961
- Monnier et al. (1997) Monnier J.D. et al., 1997, ApJ, 481, 420
- Morris & Jura (1983) Morris M., Jura M., 1983, ApJ, 267, 179
- Nieuwenhuijzen & De Jager (1990) Nieuwenhuijzen H., De Jager C., 1990, A&A, 231, 134
- Noriega-Crespo et al. (2004) Noriega-Crespo A., et al., 2004, ApJS, 154, 352
- Olofsson et al. (2002) Olofsson H., González Delgado D., Kerschbaum F., Schöier F.L., 2002, A&A, 391, 1053
- Oudmaijer et al. (1996) Oudmaijer R.D., Groenewegen M.A.T., Matthews H.E., Blommaert J.A.D.L., Sahu K.C., 1996, MNRAS, 280, 1062
- Ramstedt et al. (2009) Ramstedt S., Schöier F.L., Olofsson H., 2009, A&A, 499, 515
- Reimers (1975) Reimers D., 1975, Man. Soc. Roy. Sci. Liege, Sth Ser., Vol. 8, 369
- Riebel et al. (2010) Riebel D., Meixner M., Fraser O., Srinivasan S., Cook K., Vijh U., 2010, ApJ, 723, 1195
- Riebel et al. (2012) Riebel D., Srinivasan S., Sargent B., Meixner M., 2012, ApJ, 753, 71
- Salpeter (1974) Salpeter E.E., 1974, ApJ, 193, 585
- Samus et al. (2012) Samus N.N., 2012, General Catalog of Variable Stars (GCVS database, Version 2012Apr)
- Schöier et al. (2013) Schöier F.L., Ramstedt S., Olofsson H., Lindqvist M., Bieging J.H., Marvel K.B., 2013, A&A, 550, 78
- Schuster et al. (2006) Schuster M.T., Marengo M., Patten B.M., 2006, Proceedings of the SPIE, 6270-74
- Schuster (2007) Schuster M.T., 2007, PhD thesis, Univ. Minnesota
- Sedlmayr (1994) Sedlmayr E. 1994, in Molecules in the Stellar Environment, U.G. Jørgensen (ed.), Springer, Berlin, p.163
- Skrutskie et al. (2006) Skrutskie M.T. et al., 2006, AJ, 131, 1163
- Sloan & Price (1998) Sloan G.C., Price S.D., 1998, ApJS, 119, 141
- Sloan et al. (2003) Sloan G.C., Kraemer K.E., Price S.D., Shipman R.F. 2003, ApJS, 147, 379
- Smith & Lambert (1985) Smith V.V., Lambert D.L., 1985, ApJ, 294, 326
- Straniero et al. (1995) Straniero O., Gallino R., Busso M., Chiefei A., Raiteri C.M., Limongi M., Salaris M., 1995, ApJ, 440, 85
- Straniero et al. (1997) Straniero O., Chieffi A., Limongi M., Busso M., Gallino R., Arlandini C., 1997, ApJ, 478, 332
- Tabur et al. (2010) Tabur V., Bedding T. R., Kiss L.L., Giles T., Derekas A., Moon T,T., MNRAS, 409, 777
- Tuthill et al. (2000) Tuthill P.G., Monnier J.D., Danchi W.C., Lopez B., 2000, ApJ, 543, 284
- Valentijn et al. (1996) Valentijn E.A. et al., 1996, A&A, 315, 60
- van Belle et al. (2002) van Belle G.T., Thompson R.R., Creech-Eakman M.J., 2002, AJ, 124, 1706
- van Dyk et al. (2003) van Dyk S., Li W., Filippenko A.V., 2003, PASP, 115, 1289
- van Loon et al. (1999) van Loon J.Th., Groenewegen M.A.T., de Koter A., Trams N.R., Waters L.B.F.M., Zijlstra A.A., Whitelock P.A., Loup C., 1999, A&A, 351, 559
- van Loon (2000) van Loon J.Th., 2000, A&A, 354, 125
- van Loon et al. (2008) van Loon J.Th., Cohen M., Oliveira J.M., Matsuura M., McDonald I., Sloan G.C., Wood P.R., Zijlstra A.A., 2008, A&A, 487, 1055
- van Leeuwen (2007) van Leeuwen F., 2007, A&A, 474, 653
- Vassiliadis & Wood (1993) Vassiliadis E., Wood P.R., 1993, ApJ, 413, 641
- Ventura et al. (2012) Ventura P. et al., 2012, MNRAS, 424, 2345
- Verhoelst et al. (2009) Verhoelst T., van der Zypen N., Hony S., Decin L., Cami J., Eriksson K., 2009, A&A, 498, 127
- Walker (2011) Walker A.R., 2011, Ap&SS, 341, 43
- Werner et al. (2004) Werner M. et al., 2004, ApJS, 154, 1
- Whitelock et al. (1994) Whitelock P., Menzies J., Feast M., Marang F., Carter B., Roberts G., Catchpole R., Chapman J., 1994, MNRAS, 267, 711
- Whitelock et al. (2006) Whitelock P.A., Feast M.W., Marang F., Groenewegen M.A.T., 2006, MNRAS, 369, 751
- Whitelock et al. (2008) Whitelock P.A., Feast M.W., van Leeuwen F., 2008, MNRAS, 386, 313
- Wilson (1976) Wilson O.C., 1976, ApJ, 205, 823
- Willson (2000) Willson L.A., 2000, ARA&A, 38, 573
- Wood et al. (1983) Wood P.R., Bessell M.S., Fox M.W., 1983, ApJ, 272, 99
- Wood et al. (1992) Wood P.R., Whiteoak J.B., Hughes S.M.G., Bessell M.S., Gardner F.F., Hyland A.R., 1992, ApJ, 397, 552
- Wood (2010) Wood P.R., 2010, Mem. S. A. It, 81, 883
- Young (1995) Young K., 1995, ApJ, 445,872
- Zhang et al. (2012) Zhang B., Reid M.J., Menten K.M., Zheng X.W., Brunthaler A., 2012, A&A, 544, 42
- Zhang & Jiang (2008) Zhang K., Jiang B., 2008, ScChG, 51, 1187
| Target | IRAS name | Var. | Period | Dist | Dist | J Mag | H Mag | K Mag | ||
| [days] | [kpc] | ref. | [M⊙/yr] | ref. | ||||||
| O-RICH STARS | ||||||||||
| KU And | 000424248 | M | 750 | 0.68 | 14 | 2.4 | 11 | 3.0410.216 | 1.8290.156 | 1.1150.208 |
| RW And | 004453224 | M | 430 | 0.86 | 7 | 1.9 | 17 | 3.0520.238 | 2.2250.210 | 1.7650.228 |
| VY Cas | 004846238 | SRb | 100 | 0.57 | 16 | … | … | 2.4710.254 | 1.4840.186 | 1.1140.234 |
| SV Psc | 014381850 | SRb | 102 | 0.38 | 12 | 3.0 | 12 | 2.0160.244 | 1.0120.190 | 0.7220.188 |
| RR Per | 022515102 | M | 389 | 0.82 | 15 | … | … | 3.2170.244 | 2.3250.196 | 1.6620.244 |
| RV Cam | 042655718 | SRb | 101 | 0.35 | 12 | 2.5 | 12 | 1.6670.254 | 0.6020.164 | 0.4120.170 |
| ET Vir | 140811604 | SRb | 80 | 0.14 | 16 | … | … | 1.6510.266 | 0.8140.290 | 0.5980.304 |
| RW Boo | 143903147 | SRb | 209 | 0.29 | 16 | … | … | 1.5600.206 | 0.5300.150 | 0.3010.170 |
| AX Sco | 163872700 | SRb | 138 | 0.34 | 16 | … | … | 2.1590.270 | 1.2240.282 | 0.9010.320 |
| TV Dra | 170816422 | SR | … | 0.51 | 16 | 2.0 | 11 | 1.9420.416 | 1.0580.174 | 0.6930.194 |
| V438 Oph | 171231107 | SRb | 169 | 0.42 | 4 | … | … | 1.8710.244 | 0.9350.292 | 0.5510.312 |
| TY Dra | 173615746 | Lb | … | 0.43 | 12 | 6.0 | 12 | 2.4100.296 | 1.4650.158 | 1.0830.194 |
| CZ Ser | 183470241 | Lb | … | 0.44 | 12 | 8.0 | 12 | 2.5570.302 | 1.4050.274 | 0.9300.310 |
| FI Lyr | 184012854 | SRb | 146 | 0.88 | 6 | 3.8 | 6 | 2.0400.282 | 1.1210.164 | 0.7150.212 |
| V1351 Cyg | 194095520 | Lb | … | 0.32 | 16 | … | … | 1.8160.266 | 0.7870.170 | 0.5610.208 |
| Z Cyg | 200004954 | M | 263 | 0.94 | 5 | 4.0 | 19 | 4.1760.268 | 3.2580.228 | 2.5570.306 |
| V1300 Aql | 200770625 | M | 680 | 0.66 | 11 | 1.3 | 11 | 6.9060.032 | 3.9230.260 | 2.0590.262 |
| V584 Aql | 200790146 | Lb | … | 0.39 | 12 | 5.0 | 12 | 2.1360.312 | 1.1470.204 | 0.8010.266 |
| RX Vul | 205072310 | M | 457 | 0.71 | 18 | … | … | 2.7240.290 | 1.6550.188 | 1.0830.228 |
| UX Cyg | 205293013 | M | 565 | 1.85 | 9 | 3.2 | 11 | 2.9100.310 | 1.8870.180 | 1.4000.194 |
| SS Peg | 223152418 | M | 424 | 0.71 | 18 | … | … | 2.5490.270 | 1.5130.182 | 1.1210.162 |
| V563 Cas | 231476009 | M | 534 | 2.09 | 11 | … | … | 5.0880.037 | 3.8820.036 | 3.2270.248 |
| C-RICH STARS | ||||||||||
| VX And | 001724425 | SRa | 369 | 0.56 | 6 | 1.4 | 6 | 3.1870.266 | 1.8910.202 | 1.1930.202 |
| HV Cas | 010805327 | M | 527 | 0.97 | 14 | 3.2 | 6 | 5.5850.039 | 3.9110.222 | 2.4660.290 |
| R For | 022702619 | M | 339 | 0.97 | 14 | 5.0 | 6 | 4.2300.274 | 2.5370.206 | 1.3490.274 |
| V623 Cas | 030755742 | Lb | … | 0.51 | 6 | 1.1 | 6 | 2.8690.210 | 1.7060.204 | 1.2080.212 |
| UV Aur | 051853227 | M | 394 | 1.09 | 6 | 1.6 | 6 | 4.0290.214 | 3.0180.192 | 2.1290.220 |
| SY Per | 041274030 | SR | 474 | 1.43 | 6 | 1.5 | 6 | 4.5960.316 | 3.0330.274 | 2.1320.340 |
| TU Tau | 054212424 | SRb | 190 | 1.05 | 6 | 5.7 | 6 | 3.3310.266 | 2.0930.210 | 1.5740.220 |
| BN Mon | 061920722 | SRb | 600 | 1.28 | 1 | 4.2 | 6 | 4.5170.312 | 3.0960.256 | 2.3220.308 |
| CR Gem | 063151606 | Lb | … | 0.92 | 6 | 8.4 | 6 | 3.5750.302 | 2.0300.250 | 1.5380.240 |
| V614 Mon | 065850310 | SRb | 60 | 0.48 | 6 | 1.5 | 6 | 3.2270.206 | 2.3070.206 | 1.7640.224 |
| CGCS 6296 | 083053314 | … | … | 4.21 | 6 | 1.3 | 6 | … | … | 11.1 |
| SZ Car | 095825958 | SRb | 126 | 0.37 | 6 | 4.6 | 6 | 3.2060.332 | 2.1120.280 | 1.6000.346 |
| V CrB | 154773943 | M | 358 | 0.84 | 6 | 1.3 | 6 | 3.4740.272 | 2.2090.218 | 1.3210.276 |
| SX Sco | 174413541 | SR | … | 0.83 | 6 | 3.8 | 6 | 3.1040.222 | 1.8840.210 | 1.3900.254 |
| FX Ser | 180400941 | Lb | … | 1.23 | 6 | 3.1 | 6 | 7.1360.023 | 4.7200.076 | 2.7020.218 |
| DR Ser | 184480523 | Lb | … | 1.29 | 6 | 1.0 | 6 | 3.8330.270 | 2.4880.218 | 1.8390.286 |
| S Sct | 184760758 | SRb | 148 | 0.58 | 6 | 5.6 | 6 | 2.3030.314 | 1.1400.262 | 0.6270.288 |
| RS Cyg | 201153834 | SRa | 418 | 0.65 | 6 | 2.0 | 6 | 3.2060.228 | 1.9850.190 | 1.3210.246 |
| T Ind | 211684514 | SRb | 320 | 0.65 | 6 | 1.7 | 6 | 1.9810.248 | 0.9700.262 | 0.5640.316 |
| S-RICH STARS | ||||||||||
| R Gem | 070432246 | M | 370 | 0.71 | 13 | 2.1 | 11 | 2.5300.244 | 1.6420.218 | 1.4590.226 |
| NQ Pup | 075071129 | Lb | … | 0.81 | 16 | … | … | 3.5420.292 | 2.5870.212 | 2.3060.274 |
| S UMa | 124176121 | M | 226 | 1.09 | 18 | … | … | 4.4580.214 | 3.4310.196 | 3.0170.246 |
| R Cyg | 193545005 | M | 426 | 0.44 | 14 | 1.6 | 11 | 2.2510.314 | 1.3790.208 | 0.8610.246 |
| AA Cyg | 200263640 | SRb | 213 | 0.48 | 13 | … | … | 2.0660.288 | 1.0500.166 | 0.6250.224 |
| X Aqr | 221592109 | M | 312 | 1.32 | 18 | … | … | 4.7100.190 | 3.8230.196 | 3.3380.248 |
| HR Peg | 225211640 | SRb | 50 | 0.42 | 16 | … | … | 2.3060.270 | 1.2390.194 | 1.0410.206 |
| SUPERGIANTS | ||||||||||
| XX Per | 015975459 | SRc | 415 | 2.29 | 3 | … | … | 3.4420.262 | 2.4800.232 | 1.9720.242 |
| W Per | 024695646 | SRc | 485 | 2.29 | 3 | … | … | 3.0950.202 | 1.9990.172 | 1.5680.252 |
| NO Aur | 053743153 | Lc | … | 0.60 | 16 | … | … | 2.1220.322 | 1.1280.202 | 0.9710.196 |
| U Lac | 224565453 | SRc | … | 2.75 | 10 | … | … | 3.8150.224 | 2.6720.166 | 1.9320.206 |
| NML Cyg | R204453955 | SRc | 940 | 1.61 | 20 | 6.4 | 21,22 | 4.8770.037 | 2.3890.200 | 0.7910.204 |
| VX Sgr | 180502213 | SRc | 732 | 1.57 | 2 | 6.1 | 4 | 1.7440.260 | 0.5500.304 | 0.1220.362 |
| from Table 4.4 in Schuster (2007), multiple velocity components detected, Monnier et al. 1997. |
| References: (1) Bergeat & Chevallier 2005; (2) Chen et al. 2007; (3) Currie et al. 2010; (4) De Beck et al. 2010; (5) Feast et al. 1989; |
| (6) Guandalini et al. 2006; (7) Guandalini & Busso 2008; (8) Humphreys 1978; (9) Kurayama et al. 2005; (10) Levesque et al. 2005; |
| (11) Loup et al. 1993; (12) Olofsson et al. 2002; (13) Ramstedt et al. 2009; (14) Schöier et al. 2013; (15) van Belle et al. 2002; |
| (16) van Leeuwen 2007; (17) Whitelock et al. 1994; (18) Whitelock et al. 2008; (19) Young 1995; (20) Zhang et al. 2012; |
| (21) Hyland et al. 1972; and (22) Morris & Jura 1983. |
| Target | IRAS name | epoch | MJDa | [3.6] | [4.5] | [5.8] | [8.0] |
|---|---|---|---|---|---|---|---|
| O-RICH STARS | |||||||
| KU And | 000424248 | 1 | 53961.9209 | 1.1400.031 | 0.2910.021 | 0.4000.015 | 1.5840.076 |
| KU And | 000424248 | 2 | 54328.9385 | 1.7470.027 | 0.8790.024 | 0.1080.018 | 1.1750.074 |
| RW And | 004453224 | 1 | 53960.9362 | 1.1090.030 | 1.0420.028 | 0.7420.022 | 0.2160.066 |
| RW And | 004453224 | 2 | 54324.8287 | 0.9040.025 | 0.8310.023 | 0.5460.027 | 0.0960.059 |
| VY Cas | 004846238 | 1 | 54005.9215 | 0.8790.024 | 0.9810.027 | 0.7860.022 | 0.5640.027 |
| VY Cas | 004846238 | 2 | 54149.6210 | 0.8430.024 | 0.9290.026 | 0.7310.032 | 0.4850.025 |
| SV Psc | 014381850 | 1 | 53961.9248 | 0.3950.023 | 0.4680.025 | 0.2560.021 | 0.0270.042 |
| SV Psc | 014381850 | 2 | 54149.6256 | 0.3050.015 | 0.4110.016 | 0.2020.020 | 0.0630.031 |
| RR Per | 022515102 | 1 | 54005.9269 | 0.4270.024 | 0.3200.015 | 0.0440.017 | 0.2890.033 |
| RR Per | 022515102 | 2 | 54149.9993 | 0.7640.022 | 0.7750.022 | 0.5020.017 | 0.2020.020 |
| RV Cam | 042655718 | 1 | 54005.9347 | 0.3270.015 | 0.4510.016 | 0.2770.021 | 0.0730.023 |
| RV Cam | 042655718 | 2 | 54396.8337 | 0.2840.014 | 0.4350.016 | 0.2160.020 | 0.0730.023 |
| ET Vir | 140811604 | 1 | 53957.3504 | 0.3950.016 | 0.5730.018 | 0.4430.024 | 0.3720.031 |
| ET Vir | 140811604 | 2 | 54148.6245 | 0.3870.023 | 0.5370.027 | 0.4270.024 | 0.3720.031 |
| RW Boo | 143903147 | 1 | 53922.4493 | 0.1270.018 | 0.3870.016 | 0.1450.019 | 0.0530.032 |
| RW Boo | 143903147 | 2 | 54149.9923 | 0.1330.018 | 0.3870.016 | 0.1700.019 | 0.0480.033 |
| AX Sco | 163872700 | 1 | 53997.8064 | 0.5640.018 | 0.6490.020 | 0.4350.016 | 0.2560.021 |
| AX Sco | 163872700 | 2 | 54357.9155 | 0.5820.019 | 0.7000.015 | 0.4850.017 | 0.2910.028 |
| TV Dra | 170816422 | 1 | 54005.9137 | 0.1770.021 | 0.2630.021 | 0.0610.017 | 0.1230.019 |
| TV Dra | 170816422 | 2 | 54286.3724 | 0.1700.019 | 0.2420.020 | 0.0220.017 | 0.1610.019 |
| V438 Oph | 171231107 | 1 | 54002.9634 | 0.2090.020 | 0.2940.014 | 0.0960.018 | 0.0940.020 |
| V438 Oph | 171231107 | 2 | 54357.9197 | 0.1640.019 | 0.2630.021 | 0.0730.017 | 0.1800.020 |
| TY Dra | 173615746 | 1 | 54005.9110 | 0.6790.020 | 0.8910.020 | 0.6490.030 | 0.2840.042 |
| TY Dra | 173615746 | 2 | 54286.3697 | 0.6890.020 | 0.8790.024 | 0.6590.030 | 0.2980.057 |
| CZ Ser | 183470241 | 1 | 54005.8978 | 0.5190.026 | 0.7100.021 | 0.4350.024 | 0.2770.028 |
| CZ Ser | 183470241 | 2 | 54229.6547 | 0.5910.037 | 0.7420.032 | 0.4760.025 | 0.2910.028 |
| FI Lyr | 184012854 | 1 | 54005.9018 | 0.4110.016 | 0.6010.028 | 0.3570.023 | 0.1080.030 |
| FI Lyr | 184012854 | 2 | 54357.9236 | 0.4190.024 | 0.6010.019 | 0.3720.023 | 0.1140.048 |
| V1351 Cyg | 194095520 | 1 | 53956.9174 | 0.1960.020 | 0.3950.023 | 0.2290.020 | 0.1770.019 |
| V1351 Cyg | 194095520 | 2 | 54286.3181 | 0.2090.020 | 0.4030.016 | 0.2220.020 | 0.1640.025 |
| Z Cyg | 200004954 | 1 | 54005.9076 | 2.1740.056 | 1.8920.043 | 1.6200.047 | 0.9290.077 |
| Z Cyg | 200004954 | 2 | 54286.3642 | 1.8620.060 | 1.6690.051 | 1.4220.060 | 0.7530.065 |
| V1300 Aql | 200770625 | 1 | 54430.9969 | 0.1450.025 | 0.4830.028 | 1.1870.022 | 2.2800.040 |
| V1300 Aql | 200770625 | 2 | 54637.7548 | 0.6490.020 | 0.0500.017 | 0.6470.024 | 1.6270.036 |
| V584 Aql | 200790146 | 1 | 54064.4277 | 0.4270.016 | 0.5020.017 | 0.3050.022 | 0.0910.024 |
| V584 Aql | 200790146 | 2 | 54430.9864 | 0.4270.016 | 0.5020.017 | 0.2940.021 | 0.0330.034 |
| RX Vul | 205072310 | 1 | 54286.3354 | 0.4190.024 | 0.4680.017 | 0.1700.019 | 0.1040.020 |
| RX Vul | 205072310 | 2 | 54430.9901 | 0.4930.026 | 0.6100.029 | 0.3420.022 | 0.0440.034 |
| UX Cyg | 205293013 | 1 | 54286.3327 | 1.0090.027 | 0.7310.021 | 0.4110.024 | 0.4030.075 |
| UX Cyg | 205293013 | 2 | 54430.9927 | 1.6290.034 | 1.3070.036 | 0.9680.026 | 0.1830.051 |
| SS Peg | 223152418 | 1 | 54286.3777 | 0.8200.023 | 0.6490.020 | 0.3800.023 | 0.0050.022 |
| SS Peg | 223152418 | 2 | 54100.2776 | 0.6690.030 | 0.6690.020 | 0.4190.016 | 0.1640.038 |
| V563 Cas | 231476009 | 1 | 53956.1633 | 2.5850.035 | 2.0970.037 | 1.6840.041 | 1.0360.056 |
| V563 Cas | 231476009 | 2 | 54149.4121 | 2.9350.032 | 2.6390.037 | 2.1900.041 | 1.6200.097 |
| C-RICH STARS | |||||||
| VX And | 001724425 | 1 | 53961.0086 | 0.1580.019 | 0.3570.023 | 0.4850.025 | 0.2160.027 |
| VX And | 001724425 | 2 | 54150.6613 | 0.1830.019 | 0.3950.023 | 0.5280.018 | 0.1570.019 |
| HV Cas | 010805327 | 1 | 53961.4766 | 0.8910.025 | 0.3420.015 | 0.1080.029 | 0.5890.032 |
| HV Cas | 010805327 | 2 | 54150.6238 | 0.3570.015 | 0.1520.019 | 0.5730.016 | 0.9550.023 |
| R For | 022702619 | 1 | 53961.0145 | 0.4760.018 | 0.9000.019 | 1.2270.018 | 1.6210.037 |
| R For | 022702619 | 2 | 54357.9070 | 0.3540.016 | 0.8110.016 | 1.1600.019 | 1.5710.051 |
| V623 Cas | 030755742 | 1 | 54005.9318 | 0.4850.017 | 0.5460.018 | 0.3050.022 | 0.1020.018 |
| V623 Cas | 030755742 | 2 | 54357.9005 | 0.4930.017 | 0.5640.018 | 0.3570.023 | 0.1200.018 |
| SY Per | 041274030 | 1 | 54396.8364 | 0.8200.046 | 0.7860.034 | 0.6490.040 | 0.6050.029 |
| SY Per | 041274030 | 2 | 54531.1417 | 0.9420.039 | 0.8790.037 | 0.7750.033 | 0.3870.047 |
| UV Aur | 051853227 | 1 | 54005.9383 | 1.4220.029 | 1.0170.022 | 0.6200.019 | 0.1640.025 |
| UV Aur | 051853227 | 2 | 54191.1691 | 1.1710.026 | 0.8550.024 | 0.4510.025 | 0.1700.025 |
| TU Tau | 054212424 | 1 | 54396.8428 | 0.9810.027 | 1.0940.029 | 0.9290.038 | 0.4110.024 |
| TU Tau | 054212424 | 2 | 54188.7098 | 0.9550.021 | 1.0510.029 | 0.9160.025 | 0.3950.023 |
| BN Mon | 061920722 | 1 | 54038.7664 | 1.4630.029 | 1.5500.036 | 1.4220.040 | 1.0360.042 |
| BN Mon | 061920722 | 2 | 54396.8610 | 1.4540.021 | 1.5500.032 | 1.4630.042 | 1.0220.055 |
| Target | IRAS name | epoch | MJDa | [3.6] | [4.5] | [5.8] | [8.0] |
|---|---|---|---|---|---|---|---|
| C-RICH STARS | |||||||
| CR Gem | 063151606 | 1 | 54061.8204 | 0.9950.027 | 0.9160.025 | 0.6010.028 | 0.4850.034 |
| CR Gem | 063151606 | 2 | 54396.8582 | 0.8550.024 | 0.8670.024 | 0.5550.027 | 0.4190.032 |
| V614 Mon | 065850310 | 1 | 54069.0020 | 1.2720.025 | 1.4220.028 | 1.2540.026 | 0.9550.039 |
| V614 Mon | 065850310 | 2 | 54190.6094 | 1.2720.025 | 1.4220.032 | 1.2650.028 | 1.0090.041 |
| CGCS 6296 | 083053314 | 1 | 54466.0597 | 4.1200.048 | 2.4470.052 | 1.1240.031 | 0.1330.029 |
| CGCS 6296 | 083053314 | 2 | 54600.7407 | 4.6740.121 | 2.9350.049 | 1.5500.045 | 0.1830.064 |
| SZ Car | 095825958 | 1 | 53888.8675 | 1.0650.029 | 1.1710.032 | 1.0650.029 | 0.7420.032 |
| SZ Car | 095825958 | 2 | 54148.6298 | 0.9760.027 | 1.0800.029 | 0.9160.038 | 0.6590.030 |
| V CrB | 154773943 | 1 | 53959.8338 | 0.8740.019 | 0.3870.016 | 0.0480.021 | 0.3850.015 |
| V CrB | 154773943 | 2 | 54152.9619 | 0.4030.016 | 0.0630.015 | 0.4470.014 | 0.8110.021 |
| SX Sco | 174413541 | 1 | 53997.2559 | 0.8910.049 | 1.0220.042 | 0.9420.039 | 0.4760.034 |
| SX Sco | 174413541 | 2 | 54396.9331 | 0.8670.048 | 1.0650.043 | 0.9950.041 | 0.4760.034 |
| FX Ser | 180400941 | 1 | 54002.9673 | 0.1180.019 | 0.7870.016 | 1.2980.023 | 1.8110.041 |
| FX Ser | 180400941 | 2 | 54396.9368 | 0.2630.021 | 0.4330.022 | 0.9690.022 | 1.5050.041 |
| DR Ser | 184480523 | 1 | 54039.4356 | 1.3440.037 | 1.5050.043 | 1.4020.040 | 1.0510.043 |
| DR Ser | 184480523 | 2 | 54229.1684 | 1.4420.041 | 1.5720.046 | 1.5050.065 | 1.1560.063 |
| S Sct | 184760758 | 1 | 54005.8936 | 0.0580.021 | 0.0960.024 | 0.0440.028 | 0.3380.020 |
| S Sct | 184760758 | 2 | 54396.9396 | 0.0990.020 | 0.0730.023 | 0.0280.028 | 0.3850.038 |
| RS Cyg | 201153834 | 1 | 54036.9492 | 0.9630.026 | 1.0800.029 | 0.8670.024 | 0.7640.055 |
| RS Cyg | 201153834 | 2 | 54286.3299 | 1.2540.034 | 1.0650.043 | 0.7420.022 | 0.8670.048 |
| T Ind | 211684514 | 1 | 54069.0284 | 0.2420.020 | 0.3800.015 | 0.1770.019 | 0.0050.022 |
| T Ind | 211684514 | 2 | 54430.9820 | 0.2630.021 | 0.3870.023 | 0.2160.020 | 0.0280.017 |
| S-RICH STARS | |||||||
| R Gem | 070432246 | 1 | 54068.8159 | 1.2100.027 | 1.2140.027 | 0.8910.037 | 0.4760.051 |
| R Gem | 070432246 | 2 | 54228.7301 | 1.1400.031 | 1.0800.029 | 0.7860.022 | 0.4680.033 |
| NQ Pup | 075071129 | 1 | 54069.3910 | 1.9900.034 | 2.1900.041 | 2.0240.065 | 1.9900.034 |
| NQ Pup | 075071129 | 2 | 54228.8126 | 1.9900.034 | 2.2150.042 | 2.0240.070 | 1.9900.068 |
| S UMa | 124176121 | 1 | 54069.7437 | 2.6200.037 | 2.8340.030 | 2.6270.024 | 2.4680.053 |
| S UMa | 124176121 | 2 | 53889.3814 | 3.0020.035 | 3.1890.041 | 3.0020.052 | 2.7980.072 |
| R Cyg | 193545005 | 1 | 54005.9052 | 0.0670.017 | 0.0220.017 | 0.3770.015 | 0.8560.049 |
| R Cyg | 193545005 | 2 | 54286.3666 | 1.1240.031 | 1.0090.041 | 0.4760.034 | 0.0790.051 |
| AA Cyg | 200263640 | 1 | 54065.7245 | 0.2020.013 | 0.5280.018 | 0.2360.020 | 0.1390.019 |
| AA Cyg | 200263640 | 2 | 54286.3611 | 0.2160.020 | 0.5730.018 | 0.2560.021 | 0.1770.032 |
| X Aqr | 221592109 | 1 | 54286.3244 | 2.1900.065 | 2.1350.062 | 1.9110.044 | 1.7210.053 |
| X Aqr | 221592109 | 2 | 54062.9024 | 2.7290.047 | 2.6770.045 | 2.4470.052 | 2.2150.042 |
| HR Peg | 225211640 | 1 | 53928.4751 | 0.6490.020 | 0.8910.025 | 0.7100.031 | 0.6200.038 |
| HR Peg | 225211640 | 2 | 54095.8618 | 0.6390.020 | 0.8430.024 | 0.6690.030 | 0.5820.028 |
| SUPERGIANTS | |||||||
| XX Per | 015975459 | 1 | 54005.9244 | 1.1710.032 | 1.0880.030 | 0.7210.032 | 0.0850.059 |
| XX Per | 015975459 | 2 | 54150.6211 | 1.2200.033 | 1.1560.032 | 0.7860.034 | 0.1450.062 |
| W Per | 024695646 | 1 | 54005.9295 | 1.2370.036 | 1.1710.032 | 0.8080.034 | 0.1770.064 |
| W Per | 024695646 | 2 | 54152.9557 | 1.2440.034 | 1.1780.032 | 0.8200.035 | 0.1140.060 |
| NO Aur | 053743153 | 1 | 54396.8402 | 0.6100.019 | 0.8430.024 | 0.5820.019 | 0.3200.029 |
| NO Aur | 053743153 | 2 | 54188.5900 | 0.6200.019 | 0.8430.024 | 0.5910.019 | 0.3120.022 |
| U Lac | 224565453 | 1 | 54005.9181 | 0.7860.022 | 0.5730.018 | 0.1960.020 | 0.4620.043 |
| U Lac | 224565453 | 2 | 54328.9353 | 0.7640.022 | 0.5640.018 | 0.1830.019 | 0.4400.024 |
| NML Cyg∗ | R204453955 | 1 | 53213.2738 | 1.530.15 | 2.420.15 | … | 4.530.22 |
| VX Sgr∗ | 180502213 | 1 | 53634.9152 | 1.260.15 | 1.830.15 | … | 3.360.15 |
| a MDJ = JD2,400,000.5 |
| ∗ only one epoch; photometry from Schuster (2007, see Table 4.4) |
| Name | Type | Sequence | Notes |
| O-RICH STARS | |||
| KU And | M | D | low [3.6], large IR excess – extinction from the circumstellar envelope? |
| RW And | M | C | along the bottom of the sequence |
| VY Cas | SRb | BC’ | |
| SV Psc | SRb | C’ | |
| RR Per | M | C | |
| RV Cam | SRb | C’ | |
| ET Vir | SRb | C | smallest 3.6 µm magnitude |
| RW Boo | SRb | C | at the bottom of sequence C, small IR excess |
| AX Sco | SRb | C | near the top of sequence C |
| V438 Oph | SRb | C’C | |
| FI Lyr | SRb | B | at the top of sequence B |
| Z Cyg | M | C | large IR excess |
| V1300 Aql | M | CD | large IR excess, low 3.6 µm, extinction from the circumstellar envelope? |
| RX Vul | M | C | large IR excess, lies at the bottom of C |
| UX Cyg | M | C | one of largest IR excesses |
| SS Peg | M | C+ | just below sequence C, modest 3.6 µm and IR excess compared to other Miras of similar period |
| V563 Cas | M | CD | just below C, among largest IR excesses |
| C-RICH STARS | |||
| VX And | SRa | C | |
| HV Cas | M | C | |
| R For | M | C’ | highest Mira 3.6 µm magnitude |
| UV Aur | M | C | |
| SY Per | SR | C | |
| TU Tau | SRb | C’ | largest IR excess of the SRs |
| BN Mon | SRb | CD | falls just below sequence C |
| V614 Mon | SRb | B | |
| CGCS 6296 | … | … | no period available |
| SZ Car | SRb | C | |
| V CrB | M | C | |
| SX Sco | SR | … | no period available |
| S Sct | SRb | B | |
| RS Cyg | SRa | CD | one of two SRs below C |
| T Ind | SRb | C | |
| S-RICH STARS | |||
| R Gem | M | CD | just below C, modest 3.6 µm and IR excess compared to other Miras of similar period |
| S UMa | M | C | at the top of sequence C, smallest IR excess of the Miras |
| R Cyg | M | CD | slightly closer to D than C |
| AA Cyg | SRb | C | at the top of sequence C |
| X Aqr | M | C | second smallest Mira IR excess |
| HR Peg | SRb | A | only source in A |
| SUPERGIANTS | |||
| XX Per | SRc | C’ | SR with large IR excess |
| W Per | SRc | C’ | right along the lower edge of sequence C’; SR with large IR excess |
| NML Cyg | SRc | C’ | brightest supergiant |
| VX Sgr | SRc | BC’ | along the boundary between sequences B and C’; second brightest supergiant |